
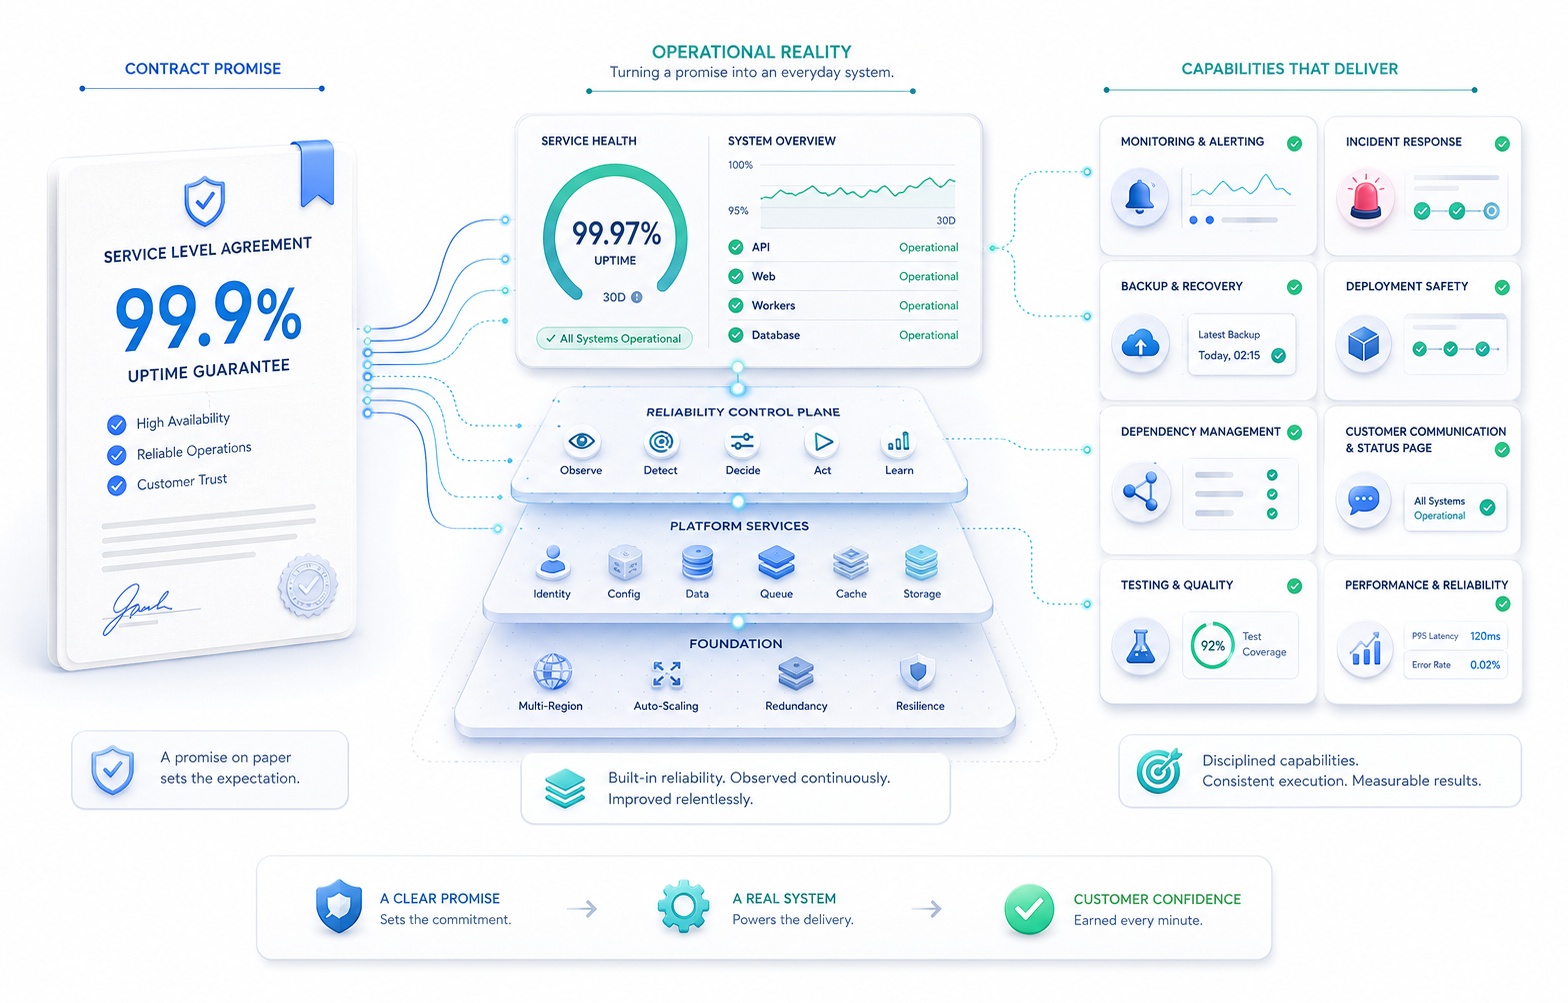
99.9%
Three digits and a decimal point.
On a sales proposal it occupies less horizontal space than the customer's legal entity name. It sits in a table, formatted in the same font as the payment terms and the notice period, and it looks like the kind of detail that gets settled by copying whatever the last contract said. A prospect's procurement team asks for it. A competitor's website advertises it. The MSA template that came from a law firm two funding rounds ago already contains a version of it. Someone with signing authority reads the clause, decides it looks like every other SLA they have seen, and approves.
The number is now a commitment.
What makes availability clauses unusual among contract terms is the distance between how they are written and what they require. A payment term of Net 45 obligates a finance process that already exists. A limitation of liability allocates risk that has already been priced. An availability commitment is different in kind: it asserts a property of a system that has to be produced continuously, by people and machines, under conditions nobody controls, for the entire duration of the contract. Nothing about the sentence "Service Availability: 99.9%" tells you whether the organization signing it can produce that property. The sentence is a claim about the future behavior of a distributed system and about the behavior of the humans who operate it.
Availability commitments are engineering commitments expressed in commercial language. That is the whole of the argument, and everything that follows is an unfolding of it.
This is not a warning against SLAs. Service level agreements are one of the more useful instruments in enterprise software. They convert a vague quality ("we're pretty reliable") into a shared, checkable standard. They give buyers a basis for comparing vendors on something other than feature lists. They give the vendor's own engineering organization a defensible reason to invest in reliability work that would otherwise lose every prioritization argument to the feature roadmap. They create clarity where there was assumption, accountability where there was goodwill, and a common vocabulary for a conversation that would otherwise happen only during an outage. A company that has never written down a reliability target has not avoided the obligation; it has simply left the obligation undefined, which usually means the customer's expectation and the vendor's expectation differ in ways neither party discovers until the worst possible moment.
The failure mode is narrower and more specific. It is promising a level of reliability the organization has never designed for, never measured, never operated at, and never priced. That gap is quiet. It produces no immediate symptom. It surfaces during an incident, in a renewal conversation, or in a quarterly service report that someone has to assemble by hand from incomplete data and then explain to a customer who has been reading the status page.
What follows is an anatomy of one clause. We take a single line from a single contract — Service Availability: 99.9% — and open it layer by layer, following the promise outward through measurement, architecture, dependencies, delivery process, staffing, recovery, communication, and cost, until the shape of the operating system behind the number is visible. The purpose is not to argue for more nines. Several sections argue explicitly for fewer. The purpose is to let a founder, a CEO, a CTO, or a VP of Engineering answer one question with evidence rather than optimism:
Does the engineering operation actually support the reliability the sales contract promises?
PART I — THE NUMBER
What 99.9% Actually Means
Percentages are poor at conveying operational reality, because human intuition treats 99% and 99.9% as approximately the same thing. Time is better. Converting availability targets into allowable downtime is the fastest way to make an abstract commitment concrete, and it is the first calculation any executive should run before approving an SLA.
The arithmetic is simple. Allowable downtime equals the measurement period multiplied by (100% minus the target). The complication is that "a month" is not a fixed quantity. Contracts written against calendar months are measured against periods ranging from 28 to 31 days, which changes the allowance by roughly ten percent between February and January. Annualized figures assume a 365-day year and ignore leap years. These are small distinctions until you are 40 minutes into a monthly budget of 43.
The table below uses a 365-day year (525,600 minutes) and a 30-day month (43,200 minutes) as the baseline, with the 31-day figure shown where the difference is material. All values are rounded for readability.
Table 1 — Availability Targets Translated Into Time
| Availability Target | Downtime per Year | Downtime per 30-Day Month | Downtime per 31-Day Month | Downtime per Week | Operational Interpretation |
|---|---|---|---|---|---|
| 99% | 87.6 hours (3.65 days) | 7.2 hours | 7.44 hours | 1.68 hours | A full working day of outage per quarter is within budget. Manual recovery is viable. |
| 99.5% | 43.8 hours | 3.6 hours | 3.72 hours | 50.4 minutes | A long maintenance event or one bad deployment per month fits. |
| 99.9% | 8.76 hours | 43.2 minutes | 44.6 minutes | 10.1 minutes | One moderate incident per month consumes most of the allowance. Detection speed starts to matter. |
| 99.95% | 4.38 hours | 21.6 minutes | 22.3 minutes | 5.04 minutes | Human-paced response is no longer reliably sufficient. |
| 99.99% | 52.6 minutes | 4.32 minutes | 4.46 minutes | ~1 minute | Recovery must be largely automatic. A single manual intervention likely breaches. |
| 99.999% | 5.26 minutes | ~26 seconds | ~27 seconds | ~6 seconds | Failure must be absorbed by architecture, not responded to by people. |
Two things become visible in this table that are invisible in the percentages.
The first is the collapse of the response window. At 99%, an organization can afford to notice an outage during business hours, convene the right people, diagnose the problem, deploy a fix, and still have budget left over. At 99.9%, the total monthly allowance is roughly 43 minutes — less time than a typical incident bridge takes to establish full situational awareness on an unfamiliar failure. At 99.99%, the allowance for an entire month is about four and a half minutes, which is shorter than the time it takes most humans to read an alert, open a laptop, authenticate to a production console, and orient. The commitment has crossed a threshold: it is no longer a promise about how fast people will react, it is a promise about how the system behaves without them.
The second is the non-linearity of what each additional nine removes. Moving from 99% to 99.9% eliminates about 78.8 hours of annual downtime allowance. Moving from 99.9% to 99.99% eliminates only about 7.9 hours more. In absolute terms the second step looks smaller. Operationally it is far larger, because the first step removes downtime an organization can still manage with people and process, while the second removes the possibility of managing it that way at all. Each nine does not add proportional cost; it removes a category of acceptable operational behavior.
This is where a common claim needs to be resisted. It is often asserted that each additional nine costs ten times more, or five times more, or some other tidy multiple. There is no universal multiplier, and treating one as real produces bad decisions in both directions. For a stateless read-mostly service already running behind a managed load balancer across multiple availability zones, moving from 99.9% to 99.95% may cost almost nothing, because the architecture already delivers it and the constraint was measurement rather than capability. For a system with a single primary database, a monolithic deployment process, and one engineer who understands the failover procedure, moving from 99.9% to 99.95% may require a year of work, because the binding constraint is a design decision made three years ago. The cost of a nine is a function of the distance between the current architecture and the architecture the target implies. That distance is specific to your system, and it can only be estimated by looking at your system.
The purpose of the table is not to rank the targets. It is to make sure that when a founder approves 99.9%, they are approving 43 minutes a month rather than approving a decimal point.
PART II — THE DEFINITION
Uptime of What, Exactly?
Availability clauses almost always contain the phrase "the Service." Almost as often, nobody has written down what that phrase covers.
This is the single most consequential ambiguity in most SaaS SLAs, and it is not a legal subtlety. It is an engineering specification problem wearing legal clothing. Two organizations can both promise 99.9%, measure honestly, report accurately, and deliver experiences that differ by an order of magnitude, purely because they defined "the Service" differently.
Consider the range of things the word could mean for a typical B2B product:
- The marketing site loads.
- The application's login page returns a response.
- A user can actually authenticate and reach an authorized session.
- The API accepts requests and returns valid responses within a defined latency.
- A customer's data is readable.
- A customer's data is writable and durably persisted.
- Checkout or payment submission completes end to end.
- Background jobs execute and finish within their expected window.
- Webhooks fire and are delivered.
- Inbound integrations from the customer's other systems succeed.
- Reports reflect data that is current rather than eight hours stale.
Each of these can fail independently. Several can fail while the others look perfectly healthy on an infrastructure dashboard.
Server Up Is Not Product Available
The most durable misconception in operational reliability is that a healthy server means a working product. Modern infrastructure makes this misconception easy to hold, because the signals that infrastructure emits are genuinely reassuring and genuinely incomplete.
A web server can return HTTP 200 for every request while the product is unusable. Some concrete ways this happens:
Authentication fails downstream. The application loads, the login form renders, the request reaches the server, and the identity provider or session store is unavailable. Every health check passes. No customer can get in.
The database is unreachable but the error page is fast. The application layer degrades to a friendly "something went wrong" screen, served with a 200 status by a framework that treats the error page as a successful render. Uptime monitoring reports perfect availability while zero business transactions complete.
Payments fail silently. The checkout flow renders, the form submits, and the payment processor rejects or times out. From the customer's perspective the product does not work. From the infrastructure's perspective nothing is wrong.
The critical API times out while the UI is fine. Enterprise customers who integrate programmatically experience total outage. Customers who use the web interface experience nothing. If the SLA was written around "the Service" and the monitoring watches the web tier, the outage is invisible to both measurement and reporting.
Transactional email or SMS is not being delivered. New users cannot verify accounts. Password resets do not arrive. Existing sessions continue to work perfectly, so nothing looks broken until support tickets accumulate.
Data is stale. Pipelines have stopped. Dashboards render instantly, populated with yesterday's numbers. Every component is up. The product is lying to its users, which is arguably worse than being down.
An AI-dependent feature is unavailable. A model provider is degraded or rate-limiting. If that capability is decorative, nothing important has happened. If the product's core workflow routes through it, the product is down while every piece of owned infrastructure reports green.
Two Kinds of Availability
It is worth naming the distinction explicitly, because most reliability disagreements between vendors and customers are really disagreements about which of these two things was being measured.
Table 2 — Infrastructure Availability vs. Customer-Experienced Availability
| Dimension | Infrastructure Availability | Customer-Experienced Availability |
|---|---|---|
| What it measures | Whether owned components are running and reachable | Whether a customer can complete the work the product exists to support |
| Typical signal | Host health, container liveness, HTTP status, CPU, network reachability | Successful logins, completed transactions, API success rate, job completion, workflow latency |
| Where it is generated | Inside the provider's environment | At or near the customer's point of use |
| Failure it detects well | Crashes, host loss, network partitions, capacity exhaustion | Broken workflows, third-party failure, data staleness, latency collapse, partial feature failure |
| Failure it misses | Anything the component does not know it is doing wrong | Rarely misses customer impact; may be noisier and harder to attribute |
| Who tends to prefer it | Operations teams, because it maps to what they can fix | Customers and executives, because it maps to consequence |
| Contractual risk | Reports availability the customer did not experience | Reports downtime the vendor may not consider its fault |
Neither column is the "correct" one. Infrastructure signals are indispensable for diagnosis; you cannot repair a system by watching business metrics alone. The point is that an SLA is a promise to a customer, and customers do not consume infrastructure. They consume outcomes. Over time, the measurement that backs an availability commitment should move toward the right-hand column, because the right-hand column is what the company is actually selling.
The practical instruction is unglamorous: before agreeing to an availability percentage, write one paragraph defining what "the Service" means in terms of specific, observable customer capabilities. Then check whether anything currently in production measures those capabilities. If the answer is no, the number in the contract is not yet a commitment the organization can evaluate, let alone honor.
PART III — THE MEASUREMENT
The Denominator Problem
Having defined what is being measured, the next question is over what period. Availability is a ratio, and ratios are dominated by their denominators.
The basic formula is straightforward:
Availability = (Eligible Service Time − Qualifying Downtime) ÷ Eligible Service Time
The arithmetic here is trivial. Every difficult question in SLA design lives inside the two capitalized terms, and neither of them is self-defining.
The Measurement Window Changes the Meaning of the Same Outage
A four-hour outage is one event. Its contractual consequences depend entirely on the window it is measured against.
Against a calendar month, four hours of downtime produces monthly availability of roughly 99.45% in a 30-day month. A 99.9% commitment is breached by a wide margin, and whatever remedy the contract specifies is triggered for that month.
Against a calendar year, the same four hours produces annual availability of about 99.954%. A 99.9% annual commitment is comfortably met. The customer experienced an identical outage and receives nothing.
Against a rolling 30-day window, the outage remains in the calculation for thirty days after it occurs, then leaves. Two three-hour outages that happen to land on the 30th and the 2nd of consecutive calendar months would be measured separately under calendar-month accounting and together under a rolling window.
Against a quarter, four hours produces about 99.82% — still a breach of a 99.9% quarterly commitment, but a smaller one, and one that a good month later in the quarter can partially absorb.
None of these framings is dishonest. They measure different things. Shorter windows are more sensitive to individual incidents and generally favor the customer; longer windows smooth volatility and generally favor the vendor. The version that ends up in a contract is a commercial negotiation, and it should be a conscious one rather than a default inherited from a template.
Major cloud providers illustrate the convention. Google's public SLAs define Monthly Uptime Percentage as total minutes in a month minus minutes of downtime, divided by total minutes in a month, calculated on a calendar-month basis. Google Workspace commits to a Monthly Uptime Percentage of at least 99.9% in any calendar month. Monthly calendar windows are the industry norm for infrastructure SLAs, which is a reasonable default for SaaS contracts to follow, but it is a default worth understanding rather than inheriting.
The Measurement Interval Is a Separate Decision
Beyond the window, there is the granularity at which the system is sampled. This is easy to overlook and it materially changes what counts.
AWS makes the distinction unusually visible in its Kubernetes service, where two different commitment tiers are measured differently: the standard control plane carries a Monthly Uptime Percentage commitment of at least 99.95%, measured in 5-minute intervals, while the provisioned control plane carries a 99.99% commitment measured in 1-minute intervals. The interval is part of the promise. A 90-second failure may be invisible under five-minute sampling and fully counted under one-minute sampling.
Some providers avoid time-interval accounting altogether and measure error rates instead. Google Cloud Storage defines its Monthly Uptime Percentage as 100% minus the average of Error Rates measured over each five minute period during the calendar month. This is a fundamentally different construct: it accounts for partial failure, where a service is returning errors for some fraction of requests rather than being wholly unreachable. For a SaaS product where degradation is more common than total outage, an error-rate-based definition often describes customer reality more faithfully than a binary up/down definition, at the cost of being harder to explain and harder to instrument.
Before the percentage is agreed, three things should be settled: the window, the interval, and whether availability is binary or proportional. Teams that skip this end up in a familiar position, arguing after an incident about whether an event that clearly harmed customers technically counted.
PART IV — THE EXCLUSIONS
What Counts as Downtime?
The second capitalized term in the availability formula is Qualifying Downtime, and it is where most of the negotiation and nearly all of the post-incident disagreement lives.
The questions below are not exotic. Each of them arises routinely, and each has a defensible answer in either direction. What matters is that the organization knows its own answer before it signs, not after.
Does scheduled maintenance count? Most vendor-drafted SLAs exclude maintenance performed within announced windows, sometimes with a cap on total excluded hours and a minimum notice period. Whether that exclusion is generous or reasonable depends on how much maintenance the architecture actually requires.
Does degraded performance count? If the product is responding but responding in 45 seconds, is it available? A binary uptime definition says yes. Every customer says no. This gap is the single most common source of the perception that a vendor's uptime reporting is dishonest.
Does a regional outage count? If one region is down and the SLA is measured globally or per-account, a customer entirely hosted in the affected region experiences 100% outage while the reported number stays healthy.
Does a single feature failing count? If reporting is broken and everything else works, most definitions say no. If authentication is broken and everything else works, most customers say the service is down. Somewhere between those two poles is a line, and the contract should say where.
Does a partial-population outage count? If 5% of tenants are affected, is the service 95% available or 100% available or 0% available? Per-account measurement, global measurement, and weighted measurement produce three different answers.
What about customer misconfiguration? Nearly all SLAs exclude issues caused by the customer's own environment, configuration, or usage outside documented limits. Reasonable in principle, and a frequent source of dispute in practice, because attribution during a live incident is rarely clean.
What about third-party failure? Cloud provider outages, DNS failures, payment processor degradation, and model API unavailability are usually excluded by vendor-drafted language and usually resisted by sophisticated buyers. The customer's position is straightforward: they contracted with you, not with your vendors.
What if only the API is down? For a product sold on its integrations, this is a total outage for a meaningful segment of customers and a non-event for the rest.
This article does not offer legal advice, and the specific wording of exclusions, remedies, notice requirements, and caps should be reviewed with qualified counsel who understands the jurisdiction and the commercial context. What can be said from the engineering side is narrower and just as important:
An organization cannot design toward an SLA it cannot define. Every one of the questions above translates directly into a monitoring requirement, an alerting threshold, an architectural decision, and a reporting obligation. If maintenance is excluded, someone must record maintenance windows in a form that survives an audit. If degraded performance counts, someone must define the latency threshold at which degradation becomes downtime, and something must measure it continuously. If regional outages count per-account, availability must be computed per tenant rather than globally, which is a data pipeline nobody builds by accident.
Ambiguity in an SLA does not reduce obligation. It defers the argument to the moment when both parties are least able to have it constructively.
PART V — THE INDICATORS
Availability Is Not a Single Metric
A binary up/down measurement is a crude instrument for describing a system that fails in gradations. Mature reliability practice therefore treats availability as one member of a small family of indicators, each capturing a different way the service can stop being useful.
Consider two failures. In the first, a payment service is completely unreachable for six minutes. In the second, the payment service is reachable for the entire month but rejects or times out on 4% of transactions. Naive uptime monitoring reports the first as downtime and the second as perfect availability. The second failure is worse for the business by a wide margin, and it is the one that will not appear in any report.
Indicators worth considering alongside raw availability include latency (both median and tail, because averages conceal the experience of the unluckiest users), error rate on requests that should have succeeded, successful completion rate for business transactions rather than HTTP requests, queue depth and processing delay for asynchronous work, job completion within an expected window, and data freshness for anything the customer treats as current.
Google's SRE materials make the point directly: an API that is technically responding but responding badly is not delivering the service. The recommendation to use high percentiles rather than averages exists because averages can hide long tails or large instantaneous loads, and because user studies have shown that people typically prefer a slightly slower system to one with high variance in response time.
SLI, SLO, SLA
Three acronyms circulate in this space and are frequently conflated, including by people who use them daily. The distinctions are useful, and they are worth stating in language a non-engineer can act on.
A service level indicator (SLI) is a measurement. It is a number the system produces continuously that describes some aspect of service quality: the percentage of API requests returning success, the 95th-percentile checkout latency, the proportion of scheduled jobs completing on time. An SLI is a fact about what happened.
A service level objective (SLO) is an internal target for an SLI over a period. It is what the engineering organization is aiming to achieve, chosen by the organization for its own purposes, adjustable as circumstances change, and enforced by nothing but internal discipline. An SLO is a decision about what should happen.
A service level agreement (SLA) is an external commitment, made to a customer, usually with a defined remedy attached if the commitment is missed. An SLA is a promise about what will happen, backed by consequence.
Google's SRE book notes that the term SLA is overloaded in common use, which is worth remembering when reading vendor documentation. Google's own Cloud Platform SLAs, somewhat confusingly for anyone reading the SRE book alongside them, label the committed availability figure as the "Service Level Objective" within a document titled Service Level Agreement — the Covered Service will provide a Monthly Uptime Percentage to Customer of at least 99.95% (the "Service Level Objective" or "SLO"). Different organizations use these words differently. Precision matters less than internal consistency and shared understanding across sales, legal, and engineering.
Table 3 — The Three Layers
| SLI | SLO | SLA | |
|---|---|---|---|
| Question it answers | What is happening? | What are we aiming for? | What did we promise? |
| Audience | Engineering | Engineering and product leadership | Customer, legal, finance |
| Example | 99.94% of authentication requests succeeded over the last 30 days | Authentication success rate ≥ 99.95% over any rolling 30 days | Service Availability of 99.9% per calendar month |
| Consequence of missing | None; it is a measurement | Internal: pause risky changes, reprioritize reliability work | External: service credits, escalation, renewal risk |
| Who can change it | Whoever instruments the system | Engineering and product, by internal decision | Neither party unilaterally; requires contract amendment |
| Changes how often | Continuously | Quarterly or as the system evolves | Annually at renewal, if at all |
The relationship among the three is the practical payload. The SLI is the instrument. The SLO is where the organization steers. The SLA is the wall. Steering directly at the wall is a poor plan, which brings us to the next layer.
PART VI — THE MARGIN
Do Not Operate at the Number You Promised
If the contractual commitment is 99.9% and the engineering organization's internal target is also 99.9%, then the organization has arranged for every ordinary operational fluctuation to be a contract event. There is no room between normal variance and breach.
The concept worth naming here is reliability margin: the distance between the level at which the system normally operates and the level at which the contract fails. Margin is what absorbs the difference between a system's average behavior and its behavior on a bad month.
Consider what a 99.9% monthly commitment implies in practice. The allowance is 43.2 minutes in a 30-day month. A single incident involving twelve minutes of detection, eight minutes of diagnosis, and fifteen minutes of remediation and verification consumes 35 of those 43 minutes. One such event, which most engineering teams would describe as a reasonably well-handled incident, leaves eight minutes of budget for everything else that month: a failed deployment, a dependency hiccup, a certificate expiry, a capacity event during a traffic spike. Operating without margin means that a single unremarkable incident puts the month at risk.
This is why the common practice is to set the internal SLO tighter than the external SLA. It is also why prescribing a universal ratio is unhelpful. The right margin depends on:
Architecture. A system with automatic failover between redundant paths has a different failure distribution than one where recovery requires a human decision. Wider variance requires wider margin.
Traffic patterns. A product whose usage is concentrated into predictable business hours has a different exposure profile than one serving continuous global load. Concentrated traffic means that when downtime lands matters as much as how much of it occurs.
Incident history. An organization with twelve months of measured data can set margin empirically. One with three months of partial data is guessing, and should guess conservatively.
Measurement confidence. If the monitoring that produces the availability number has known gaps, the effective margin is smaller than it appears, because some downtime is not being counted and eventually will be.
Business criticality. A margin that is adequate for a product where breach means a modest credit is inadequate for one where breach means an executive escalation and a renewal review.
Margin is not pessimism. It is the operational equivalent of a cash runway. An organization that runs its bank balance at exactly zero on the last day of each month is technically solvent and practically fragile. The same logic applies to reliability, and the mechanism that formalizes it has a name.
PART VII — THE BUDGET
Every SLA Contains a Permission
A 99.9% commitment states that the service will be available 99.9% of the time. It also states something less obvious and more useful: the service is permitted to be unavailable 0.1% of the time. That permission has a name and a purpose.
The error budget concept, developed in Google's site reliability engineering practice, treats the gap between the target and 100% as a quantity that can be spent. Google's SRE book describes it as a metric that provides a clear, objective metric that determines how unreliable the service is allowed to be within a single quarter, and notes that this framing removes the politics from negotiations between the SREs and the product developers when deciding how much risk to allow.
The reason this matters to a founder rather than only to an SRE is that the alternative to an explicit budget is an implicit one, and implicit budgets get spent badly.
Consider what the 0.1% is actually for. Deployments carry risk; some fraction of them will cause brief impact regardless of process quality. Infrastructure upgrades, database migrations, and dependency updates carry risk. Experiments carry risk. Capacity changes carry risk. All of these activities are how a product improves. An organization that treats every minute of downtime as an unacceptable failure has, without deciding to, chosen to slow down change. That may be the correct choice for a system where failure has severe consequences. It is a costly choice for a startup whose primary risk is building the wrong product rather than building an unreliable one.
Google's own guidance is unambiguous on the ceiling: It's both unrealistic and undesirable to insist that SLOs will be met 100% of the time: doing so can reduce the rate of innovation and deployment, require expensive, overly conservative solutions, or both.
The founder-level translation is compact. Reliability and velocity are drawn from the same budget. Promising more reliability externally means spending less of that budget on change, which shows up as slower shipping, more conservative engineering, more time in staging, and more caution around the kinds of experiments that early-stage products need. This trade is often worth making. It should be made knowingly, at the point when someone approves the SLA, rather than discovered eighteen months later when the team wonders why every release takes three weeks.
There is a second implication that is easy to miss. If the error budget is a resource, then consuming it early has consequences. An organization that spends 90% of its monthly budget in the first week has, in effect, forfeited its ability to take risk for the remaining three weeks. Teams that manage budgets explicitly use this as a decision rule: when the budget is largely intact, ship aggressively; when it is nearly exhausted, pause risky changes and spend the remainder of the period on stability. The rule requires no bureaucracy. It requires only that someone knows the number.
PART VIII — THE DEPENDENCIES
Your SLA Includes Everyone You Depend On
The contract names one party. The system does not.
A representative B2B SaaS product in production today sits on top of a cloud provider, one or more managed databases, a CDN, a DNS provider, an identity or SSO service, a payment processor, a transactional email service, an SMS gateway, an object store, a search service, a queue, a monitoring and alerting vendor, several third-party APIs specific to the domain, and increasingly one or more AI model providers. Each of these is a separate company with separate incidents, separate status pages, separate support processes, and separate contractual commitments to you.
The customer sees one product.
This asymmetry is the source of a great deal of misplaced confidence. A founder reads that their cloud provider commits to 99.99% and reasonably concludes that the infrastructure is not the constraint. That conclusion is correct and insufficient. The cloud provider's commitment covers the cloud provider's service, measured the cloud provider's way, with the cloud provider's exclusions, remedied by a credit against the cloud provider's bill. None of that transfers to the promise you made your customer.
The details of how these upstream commitments actually work are instructive, because they are the model most SaaS SLAs are unconsciously imitating.
AWS commits, for EC2 instances deployed concurrently across two or more Availability Zones in the same region, to a Monthly Uptime Percentage of at least 99.99%. That figure is widely quoted. Less widely quoted is the adjacent commitment for a single instance: an Instance-Level Uptime Percentage of at least 99.5%. The architecture determines which number applies. A company running production on instances in one availability zone is operating against a 99.5% commitment while believing it has 99.99%, a gap of roughly 43 hours per year in contractual terms and considerably more in practical exposure.
The language matters too. AWS commits to use commercially reasonable efforts to meet these figures. This is not a guarantee of outcome, and no major provider offers one.
The remedy structure is equally instructive. AWS service credits for the region-level EC2 SLA are 10% when Monthly Uptime Percentage falls below 99.99% but stays at or above 99.0%, 30% below 99.0% down to 95.0%, and 100% below 95.0%. Google Cloud caps total credits, in Cloud Run's case, at 50% of the amount due for the covered service in the affected region for the applicable month, and states that this SLA states Customer's sole and exclusive remedy for any failure by Google to meet the SLO. Credits also require action from the customer: Google requires notification to technical support within thirty days from the time Customer becomes eligible to receive a Financial Credit, and failure to comply with this requirement will forfeit Customer's right to receive a Financial Credit.
Read that structure carefully, because it reveals what these instruments are designed to do. If a cloud region suffers a four-hour outage, and your application is entirely unavailable for those four hours, and your customer's business is disrupted, your maximum recovery from the provider is a percentage of one month's bill for the affected service, which you must remember to claim. Your own exposure to your customer is whatever your contract says, plus everything the contract does not cover.
The gap between what you can recover upstream and what you owe downstream is not a defect in the cloud provider's terms. It is the normal structure of the market. It is also a risk that lands on your balance sheet, and it should be understood before it is inherited.
Table 4 — Vendor SLA vs. Your SLA
| Your Vendor's SLA to You | Your SLA to Your Customer | |
|---|---|---|
| Scope | One service, measured in isolation | Your whole product, as experienced |
| Measurement | The vendor's definition and instrumentation | Yours, if you built it |
| Exclusions | Broad by default; narrowed only by negotiation | Whatever you agreed to |
| Remedy | Credit against that vendor's bill, usually capped, usually claimed | Whatever your contract specifies, plus relationship consequences |
| Who explains the outage | A status page you do not control | You, in real time, to a named person |
| Composability | Does not aggregate upward | Is the aggregate |
PART IX — THE COMPOSITION
Why You Cannot Add SLAs Like Percentages
Here is the arithmetic that surprises people.
Suppose a critical customer workflow — logging in, retrieving a record, and saving a change — requires four components to work: an identity service at 99.9%, an application tier at 99.9%, a database at 99.9%, and an API gateway at 99.9%. Every component is individually excellent by conventional standards.
If those components are independent and all four are strictly required for the workflow to succeed, the approximate combined availability is the product of the individual availabilities. Three components at 99.9% yield roughly 99.70%, or about 26.25 hours of annual downtime rather than 8.76. Five components at 99.9% yield roughly 99.50%, about 43.7 hours per year. Ten components at 99.9% yield roughly 99.00%, about 87 hours per year, which is the same annual exposure as a single component running at 99%.
The intuition is that reliability averages. The reality is that, along a strict dependency chain, reliability multiplies, and multiplying numbers slightly below one drives the result downward.
A more realistic mix makes the point sharper. Suppose the critical path traverses a load balancer at 99.99%, an application tier at 99.9%, a managed database at 99.95%, an identity provider at 99.9%, and a payment processor at 99.5%. The combined figure is approximately 99.24%, which is about 66 hours of annual downtime and roughly 328 minutes per month. A team promising 99.9% on that critical path is promising something the composition does not currently support, and the binding constraint is the weakest link rather than the average.
Two caveats keep this from being misleading. First, real distributed systems rarely exhibit strict statistical independence; correlated failures are common, since components often share an underlying region, network, or provider, and correlation can make outcomes worse than the naive product suggests. Second, most workflows do not require every component simultaneously for every request, and retries, caches, and queues absorb a great deal of transient failure. The multiplication model is a reasoning tool for identifying which dependencies dominate a critical path, not a predictive formula.
Architecture Changes the Equation
The reason the multiplication result is not a life sentence is that architecture determines whether components sit in series or in parallel.
Two independent instances of a 99% component, arranged so that either can serve the request, produce a combined availability of about 99.99%, because both must fail simultaneously for the path to fail. Two independent 99.9% components in parallel produce about 99.9999%. Redundancy converts multiplication into a far more favorable calculation, which is why it is the first lever every architect reaches for.
The other levers are less obvious and often cheaper:
Fallbacks. If the primary provider for a capability fails and a secondary can serve the request, the capability moves from series to parallel. This is common for email delivery, SMS, and increasingly for AI model providers, where multiple vendors offer substitutable interfaces.
Caching. A cached response served during a backend outage removes the backend from the critical path for read operations. The trade is data freshness, which is a real cost and should be an explicit decision rather than an accident.
Queueing. Work that can be accepted now and processed later converts a hard dependency into a soft one. The customer's write succeeds; the downstream processing catches up. This changes the failure from "the service is down" to "results are delayed," which is a materially different SLA event.
Removing the dependency from the path. The most effective intervention is often to establish that a component was never actually required for the critical workflow and to stop calling it synchronously.
The founder-level conclusion is that a vendor's reliability does not transfer to your product. It contributes to your product, in a way determined by how you assembled the pieces. Buying more reliable components helps. Assembling them so that fewer of them can independently break the critical path helps more.
PART X — THE FAILURE MODEL
Degrade, Don't Disappear
Most reliability conversations assume a binary: the system works or it does not. Most well-built systems occupy a much larger middle territory, and the size of that territory is an architectural choice made long before any incident.
A product can be partially available in ways customers barely notice. Recommendations can fail while checkout continues. An AI-powered summarization feature can be disabled while the underlying document workflow remains fully usable. Analytics can lag by an hour while transactional operations proceed normally. Search can fall back from semantic ranking to simple keyword matching. Transactional email can queue rather than fail, so account creation still completes and the verification message arrives four minutes late. Export generation can be deferred while the data it draws from remains readable in the interface.
In each case, something is broken and the customer can still do the thing they came to do.
The design property that enables this is separation: the deliberate architectural distinction between capabilities that must work for the product to be usable and capabilities that enhance it. Systems built without that distinction tend to fail totally, because every component is a hard dependency of every request. Systems built with it fail partially, and partial failure is dramatically cheaper in both SLA terms and customer trust.
The decisions this requires are product decisions before they are technical ones. Someone has to determine that recommendations are optional and authentication is not. Someone has to accept that during a degradation the product will look slightly diminished rather than presenting an error. Someone has to decide whether serving eight-hour-old cached data is better or worse than serving nothing, which depends entirely on what the data is used for. A stale price is dangerous. A stale activity feed is fine.
This has a direct bearing on how an SLA should be written. A contract that defines availability as "all features functioning" makes graceful degradation contractually worthless, since any partial failure counts as full downtime. A contract that defines availability around specified critical capabilities rewards the architecture that keeps those capabilities alive. The definition and the design should be chosen together, and they rarely are, because they are usually chosen by different people at different times.
PART XI — THE CRITICAL PATH
Feature Count Is Not the Unit of Reliability
A mature SaaS product may expose several hundred distinct capabilities. Treating all of them as equally load-bearing is both operationally impossible and commercially unnecessary.
The useful exercise is to identify the small set of critical customer journeys — the sequences of actions that constitute the reason the customer bought the product. For most B2B software this list is short, often between three and seven items, and it usually includes some version of: authenticate and reach an authorized session; create or modify the core business object; retrieve essential records; complete a transaction or submit work to a downstream system; and receive whatever output the product exists to produce.
Everything else is supporting capability. Admin settings, reporting, bulk export, integrations with secondary tools, in-app documentation, notification preferences, and the large tail of features that exist because a customer once asked for them all matter, and none of them is what a customer means when they say the service is down.
Table 5 — Critical Journey Mapping
| Critical Journey | What "Down" Means to the Customer | Dependencies on the Path | Observable Success Signal | Acceptable Degradation |
|---|---|---|---|---|
| Authenticate | Nobody can use the product at all | Identity provider, session store, DNS, edge | Successful session creation rate | None; this is binary |
| Create or save core record | Work is lost or blocked | App tier, primary database, validation services | Write success rate and confirmed persistence | Brief queueing with confirmation |
| Retrieve essential records | Customer cannot answer their own questions | Read replicas, cache, search index | Read success rate and p95 latency | Stale-but-labeled cached data |
| Complete transaction | Revenue stops for the customer | Payment provider, ledger, notification | End-to-end completion rate | Retry with clear status, not silent failure |
| Deliver output to downstream system | Customer's own process breaks | Queue, webhook delivery, partner API | Delivery confirmation rate within window | Delayed delivery with visible backlog |
The question this framing produces is more useful than the one most dashboards answer. Instead of are all systems healthy, it asks: which specific failure would cause a customer to say the service is down? That list is short, it is knowable, and it should drive monitoring priority, architectural investment, testing coverage, and the definition of "the Service" in the contract. When those four things are aligned around the same short list, an organization has a coherent reliability posture. When they are aligned around nothing in particular, it has a dashboard.
PART XII — THE MAINTENANCE QUESTION
Excluded From the Calculation Is Not Free
Most SLAs exclude planned maintenance from the availability calculation, provided it falls within an announced window and meets notice requirements. This is standard, reasonable, and frequently misunderstood on the vendor side as meaning that maintenance downtime is costless.
It is not costless. It is merely uncounted.
A customer whose team cannot work during a two-hour maintenance window has lost two hours regardless of what the contract says. If that customer operates across multiple time zones, the vendor's off-peak window is someone's Tuesday afternoon. If the customer's own commitments depend on the vendor's availability, the maintenance window propagates downstream into their obligations. The contractual exclusion protects the vendor's availability percentage. It does not protect the relationship, and repeated maintenance disruption is a recurring negative signal in exactly the account reviews where renewal decisions get made.
There is also an operational cost that vendors consistently underestimate: every maintenance window requires notification, coordination, a communication plan, a rollback plan, staffing during off-hours, and verification afterward. A monthly two-hour window is not two hours of cost. It is a recurring organizational event.
Three categories are worth distinguishing:
Planned maintenance is scheduled in advance, communicated according to whatever notice period the contract requires, and typically excluded from the availability calculation. It is predictable and manageable, and it is the category that shrinks as engineering practice matures.
Emergency maintenance is unplanned work that must happen immediately, usually for security reasons. Contracts often treat it differently from planned maintenance, sometimes with a shortened notice requirement. Whether it counts against availability varies, and it is worth knowing the answer before an urgent security patch forces the question.
Deployment-related interruption is the grey zone. A release that causes 90 seconds of unavailability is not maintenance in the contractual sense; it is downtime. Organizations that mentally file routine deployments under "maintenance" are systematically undercounting their own downtime.
The direction of travel in cloud-native engineering is toward changes that require no visible interruption at all. Rolling deployments, backward-compatible schema migrations, blue-green infrastructure, and connection draining make it possible to ship continuously without a maintenance window. These capabilities are genuinely valuable and genuinely expensive to build, and a five-person team serving forty customers who all work in one time zone does not need them. A monthly window at a genuinely quiet hour, announced clearly, is a perfectly defensible operating model for an early product. What is not defensible is committing contractually to a maintenance regime the team cannot sustain, or discovering at renewal that the customer's expectations were formed by vendors who never take the system down.
PART XIII — THE DELIVERY MODEL
Deployment Is Part of Availability
Systems do not usually break spontaneously. They break when something changes.
New releases, configuration updates, database migrations, dependency upgrades, infrastructure modifications, and feature flag changes are the proximate cause of a substantial share of production incidents in most organizations. This makes the delivery process a reliability system, whether or not anyone has thought of it that way, and it means an availability commitment cannot be evaluated without examining how code reaches production.
The relevant capabilities are well known, and the point here is not to explain them but to connect them to the contract:
Automated pipelines remove the class of incident caused by a step someone forgot. Manual deployment procedures fail at a rate proportional to how tired the person executing them is.
Automated verification before release catches regressions in critical paths before customers do. The coverage that matters most is the coverage over the short list of critical journeys from Part XI, not aggregate line coverage.
Staged rollout and canary releases limit the population exposed to a bad change. If a defect reaches 2% of traffic and is caught in four minutes, the availability impact is a rounding error. If it reaches 100% of traffic and is caught in forty minutes, the month is gone.
Feature flags decouple deployment from release, which means a problematic capability can be disabled in seconds without a rollback, a rebuild, or a redeployment.
Fast, tested rollback is the single highest-leverage capability in this list. A rollback that takes ninety seconds and has been exercised recently converts most bad deployments into non-events. A rollback that takes twenty-five minutes and has never been tested outside a runbook is a theory.
Post-deployment verification answers whether the critical journeys still work after the change, using the same signals that back the SLA. Verification that ends at "the deploy succeeded" verifies the wrong thing.
The founder-level translation is direct. If the company has committed to 43 minutes of monthly downtime and deploys through a process where a bad release takes half an hour to identify and reverse, the contract and the operating model are describing different companies. The gap will not close through effort. It closes through investment in the delivery pipeline, and that investment should be scoped and funded at the same time the SLA is approved rather than requested afterward as a remediation.
PART XIV — THE CHANGE RISK
Reliability Depends on How Safely You Can Change
The industry's most extensive body of research on this question comes from DORA, whose annual State of DevOps research has surveyed software delivery practice for over a decade. DORA's framework pairs throughput measures with stability measures precisely because the two are entangled: deployment frequency and lead time for changes measure throughput, while change failure rate and failed deployment recovery time measure stability. The metric formerly known as time-to-restore was renamed to failed deployment recovery time in the 2023 State of DevOps Report.
DORA's 2025 research, published as the State of AI-assisted Software Development, is directly relevant to any organization considering a reliability commitment in the current environment. Based on survey responses from nearly 5,000 technology professionals worldwide and over 100 hours of qualitative data, the report found that 90% of respondents use AI in their daily work, a 14% increase from 2024. Its central finding on stability is one that reliability-conscious leaders should sit with: AI adoption now clearly and positively correlates with software delivery throughput, but the report also finds that AI adoption continues to correlate with higher instability, leading to more change failures, increased rework, and longer cycle times to resolve issues. The 2025 framework added a rework rate metric and treats reliability as a separate category, assessed through SLOs and SLIs that reflect end-user experience.
The counterintuitive result from DORA's longer research history is worth restating, because it prevents a bad conclusion. Speed and stability are not opposed. High-performing organizations achieve both, and the mechanism is investment in the practices that make change safe rather than restriction of how often change occurs. An organization that responds to reliability pressure by slowing down deployments usually gets larger, riskier deployments and worse outcomes.
For a company weighing an availability commitment, the practical implication is that change failure rate and recovery speed are as much a part of the reliability picture as architecture. If a meaningful share of deployments cause customer-visible problems, and each such problem takes tens of minutes to reverse, then the SLA is not primarily an architecture question. It is a delivery-process question, and it will be answered by engineering practice rather than by infrastructure spend.
PART XV — THE DETECTION PROBLEM
How Long Can You Be Down Before You Know?
Customer impact begins the moment the service fails. Recovery cannot begin until someone knows the service has failed and understands enough to act.
The interval between those two moments is pure loss. It produces no diagnosis, no mitigation, and no communication. It consumes error budget at exactly the same rate as the repair does, and it is invisible in most engineering conversations because nobody experiences it as work.
Put concrete numbers against a 99.9% monthly commitment, where the total allowance is 43.2 minutes in a 30-day month.
An outage begins. Nobody is alerted, because the failure is in a code path that infrastructure monitoring does not cover. Twenty minutes later a customer emails support. Support takes four minutes to recognize it as systemic and escalates. An engineer acknowledges, spends six minutes establishing what is broken, and applies a fix that takes eight minutes to deploy and verify.
Total customer impact: 38 minutes. Total repair work: 14 minutes. Detection and escalation consumed 24 minutes, or 56% of the entire month's budget, and the engineering organization will remember this incident as one that took a quarter of an hour to fix.
Run the same scenario against a 99.99% commitment, where the monthly allowance is about 4.3 minutes. The detection interval alone breached the SLA roughly five times over. This is the practical meaning of the earlier claim that higher targets remove categories of operational behavior: at four nines, human-initiated detection is not a viable model, and the question becomes whether the system detects and mitigates its own failures.
The instrumentation that closes this gap is not exotic. Synthetic checks that execute the actual critical journeys, rather than pinging a health endpoint, catch the class of failure where every component is healthy and the workflow is broken. Alerting thresholds tied to business outcomes catch failures that infrastructure metrics cannot express. Checks that run from outside the production network catch DNS, CDN, and edge failures that are invisible from inside. Alert routing that reaches a human who is awake and empowered catches the failures that arrive at inconvenient hours.
The relevant question for an executive reviewing an availability commitment is not whether the company has monitoring. It is: what is our measured time from failure onset to human awareness, for the failure modes that matter, and what fraction of the contractual budget does that interval represent? If nobody can answer with data from real incidents, the commitment is being made on faith.
PART XVI — THE SIGNALS
Monitor What Customers Need, Not Only What Servers Do
Infrastructure monitoring answers questions about components. Customers do not have questions about components.
The gap between these two vocabularies is where outages hide. A dashboard showing CPU, memory, disk, request rate, and error count can be entirely green while no customer has successfully completed a purchase in twenty minutes, because the failure lives in a third-party call whose errors are being caught, logged at debug level, and returned to the user as a polite message.
The corrective is to instrument the outcomes rather than only the machinery. A useful set for most SaaS products:
Successful authentication rate. The most important single business signal in nearly every product, and one of the least commonly alerted on.
Business transaction completion rate. Not requests served; transactions finished. Orders placed, documents submitted, records saved and confirmed.
API success rate segmented by customer. Aggregate success rates conceal single-tenant outages, which are precisely the outages that generate contractual disputes.
Message and notification delivery confirmation. Sent is not delivered. Products that treat handoff to a provider as success discover the difference through support tickets.
Background job completion within expected windows. A pipeline that has silently stopped produces no errors at all, which makes it invisible to error-based alerting.
Critical workflow latency at high percentiles. The p50 describes a customer who does not exist. The p95 and p99 describe the ones who complain.
Data freshness. For any surface presenting data as current, the age of that data is a reliability signal, and its degradation is a failure that no component-level check will report.
Taken together these constitute what might be called business service health — a view of the system organized around what customers are trying to accomplish rather than around what the infrastructure is doing. The phrase is used here descriptively rather than as a standardized industry term. What matters is the reorientation it names: when the availability report goes to a customer at the end of the month, it should be generated from signals that describe the customer's experience, because that is what the customer will compare it against.
PART XVII — THE RECOVERY MODEL
Speed of Repair Changes the Arithmetic
No system prevents all failure. Any strategy that depends on preventing all failure is a strategy that fails on its first surprise.
This makes recovery capability a first-class component of reliability rather than a consolation prize. The arithmetic is straightforward and frequently ignored: availability is a function of both how often the system fails and how long each failure lasts. A system that experiences six incidents a year and recovers in four minutes accumulates 24 minutes of annual downtime, comfortably inside a 99.9% annual commitment. A system that experiences one incident a year and recovers in nine hours accumulates 540 minutes and breaches the same commitment substantially.
Fragility and slow recovery are the dangerous combination. Fragility with fast recovery is often perfectly acceptable, and it is frequently the right operating point for a young company, because building fast recovery is cheaper than building failure prevention.
The capabilities that determine recovery speed are worth naming plainly:
Rollback. The ability to return to the last known-good state quickly and confidently. Its value is proportional to how recently it was exercised.
Failover. The ability to shift traffic to an alternative path, region, replica, or provider. Manual failover is better than none, automatic failover is faster, and untested failover of either kind is a hypothesis rather than a capability.
Restore. The ability to recover data to a usable state, discussed in the next section, because it is distinct enough to deserve one.
Ownership. The ability to reach a specific person who can act, without a search. Ambiguity about who is responsible is one of the most reliable ways to convert a ten-minute incident into an hour-long one.
Access. The ability of the responder to actually change the thing that is broken. An engineer who must wait for someone else to grant production access has a recovery time bounded by that person's response time.
Diagnosis speed. Logs, traces, and dashboards that permit a responder to determine what changed and where, rather than guessing. Most incident time is spent identifying the problem, not fixing it.
Aggregate measures of recovery time are useful for tracking direction and misleading as a target. Recovery time distributions are heavily skewed, so an average is dominated by the tail and conceals both the many trivial recoveries and the occasional catastrophic one. Track the distribution and pay particular attention to the worst events, since those are the ones that determine whether the SLA holds.
Table 6 — The Incident Lifecycle and Where the Budget Goes
| Phase | What Determines Its Duration | Typical Improvement Lever | Effect on Contractual Availability |
|---|---|---|---|
| Failure onset | Architecture, dependencies, change safety | Redundancy, degradation design, release practice | Reduces frequency of budget consumption |
| Detection | Monitoring coverage of critical journeys | Synthetic checks, outcome-based alerting | Often the largest recoverable segment |
| Notification and ownership | Alert routing, on-call structure, escalation clarity | Defined rotation, unambiguous ownership | Minutes, and highly variable by hour of day |
| Diagnosis | Observability quality, system comprehensibility | Tracing, correlated logs, change visibility | Usually the longest phase in unfamiliar failures |
| Mitigation | Rollback, failover, flag toggles, capacity levers | Pre-built and rehearsed actions | Where most engineering attention already goes |
| Verification | Ability to confirm customer impact has ended | Business-outcome signals rather than component health | Prevents premature all-clear and repeat incident |
| Communication | Status process, account ownership | Prepared channels and templates | No effect on the metric; large effect on the relationship |
PART XVIII — THE DATA MODEL
Backups Do Not Matter Until Restore Matters
A backup is a file. Recovery is a capability. Organizations routinely possess the first and assume they possess the second.
The questions that separate them are uncomfortable and quick to ask:
Has a restore been performed recently, into an environment resembling production, by someone other than the person who built the backup system? An untested backup has an unknown probability of working, and the distribution of that probability is not encouraging. Silent backup failures, incomplete schemas, missing encryption keys, and restores that succeed technically but produce a database the application cannot use are all common.
How long does a full restore take? For a small database this may be minutes. For a large one it can be many hours, and the number is rarely known before it is needed. A company whose availability commitment implies recovery within an hour, and whose restore takes eleven, has a commitment its data layer cannot support in the scenarios where restore is the only option.
How much data can be lost? The gap between the last recoverable state and the moment of failure is data the customer created and the company no longer has. For some products this is an inconvenience. For others it is a customer-terminating event.
How old can the recovered data be before it stops being useful? A restore that returns the system to a state from six hours ago has technically succeeded and may have practically failed, depending entirely on what the product does.
Two terms make these questions tractable in an executive conversation.
Recovery Time Objective (RTO) is the target for how quickly service is restored after a disruptive event. It answers: how long can we be down?
Recovery Point Objective (RPO) is the target for how much data loss is acceptable, expressed as a time window. It answers: how far back can we be thrown?
These interact with availability commitments without being identical to them, and the distinction matters. An availability SLA is satisfied when the service is reachable and functional again. A customer whose last four hours of work vanished during that recovery will not experience the restoration of service as a resolution. The service is up; their data is not. The contract may be met while the relationship is not, which is a pattern that recurs throughout this subject.
For most companies the practical starting point is modest: know your actual RTO and RPO, measured rather than assumed, by performing a real restore and timing it. That exercise frequently reveals that the informal expectation and the demonstrated capability differ by an order of magnitude, and it is far better to discover that during a scheduled Tuesday than during an incident.
PART XIX — THE RESPONSE MODEL
Incident Response Is an Operating Model, Not a Reflex
An availability commitment implies that when the service fails, something organized happens. In many companies what actually happens is that several people notice at different times, converge in a chat channel, and improvise. Improvisation works, up to a point, and that point arrives sooner than expected.
The structural questions that determine incident duration are almost entirely organizational rather than technical:
Who owns the incident? Not who fixes it, but who is accountable for the overall response, coordinates parallel work, and decides when it is over. The incident commander concept exists because someone has to hold the whole picture while others hold pieces of it, and because that job is nearly impossible to do while also debugging.
Who can make decisions? Rolling back a release, failing over to a secondary region, disabling a revenue-generating feature, or declaring a data loss event are decisions with consequences. If the responder cannot make them, the response is bounded by the availability of whoever can.
Who communicates? With customers, with the account teams who will be asked, with leadership. If this falls to the person doing the diagnosis, both jobs get done badly.
Who has access? Production credentials, vendor support portals, DNS control, cloud console permissions, database access. Access that requires a request during an incident is access the organization does not have.
How is severity classified? A shared vocabulary for how bad this is determines who gets woken, what gets communicated, and how much disruption is justified. Without it, every incident is negotiated from scratch.
When do vendors get contacted? Support tiers, escalation paths, and account contacts for critical dependencies should be known in advance. Discovering that your database vendor's emergency escalation requires a support plan you do not have is an expensive discovery.
Supporting practices — runbooks for known failure modes, a dedicated incident channel convention, defined escalation timelines, and blameless post-incident review — are valuable and should be scaled to the organization. A twelve-person company does not need a formal incident management function. It does need the answers to the questions above written down somewhere that is not one person's memory, because the primary failure mode at that size is that the one person who knows everything is unreachable.
Post-incident review deserves particular emphasis, because it is the mechanism by which incidents become improvements rather than merely history. The value is not in the document. It is in the specific, owned, scheduled changes that come out of it, and in the honest identification of contributing factors that a blame-oriented review would suppress.
PART XX — THE STAFFING MODEL
Who Answers When the Company Is Asleep?
A 24/7 availability commitment is a statement about hours the company may not currently staff. This is the point where contract language becomes payroll and organizational design, and it is the transition that surprises founders most often.
The question is direct: if the service is committed to 24/7 availability, does the organization have 24/7 response capability? Not aspiration. Capability. A named person, reachable, awake or wakeable, with access and authority, on every hour of every day including holidays and the weeks when people take vacation.
Several models exist, and none is universally correct.
Founder or lead-engineer coverage is where nearly every company starts. One or two people carry the phone permanently. It is free, it is fast, and it does not survive growth. It also concentrates institutional knowledge and personal risk in the people least able to be replaced.
Formal on-call rotation distributes the load across a team with defined primary and secondary responders and documented escalation. This is the standard approach, and its viability depends heavily on team size. Google's SRE materials work through the arithmetic explicitly: using the 25% on-call rule, assuming that there are always two people on-call (primary and secondary, with different duties), the minimum number of engineers needed for on-call duty from a single-site team is eight. Most startups do not have eight engineers available for a rotation, which does not mean they cannot run one, only that the load per person will be higher and the sustainability constraint tighter.
Follow-the-sun coverage distributes responders across time zones so that every shift falls within someone's working day. It removes the sleep-disruption problem almost entirely and requires either geographic distribution or a partner who provides it. Google's guidance notes the option of six engineers in each of two locations as an alternative to eight in one.
Managed or outsourced first-line response places an external team on the initial alert, with defined runbooks for known conditions and escalation to internal engineers for anything novel. This can be an effective way to buy overnight coverage without hiring for it, and its quality depends almost entirely on the quality of the runbooks and the clarity of the escalation criteria.
Escalation-only arrangements define what triggers waking someone, with everything below that threshold waiting until morning. This is a legitimate model, and it is compatible with an SLA only if the events that would breach the SLA are all above the threshold.
The models differ in cost, coverage quality, and sustainability. The choice should follow from customer criticality, contractual commitment, and company stage rather than from a general belief that mature companies have on-call rotations. A product used by European customers during European business hours, sold with a 99.5% commitment measured monthly, may reasonably not staff overnight at all. A payments platform serving global merchants cannot make that choice.
What is not viable is committing contractually to round-the-clock availability while staffing for business hours and hoping that failures observe the schedule.
PART XXI — THE HUMAN COST
Reliability Is Also a Staffing Load
Reliability spending is usually discussed as infrastructure spending. A significant portion of it is human, and that portion is the part that degrades quietly.
Google's SRE practice treats on-call load as a quantity to be managed rather than absorbed. The stated target is a maximum of two incidents per on-call shift, to ensure adequate time for follow-up, with the explicit note that if the pager load gets too high, corrective action is warranted. The reasoning behind the limit is instructive: if more than two events occur regularly per on-call shift, problems can't be investigated thoroughly and engineers are sufficiently overwhelmed to prevent them from learning from these events. The threshold exists to protect the quality of the response and the learning that follows it, not only the wellbeing of the responder.
The same materials cap purely operational work at 50% of an SRE's time, with at minimum 50% allocated to engineering projects, and observe that on-call participation itself sets a floor on that operational load: in a 6-person rotation, at least 2 of every 6 weeks are dedicated to on-call shifts and interrupt handling, which means the lower bound on potential toil is 33% of an SRE's time; in an 8-person rotation, the lower bound is 25%.
Translate that arithmetic to a startup. A four-person engineering team running a 24/7 rotation places each engineer on call one week in four. If pager load is meaningful, a substantial fraction of the team's total capacity is consumed by response and its aftermath, and it is consumed unpredictably, which is worse for planning than an equivalent amount of scheduled work. The cost of an availability commitment therefore shows up not only in the infrastructure bill but in reduced and less predictable delivery capacity.
Sustained interruption at unpredictable hours has consequences that are well documented in the engineering literature and reasonably obvious to anyone who has lived it: degraded focus, accumulating fatigue, and eventually attrition. Losing an experienced engineer who understood the system is one of the more expensive outcomes available to a small company, and it is an outcome that poorly designed on-call arrangements produce reliably.
The important strategic conclusion is about direction rather than tolerance. Repeated incidents should be treated as a signal that the system requires human compensation for something it should handle itself. The correct response to a recurring alert is not a better-rested responder; it is the elimination of the condition that generates it, through automation, architectural change, improved diagnostics, or removal of the failure mode entirely. An organization whose reliability depends on people being available to compensate for the system has built a model that scales linearly with load and degrades with time.
PART XXII — THE COMMUNICATION MODEL
Restoring the System Is Not Restoring the Relationship
An outage is two events happening at once. One is technical and has a clear endpoint. The other is a trust event, and its endpoint is determined by how the first one was communicated.
Customers experiencing an outage face a specific and uncomfortable problem: they must explain the situation to their own stakeholders using information they do not have. An account manager whose customer's operations team is asking what is happening, and who has nothing to tell them, is in a worse position than one who can relay a terse but honest update. The silence is itself the harm, because it converts a vendor problem into the customer's credibility problem.
The mechanisms are unremarkable and their absence is conspicuous:
A status page, hosted independently of the infrastructure it reports on, so it remains reachable when the product is not. Status pages that share infrastructure with the product have a habit of going down together.
Incident updates on a predictable cadence, even when the update is that the cause is still unknown. Predictability is more valuable than content. A customer who knows another update arrives in thirty minutes can plan; one who does not know anything cannot.
Direct contact for accounts where the relationship warrants it. Enterprise customers with named contacts expect to hear from a person, not to discover the incident on a public page.
A written post-incident summary for customers materially affected, describing what happened, what was done, and what will change. This is the artifact that converts an outage from evidence of unreliability into evidence of competence, and it is the one most often skipped because by the time it is due, everyone has moved on.
The distinction worth holding onto is between system restoration and trust restoration. These have different timelines, different owners, and different completion criteria. A company can restore service in eleven minutes and still lose an account, if the eleven minutes were silent and the follow-up never arrived. A company can suffer a two-hour outage and strengthen a relationship, if the communication throughout was honest, frequent, and specific, and if the follow-up demonstrated that the organization understood what happened.
None of this is public relations. It is the operational recognition that the customer is experiencing an information failure alongside the service failure, and that the second one is entirely within your control.
PART XXIII — THE REMEDY
Service Credits: When Reliability Gets a Price Tag
Availability commitments are usually paired with a remedy, and the most common form is a service credit against future fees. The specific structures vary widely, and nothing here should be read as legal advice; the terms of any actual agreement should be reviewed with qualified counsel.
The conceptual model is consistent across most of the market. If measured availability for a period falls below the committed threshold, the customer becomes eligible for a credit calculated as a percentage of the fees for that period. The percentage typically increases as availability worsens, creating a tiered structure. The credit is applied against future invoices rather than refunded. There is usually a cap on total credits in any period, and the credit is frequently stated as the customer's exclusive remedy for the availability failure.
The cloud providers illustrate the pattern at scale. AWS's compute SLA tiers credits at 10%, 30%, and 100% of the monthly bill depending on how far Monthly Uptime Percentage falls. Google's Cloud Run SLA caps aggregate credits at 50% of the amount due for the covered service in the affected region. Both require the customer to claim: Google requires notice within thirty days, and failure to do so forfeits the right to the credit. AWS credits are similarly claim-based rather than automatic.
Three observations follow for a SaaS company drafting its own version.
The first is that credit structures are a pricing mechanism, not a penalty in the punitive sense. They exist to allocate a defined amount of financial risk in a way both parties can model. A credit denominated as a percentage of monthly fees is bounded and predictable, which is why it is the market standard.
The second is that the obvious cost is the smallest one. The credit itself is calculable in advance and usually modest relative to contract value. The costs that surround it are not: support volume during and after the incident, engineering hours diverted from planned work, executive attention consumed by escalation, the account team's time spent rebuilding confidence, the additional diligence the customer applies at renewal, and the friction the incident introduces into other sales conversations if it becomes visible.
The third is that these consequences scale with the customer rather than with the outage. The same forty minutes of downtime produces a routine credit note for a small account and a formal escalation, a remediation plan, and a quarterly review agenda item for a large one.
It is worth resisting the temptation to dramatize this. A single SLA breach does not usually destroy a company, and the credit is rarely the decisive factor in a renewal decision. What breaches do is shift the terms of the relationship. They move reliability from an assumption to a topic, and topics are harder to charge a premium for than assumptions.
PART XXIV — THE REAL EXPOSURE
The Credit Is Not the Ceiling
A founder reading a credit schedule can arrive at a comforting conclusion: if the worst case is 10% of a month's fees, then the maximum downside of an availability failure is bounded and small. The credit is indeed bounded. The economic consequence is not the same thing.
The contractual remedy is one term in a larger expression. The other terms are not written into the agreement and do not appear on any invoice.
Transaction loss during the outage. For products where customers transact, the value that fails to flow during downtime does not return afterward. Some of it is deferred and recovers; some is genuinely lost.
Support load. An outage generates a spike in tickets, and the spike outlasts the incident. The queue built during forty minutes of downtime takes considerably longer than forty minutes to clear, and the tickets it contains are unusually difficult ones.
Engineering opportunity cost. Every engineer pulled into an incident is not building. The cost extends past the incident into the recovery of focus and the remediation work that follows, which is real work that displaces planned work.
Customer confidence and its second-order effects. A customer who has experienced an outage evaluates the vendor differently. That evaluation surfaces as additional diligence, more conservative expansion decisions, and closer scrutiny of the next incident, which will be measured against the last one rather than against zero.
Renewal and expansion dynamics. Reliability failures rarely cause immediate churn. They alter the conversation at renewal, where they function as leverage on price, terms, and the availability commitment itself.
Sales friction. Prospects in regulated or operationally sensitive markets ask about incident history. A well-documented incident with a credible remediation narrative is manageable. A pattern is not.
This is not an argument that downtime is catastrophic. It is a correction to a specific and common reasoning error: treating the contractual remedy as an estimate of the total cost. The remedy exists to allocate a defined slice of risk between two parties. It was never designed to measure the business consequence, and it does not.
The practical implication for SLA design is that the credit schedule should not be the primary input to how much reliability the company builds. The relevant question is what an outage actually costs this business, in this market, with these customers, and whether that cost justifies the investment required to reduce its frequency and duration. That calculation lives in the next section.
PART XXV — THE ECONOMIC MODEL
The Reliability Price Curve
Reliability is purchased, not wished for, and what it costs is governed by a curve rather than a rate.
The shape of that curve is the most useful economic intuition in this entire subject. At the low end, improvements are cheap and enormously valuable. Moving a system from genuinely fragile to reasonably dependable — adding health checks and automatic restarts, putting the application behind a load balancer across more than one availability zone, using a managed database with automated backups, establishing a deployment pipeline that can roll back, alerting on the critical journeys — typically costs a modest amount of engineering time and produces a step change in customer experience. This early portion of the curve is close to free money, and organizations that have not walked it should walk it regardless of what any contract says.
Further along, the curve steepens. Getting from reasonably dependable to consistently dependable requires capabilities that are individually expensive and collectively transformative: redundancy across regions rather than zones, automated failover with tested promotion of replicas, staged rollouts with automated rollback triggers, comprehensive monitoring of business outcomes, a staffed response capability covering all hours, architectural isolation so that one tenant's or one feature's failure cannot propagate, and testing that exercises failure conditions rather than only success paths. Each of these is a project. Several are permanent operational commitments.
Beyond that, the curve becomes very steep indeed. Multi-region active-active operation, cross-provider redundancy for critical dependencies, automated remediation for known failure classes, and continuous verification of recovery capability are the domain of organizations for whom reliability is a primary product attribute rather than a supporting one.
Table 7 — The Reliability Price Curve
| Zone | Approximate Character | What It Typically Requires | Marginal Cost | Marginal Customer Value |
|---|---|---|---|---|
| Fragile → Basic | Single points of failure removed | Health checks, restarts, managed services, backups, basic alerting | Low | Very high |
| Basic → Dependable | Survives common failures without heroics | Multi-AZ, deployment pipeline, tested rollback, critical-journey monitoring, defined response | Moderate | High |
| Dependable → Strong | Survives most failures without customer impact | Automated failover, staged rollout, business-outcome alerting, 24/7 response, degradation design | High | Moderate to high, depending on segment |
| Strong → Exceptional | Survives regional and provider failure | Multi-region, cross-provider redundancy, automated remediation, continuous resilience verification | Very high | Narrow; matters intensely to a small set of buyers |
The concept worth carrying into executive conversations is the marginal cost of reliability: not what reliability costs in total, but what the next increment costs given where the system currently sits. That number is entirely specific to the architecture. A team already running multi-AZ with automated deployment may find the next increment cheap. A team with a single primary database and a manual release process may find the same increment prohibitive, because the increment is not really an increment; it is a rebuild.
This reframes the question a founder should be asking. It is not what is the highest availability number we can put on the website. It is: at what reliability level does the incremental customer value stop justifying the incremental operating cost? That point is different for every company, and finding it honestly is more valuable than clearing any particular bar.
PART XXVI — WHEN 99.9% IS TOO HIGH
The Case Against Premature Reliability
The prevailing cultural assumption is that a stricter SLA is a better SLA. For a meaningful number of companies, at a meaningful stage, this assumption is expensive and wrong.
Consider a product with a few dozen customers, used by internal teams during working hours, where an hour of unavailability means an hour of deferred work rather than lost revenue. The customers are early adopters who chose the product because it solves a problem their existing tools do not, and their tolerance for imperfection is correspondingly high. The engineering team is four people. The dominant risk to the company is not that the product breaks; it is that the product is not yet valuable enough to build a business on.
Committing that company to 99.9% monthly availability does several things, none of them good.
It redirects scarce engineering capacity from product discovery to reliability infrastructure that no customer asked for. Every hour spent building automated failover for a system with forty users is an hour not spent finding out whether the product should exist in its current form.
It introduces architectural complexity ahead of the knowledge required to design it well. Redundancy, multi-region deployment, and sophisticated deployment pipelines are all easier to build correctly once the shape of the system has stabilized. Building them early frequently means building them around assumptions that turn out to be wrong, and then carrying that structure as debt.
It creates an on-call obligation that a four-person team absorbs badly, with the consequences described earlier.
It slows the rate of change at precisely the stage when rate of change is the company's main asset.
And it establishes a commercial precedent that is difficult to walk back. An SLA offered in the first enterprise deal becomes the floor for every subsequent negotiation.
None of this is an argument for shipping carelessly. The basic zone of the reliability curve — the cheap, high-value zone — should be occupied by every company from the beginning, because it is inexpensive and because customers do notice when a product falls over constantly. The argument is against proportionality failure: building for a reliability level the customer does not require, cannot perceive, and is not paying for.
The uncomfortable version of this question, and the one worth asking directly in a pricing conversation: if we offered this customer 99.5% at the current price and 99.9% at a higher price, which would they choose? If the honest answer is that they would take the lower number and keep the money, the market has provided useful information about what it values.
PART XXVII — WHEN 99.9% IS NOT HIGH ENOUGH
The Case for More
The symmetric error is equally real. For some products, 43 minutes of monthly downtime is not a reasonable target; it is an unacceptable one, and offering it signals a misunderstanding of what the product does.
The determining factor is consequence. When a product sits underneath other people's operations, its unavailability does not merely inconvenience its users; it propagates into their obligations, their revenue, and sometimes their own contractual commitments.
Categories where this commonly applies include infrastructure and platform services that other software depends on programmatically, since their downtime becomes their customers' downtime and multiplies. Payment and financial transaction processing, where unavailability directly stops revenue for every merchant on the platform and where transactions have timing significance. Communication and alerting infrastructure, where the entire value proposition is being available at unpredictable moments. Security and access control systems, whose unavailability can either block legitimate operations entirely or, worse, create pressure to bypass them. High-volume operational systems in logistics, manufacturing, or field operations, where downtime translates into physical processes stopping.
Products operating in healthcare, safety-adjacent, or heavily regulated contexts warrant particular care, and the considerations there extend well beyond availability percentages into regulatory obligations, validation requirements, and duties that no SLA discussion can substitute for. Companies in those markets should be working with domain-specific regulatory and legal expertise rather than reasoning from general reliability principles.
The general point stands across all of them: availability requirements should derive from what happens to the customer when the service is unavailable, not from what the competition advertises. A product whose failure stops its customers' revenue has a reliability obligation that exists whether or not it is written into a contract, and pricing that obligation into the product is more honest than discovering it during an escalation.
PART XXVIII — THE CRITICALITY MODEL
Deriving the Target From the Consequence
If availability targets should follow from consequence, the consequence needs to be characterized. The following framework is intended for executive discussion rather than as a scoring mechanism, and deliberately does not assign uptime targets to tiers, because the mapping from criticality to percentage depends on variables no general framework can know.
Low criticality. Downtime is noticed and tolerated. Users defer their work and resume later with no lasting cost. Alternative workflows exist. Examples tend to be analytical, informational, or periodic rather than transactional.
Medium criticality. Downtime interrupts meaningful work and creates real cost, but that cost is absorbed rather than compounding. Users are blocked for the duration and recover afterward. Most horizontal B2B productivity software sits here.
High criticality. Downtime interrupts revenue, customer-facing operations, or workflows with external commitments attached. The customer's own service quality degrades. There is often no viable manual fallback.
Very high / mission-critical. Failure creates severe economic, operational, safety, or regulatory consequences that extend well beyond the immediate interruption, and recovery may not fully restore what was lost.
Table 8 — Variables That Determine Criticality
| Variable | Question to Answer | Why It Moves the Target |
|---|---|---|
| Maximum tolerable interruption | How long before the customer's own operations are materially harmed? | Sets the ceiling on acceptable single-incident duration, which often matters more than the monthly percentage |
| Usage concentration | Is demand spread evenly or concentrated into narrow peaks? | Ten minutes of downtime during a peak may exceed the impact of two hours at a trough |
| Recovery expectation | Does the customer expect restoration in minutes or in hours? | Determines required response model and staffing more than it determines architecture |
| Data sensitivity | Is any data loss recoverable by the customer? | Drives RPO requirements independently of availability |
| Alternative workflow | Can the customer work around the outage? | The presence of a fallback dramatically reduces effective criticality |
| Contract value and concentration | How much revenue sits behind this expectation? | Determines how much reliability investment is economically rational |
| Downstream propagation | Does our failure become our customer's failure to their customers? | The single strongest amplifier of criticality |
The last row deserves emphasis. A product used internally by a customer's team has a bounded blast radius. A product embedded in a customer's own service delivery has a blast radius equal to the customer's entire user base, and it should be treated accordingly regardless of how modest the contract value looks.
PART XXIX — THE EVIDENCE STANDARD
Do Not Sell an SLA Your System Has Never Demonstrated
There is a principle here that is simple to state and consistently ignored under commercial pressure: reliability commitments should be backed by operational evidence rather than by intention.
The evidence in question is not exotic. It is the ordinary output of a system that has been running and observed:
Historical availability, measured the way the contract will measure it. Not infrastructure uptime, not an approximation assembled after the fact, but the actual metric against the actual definition, ideally over a period long enough to include a bad month. Three months of data is thin. Twelve months is meaningful.
Incident frequency and severity distribution. How often does customer-impacting failure occur, and what does the tail look like? A system with a stable low rate and one nine-hour outage is a different risk than one with a moderate rate and a tight distribution.
Measured recovery times across real incidents. Both the median and the worst case. The worst case is what breaches SLAs.
Detection performance. The interval from failure onset to human awareness, measured across actual events rather than assumed from monitoring configuration.
Load testing results at realistic and above-realistic volumes. Systems that are reliable at current load and unknown at three times current load have an availability profile that depends on the sales team's success.
Failover exercises that were actually performed. A documented failover procedure is a plan. An executed failover with a recorded duration is a capability.
Backup restore exercises with measured RTO and RPO. As discussed, the gap between assumption and measurement here is routinely large.
Deployment reliability data. What proportion of releases cause customer-visible problems, and how long do those problems last?
Critical-journey monitoring coverage. Whether the signals that would detect an SLA-relevant failure actually exist in production today.
The reason to insist on evidence is not caution for its own sake. It is that a commitment made without evidence is a commitment whose risk is unquantified, and unquantified risk cannot be priced, hedged, or explained to a board. A system that has never operated at 99.9% may well be capable of it. It may equally be running at 99.4% and nobody has measured. Both are consistent with the same subjective impression that things seem to be going fine.
The commercial version of this principle is worth stating plainly to sales leadership, because it is not an obstruction. If a deal requires a stronger availability commitment than the evidence supports, the correct response is not refusal and it is not silent acceptance. It is to scope what would be required to support the commitment, price that work, and decide whether the deal justifies it. That is a normal business decision. It only becomes a problem when the decision is made implicitly, by signature, without anyone having done the scoping.
PART XXX — THE SLA READINESS GAP
Measuring the Distance Between Promise and Capability
The concept that ties this article together can be named directly.
The SLA Readiness Gap is the distance between the reliability a company has promised commercially and the reliability it has demonstrated operationally.
This is a management framework rather than an industry-standard metric, and it is offered as a structure for a specific conversation: the one that should happen between engineering, sales, and leadership before a meaningful availability commitment is signed, and periodically thereafter.
The gap has eleven dimensions. Each corresponds to a capability that an availability commitment silently assumes.
Promise. What has been contracted, precisely: the percentage, the window, the interval, the definition of the service, and the exclusions.
Measurement. Whether the organization can calculate the committed metric accurately, from production data, without manual reconstruction.
Visibility. Whether customer-impacting failure is detected by the system rather than reported by customers.
Recovery. Whether service can be restored within a timeframe consistent with the commitment, demonstrated rather than estimated.
Architecture. Whether the system tolerates the failures that actually occur: instance loss, zone degradation, dependency failure, traffic spikes, bad deployments.
Dependencies. Whether the external failure modes on critical paths are understood, and whether the composition of those dependencies is consistent with the promise.
Delivery. Whether production can be changed safely and reversed quickly.
People. Whether incidents can be handled competently at any hour the commitment covers.
Data. Whether critical state can be recovered, to a known point, within a known time.
Communication. Whether customers can be informed accurately during and after an incident, through channels that survive the outage.
Evidence. Whether any of the above has been tested recently, or is believed to be true.
Table 9 — The SLA Readiness Matrix
| Capability | Current State | Contractual Requirement | Evidence | Gap | Business Consequence If Unclosed |
|---|---|---|---|---|---|
| Promise | e.g. 99.9% monthly, "the Service" undefined | Precise definition of covered capabilities | Contract text and internal definition doc | Definition ambiguity | Disputes over whether an event counted |
| Measurement | e.g. Infrastructure uptime only | Per-tenant availability of critical journeys | Availability report generated from production data | No customer-experienced metric | Reported availability diverges from customer perception |
| Visibility | e.g. Component health checks | Detection of critical-journey failure | Measured detection time across real incidents | Detection dominated by customer reports | Budget consumed before response begins |
| Recovery | e.g. Manual rollback, untimed | Restoration consistent with monthly allowance | Timed rollback and failover exercises | Recovery time unknown | Single incident can breach the period |
| Architecture | e.g. Single-AZ, single primary DB | Tolerance of instance and zone failure | Failure test results | No redundancy on critical path | Common failures cause total outage |
| Dependencies | e.g. Unmapped | Known critical-path dependencies with fallbacks | Dependency map with composition analysis | Weakest link unidentified | External failure attributed to us |
| Delivery | e.g. Manual release, no staged rollout | Safe, reversible production change | Change failure rate and recovery data | Releases are the leading incident cause | Reliability limited by delivery practice |
| People | e.g. Two founders informally | Response capability across committed hours | Rotation schedule and response-time data | No coverage outside business hours | Overnight incidents run until morning |
| Data | e.g. Automated backups, never restored | Known RTO and RPO | Timed restore exercise | Restore capability unverified | Data loss event with unknown recovery |
| Communication | e.g. Ad hoc email | Status page and defined update cadence | Prior incident communications | No independent status channel | Trust damage exceeding technical impact |
| Evidence | e.g. Impressions | Demonstrated performance over 12 months | Historical availability record | Commitment unsupported by data | Unquantified contractual risk |
The value of this matrix is not in filling it out perfectly. It is in the specific moments during its completion when someone says we don't actually know. Those moments are the deliverable. Each one is a risk the company was carrying without pricing it.
PART XXXI — THE SYSTEM PROPERTY
No Single Team Owns Uptime
There is a persistent organizational fantasy that reliability can be assigned. Give it to DevOps. Give it to the platform team. Hire an SRE. Make QA responsible for it.
Availability does not sit anywhere, because it is produced by the interaction of decisions made in almost every function.
Architecture determines which failures are survivable and which are fatal, and those decisions are frequently made years before anyone reads an SLA. Development determines how often changes introduce defects into critical paths, and how comprehensible the system is when something goes wrong at speed. Quality engineering determines whether business-critical behavior is verified before release and whether failure conditions have been exercised at all. Infrastructure and DevOps determine how quickly changes can be deployed and reversed, how the system responds to load, and what happens when a component disappears. Security determines both the frequency of emergency changes and the blast radius of certain incidents. Support determines how quickly customer-visible problems reach the people who can act. Product determines which capabilities are load-bearing and which can degrade, and whether the roadmap makes room for reliability work at all. Vendor and procurement decisions determine the failure modes the company inherits. Sales and legal determine what was promised in the first place.
The interdependence is what makes single-team ownership futile. A testing organization cannot compensate indefinitely for an architecture with no redundancy on its critical path; it can catch defects, and defects are only one source of downtime. An infrastructure team cannot deliver availability if every release breaks a critical workflow, because the failure enters from the delivery side. Developers cannot respond effectively to incidents they cannot observe, so monitoring investment constrains response quality regardless of engineering talent. And none of it matters if the commitment itself was set by a process that never consulted any of these functions.
Uptime is an organizational property. It emerges from how the company is put together, which is why fixing it usually requires changing more than one thing, and why it cannot be delegated to whichever team was most recently blamed for an outage.
PART XXXII — THE ROLE OF QUALITY ENGINEERING
What Testing Contributes, and What It Cannot
Quality engineering has a specific and bounded role in an availability commitment, and both the specificity and the boundedness are worth being honest about.
Testing does not produce uptime. A perfectly tested application running on a single instance in a single availability zone will still be unavailable when that zone degrades, and no amount of test coverage changes that. Anyone who suggests otherwise is selling something.
What quality engineering does contribute is reduction of a particular and significant class of reliability risk: the risk that a change breaks something customers depend on, and the risk that the system behaves badly under conditions nobody verified.
Critical-path testing focused on the short list of business-critical journeys from Part XI, rather than distributed evenly across a feature surface where most items carry little reliability weight.
Regression coverage that prevents previously solved failures from returning, which matters disproportionately because recurring incidents are the ones that erode both customer confidence and on-call sustainability.
Integration testing across the boundaries where components meet, since a large share of production incidents originate at interfaces rather than inside them.
Performance and load testing that establishes how the system behaves at and beyond expected volume, converting capacity from an assumption into a measurement. This is directly relevant to SLA risk, because availability commitments are usually made at current scale and honored at future scale.
Resilience testing that verifies behavior when dependencies are slow, unavailable, or returning unexpected responses.
Release validation that confirms critical journeys still function after deployment, using the same signals that back the availability metric.
Production-like environments that make all of the above meaningful, since verification against an environment that differs materially from production verifies a system that does not exist.
Automation that makes this verification fast enough to run on every change, because verification that is too slow to run gets skipped precisely when the schedule is tightest.
The reframing that matters in an SLA context concerns purpose. The point of testing here is not to find bugs, useful as that is. It is to generate evidence about whether business-critical behavior remains dependable under change and under failure. That evidence is exactly what Part XXIX said was missing when companies commit to availability targets on impression rather than data. Testing is one of the more reliable ways to produce it.
QAtronic's work in this space generally sits at that intersection: building the verification and performance capabilities that make reliability claims defensible, and assessing the delivery and testing practices that determine how much risk each change carries. That is a contribution to reliability, not a guarantee of it, and the distinction is the honest one.
PART XXXIII — TESTING FAILURE
Verify What Happens When Things Go Wrong
Most verification is oriented toward confirming success. Does checkout complete? Does the record save? Does the report generate? These are the right questions and they are half the picture.
Reliability engineering asks a different family of questions, and they are the ones that determine what happens during the events that consume error budget:
What happens when the payment provider responds in eleven seconds instead of four hundred milliseconds? Does the request queue, does the connection pool exhaust, does the timeout cascade backward into the user-facing tier, and does one slow dependency take down operations that have nothing to do with payments?
What happens when a database connection disappears mid-transaction? Does the application retry, does it retry safely, does it surface a coherent error, or does it leave state in a condition that requires manual repair?
What happens when a message is delivered twice? Distributed systems produce duplicates routinely. A workflow that charges a customer twice or creates two records has a correctness failure that is far worse than an availability failure.
What happens when a deployment completes partially, leaving two versions running simultaneously against a schema that only one of them understands?
What happens when a dependency returns a valid response containing wrong data, or an empty response where data was expected?
What happens when traffic increases fivefold in ten minutes?
Practices for exploring these questions exist along a spectrum. Failure injection in controlled environments introduces specific fault conditions and observes system behavior. Resilience testing verifies that degradation paths, fallbacks, and timeouts function as designed rather than as documented. Chaos engineering, in its disciplined form, extends this into production with tightly bounded experiments, explicit hypotheses, monitored blast radius, and immediate abort capability.
The sequencing matters, and getting it wrong is genuinely dangerous. These practices assume prerequisites: comprehensive monitoring that will reveal what the experiment caused, a defined and tested rollback path, an understanding of the system's normal behavior sufficient to recognize abnormal behavior, and an organization that can stop the experiment quickly. Introducing deliberate faults into a production system that lacks these is not resilience engineering; it is an outage with extra steps and worse attribution. The reasonable progression starts in isolated environments, moves to staging under realistic load, and reaches production only for organizations that have built the observability and control to do it safely.
The underlying idea travels further than the practices. An organization that has never observed its own system's behavior under failure conditions does not know how the system behaves under failure conditions. It has a model, assembled from design intent and reasonable inference, and models of complex systems under stress are wrong in ways that are specifically difficult to predict. The availability commitment is a bet on that model. Testing failure is how the bet gets checked before a customer checks it.
PART XXXIV — THE COST MODEL
What Stronger Reliability Actually Costs
Reliability decisions get made badly when the cost side is invisible. The following is a decision model rather than an accounting exercise: several of its inputs are estimates, some of its benefits resist direct measurement, and its purpose is to structure a conversation rather than to produce a number.
Table 10 — The SLA Cost Model
| Cost Category | What Changes When the Target Rises | Character of the Cost |
|---|---|---|
| Infrastructure | Additional zones or regions, larger capacity headroom, higher availability tiers of managed services | Recurring, scales with footprint |
| Redundancy | Standby capacity, replicas, secondary providers for critical dependencies | Recurring, often paying for capacity that is idle by design |
| Monitoring and observability | Broader instrumentation, higher data volume and retention, synthetic checks, more alerting endpoints | Recurring, scales with system complexity |
| Engineering | Architecture work, failover automation, degradation paths, remediation of recurring failures | One-time projects plus permanent maintenance load |
| Testing | Performance testing, resilience testing, expanded critical-path automation, production-like environments | Mixed; setup is capital-like, execution is recurring |
| Incident response | Tooling, runbooks, escalation infrastructure, post-incident process | Modest direct cost, meaningful time cost |
| On-call | Compensation, rotation coverage, reduced and less predictable delivery capacity | Recurring, and the least visible line item |
| Vendor premiums | Higher support tiers, enterprise plans required for stronger vendor commitments | Recurring, sometimes step-functional |
| Backup and recovery | Cross-region replication, shorter recovery windows, regular restore exercises | Recurring storage plus periodic time cost |
| Operational tooling | Deployment infrastructure, feature flag systems, status page, incident management | Recurring subscription plus integration effort |
Against this sits the value side, which is real and mostly indirect:
Enterprise eligibility. Some deals are gated on an availability commitment. If a segment is inaccessible without a stronger SLA, its expected revenue is a direct return on reliability investment, and it is the cleanest number in the model.
Retention. Reliability failures do not usually cause churn on their own; they contribute to it in combination with other factors, and they weaken the position from which renewals are negotiated.
Pricing power. Reliability that competitors cannot match is a differentiator that supports premium positioning, particularly in operationally sensitive segments.
Revenue protection. For transactional products, downtime has a directly attributable cost that can be estimated from throughput.
Reduced operational drag. Fewer incidents mean fewer interruptions, less unplanned work, and more predictable delivery. This is a genuine benefit and one that most organizations never quantify.
Sales efficiency. A credible reliability story shortens security and vendor reviews in enterprise procurement.
The output of this model should not be a number. It should be an answer to a question: is the revenue and retention we expect to unlock at the higher target worth the recurring operating cost and the engineering capacity it consumes? If the answer is unclear, the honest position is that the company does not yet have enough information to raise the commitment, which is a better place to be than having raised it anyway.
PART XXXV — THE PRICING QUESTION
Reliability Is a Product Capability With an Operating Cost
If a customer segment requires round-the-clock response, a stronger availability commitment, dedicated support contacts, and architectural accommodations that other customers do not need, then that segment is consuming a different product. Treating it as the same product at a different volume is a pricing error that compounds quietly.
The mechanics are simple. Reliability capabilities are largely fixed costs: the on-call rotation exists whether one customer or fifty require it, the multi-region deployment costs the same regardless of how many accounts justify it. But the decision to build them is usually triggered by a specific deal, and if that deal was priced without reference to the capabilities it triggered, the company has taken on a permanent cost against a fixed revenue line.
Companies handle this in different ways, and this article deliberately does not recommend a specific approach, since pricing structure is a commercial decision shaped by market, competition, and contract terms that vary widely. What can be said is that the structural options exist and are widely used: differentiated availability commitments across product tiers, support and response commitments priced separately from the product, enterprise agreements that account for the operational obligations they create, and deployment options with distinct reliability characteristics and distinct pricing.
The conceptual point is the one that matters. Reliability is not free infrastructure that comes with the software. It is a capability with a construction cost, a recurring operating cost, and a permanent claim on engineering capacity. Products that treat it as included by default end up funding it out of margin, and the funding is invisible until someone examines why the engineering roadmap has been slower than expected for four quarters.
Any actual contract structure, credit mechanism, or commitment language should be reviewed with qualified legal counsel before it is offered.
PART XXXVI — THE REVIEW
SLA Negotiation Is Technical Due Diligence
Availability commitments should be reviewed by someone who understands the system before they are signed. This is not a proposal that engineering acquires veto power over sales, and framing it that way guarantees the process will be resented and circumvented.
The case for review is simpler and less political. Contract language creates engineering obligations. Obligations require capacity. Capacity must be planned and funded. A commitment that arrives in engineering after signature arrives as an unplanned demand against a roadmap that was already committed, which is exactly the condition that produces both missed reliability targets and missed product deadlines.
Sales and engineering see this problem differently for entirely legitimate reasons, and it helps to name why. A salesperson evaluating an availability clause is looking at a term that appears in nearly every enterprise contract, that the customer has asked for as a matter of standard procurement practice, and that competitors are all offering. Declining it looks like an unforced error that risks a deal for a reason the customer will find unconvincing. An engineer evaluating the same clause is looking at a commitment that implies capabilities the system does not currently have, work that is not on any roadmap, and an operational burden that will fall on a team already at capacity. Both readings are correct. They differ because they are looking at different halves of the same object.
A short review conversation resolves most of this, and it works better when it is a standing part of the deal process rather than an escalation. The questions worth answering:
What is measured, and against what definition of the service? Whether the metric is one the company currently produces.
What window and interval apply? Calendar month, rolling, or annual; sampling granularity; binary or error-rate based.
What is excluded? Maintenance, third-party failure, customer-caused issues, force majeure, and whether those exclusions match how the system actually fails.
What reporting is required? Whether availability reports must be produced, on what cadence, and whether the company can generate them without manual effort.
What response commitments exist? Acknowledgment times, update cadence, and severity definitions, which are often more operationally demanding than the availability figure itself.
Which dependencies sit on the critical path? And whether their own commitments and failure modes are compatible with the promise.
What remedies apply, and are they capped? A question for legal, informed by engineering's view of breach probability.
Does the current architecture support this, and if not, what would? Scoped, estimated, and presented as a decision rather than an objection.
The output is not approval or rejection. It is an informed decision, made by the people who can weigh deal value against engineering cost, with both quantities visible at the same time.
PART XXXVII — THE SLA PROMISE MAP
What One Clause Actually Contains
Everything in this article can be arranged as a single expansion. The contract contains one line. That line contains a system.
                        ┌─────────────────────────────┐
                        │  Service Availability: 99.9% │
                        └──────────────┬──────────────┘
                                       │
                    ┌──────────────────▼──────────────────┐
                    │      DEFINITION OF THE SERVICE      │
                    │  Which capabilities must function?  │
                    └──────────────────┬──────────────────┘
                                       │
                    ┌──────────────────▼──────────────────┐
                    │            MEASUREMENT              │
                    │  Window · Interval · Exclusions ·   │
                    │  Binary or proportional             │
                    └──────────────────┬──────────────────┘
                                       │
                    ┌──────────────────▼──────────────────┐
                    │     CRITICAL CUSTOMER JOURNEYS      │
                    │  The short list that defines "down" │
                    └──────────────────┬──────────────────┘
                                       │
         ┌─────────────────────────────┼─────────────────────────────┐
         │                             │                             │
┌────────▼─────────┐         ┌─────────▼─────────┐        ┌──────────▼────────┐
│    MONITORING    │         │   ARCHITECTURE    │        │   DEPENDENCIES    │
│ Detection of     │         │ Redundancy ·      │        │ Composition ·     │
│ journey failure  │         │ isolation ·       │        │ fallbacks ·       │
│ · synthetic      │         │ degradation paths │        │ weakest critical  │
│ checks · outcome │         │                   │        │ link              │
│ signals          │         │                   │        │                   │
└────────┬─────────┘         └─────────┬─────────┘        └──────────┬────────┘
         │                             │                             │
         └─────────────────────────────┼─────────────────────────────┘
                                       │
                    ┌──────────────────▼──────────────────┐
                    │           RELEASE SAFETY            │
                    │  Pipeline · staged rollout ·        │
                    │  flags · tested rollback            │
                    └──────────────────┬──────────────────┘
                                       │
                    ┌──────────────────▼──────────────────┐
                    │         INCIDENT RESPONSE           │
                    │  Ownership · severity · escalation  │
                    │  · access · decision authority      │
                    └──────────────────┬──────────────────┘
                                       │
         ┌─────────────────────────────┼─────────────────────────────┐
         │                             │                             │
┌────────▼─────────┐         ┌─────────▼─────────┐        ┌──────────▼────────┐
│     RECOVERY     │         │     STAFFING      │        │   COMMUNICATION   │
│ Rollback ·       │         │ Coverage hours ·  │        │ Status page ·     │
│ failover ·       │         │ rotation size ·   │        │ update cadence ·  │
│ restore · RTO/RPO│         │ sustainable load  │        │ account contact · │
│                  │         │                   │        │ postmortem        │
└────────┬─────────┘         └─────────┬─────────┘        └──────────┬────────┘
         │                             │                             │
         └─────────────────────────────┼─────────────────────────────┘
                                       │
                    ┌──────────────────▼──────────────────┐
                    │      COMMERCIAL CONSEQUENCES        │
                    │  Credits · escalation · renewal ·   │
                    │  reputation · pricing               │
                    └─────────────────────────────────────┘
Read downward, the map shows how a commercial term propagates into an operating system. Read upward, it shows something more useful: every layer is a place where the promise can fail independently. Perfect architecture with no detection produces long outages. Excellent detection with no response capability produces long outages that someone watched. Fast recovery with no communication produces short outages and damaged relationships. Strong capability across every layer, with no measurement, produces a company that cannot demonstrate compliance with the term it agreed to.
The number at the top is the only part of this that appears in the contract. The rest is what the contract assumes.
PART XXXVIII — THE RELIABILITY MEMO
One Document, Written Before the Signature
The practical instrument that closes the gap between the two halves of this problem is short and unglamorous. Before approving a meaningful availability commitment, write an internal memo. Two pages. It is not a checklist to be filed; it is the artifact that forces sales, legal, leadership, and engineering to look at the same object at the same time.
The memo answers the following, in plain language:
What exactly are we promising? The percentage, the window, the interval, the definition of the service, the exclusions, and the response commitments, stated as an engineer would need to implement them rather than as a contract states them.
How will it be measured? Which signals, generated where, aggregated how, and by what system. If the answer is "we would have to build that," say so here.
What does the customer need in order to consider the product usable? The short list of critical journeys, in the customer's language.
What historical evidence supports the commitment? Measured availability over what period, incident frequency, and recovery times from real events. If the evidence does not exist, the memo says that, and the commitment becomes an explicit risk decision rather than an assumption.
What are the largest failure dependencies? The components on the critical path whose failure we do not control, and what happens when each fails.
How quickly can we detect critical failures? Measured, not designed.
How quickly can we recover? Median and worst case, from real incidents.
What happens outside business hours? Specifically: who is reachable, with what access, under what authority, and how quickly.
What data recovery capability exists? Demonstrated RTO and RPO, from an exercise performed on a date that can be named.
What changes are required to support this commitment? Scoped as work, not as aspiration.
What will those changes cost? In money and in engineering capacity, including the recurring portion.
What happens if we miss the target? The contractual remedy, plus the realistic operational and commercial consequences.
Who owns this commitment internally? One name. Not a team.
The memo's value is not in its answers. It is in the questions that turn out to have no answer, and in the fact that this discovery happens before signature rather than during an incident. A memo that reveals four unknowns has done its job better than one that confidently resolves everything.
PART XXXIX — STAGE SENSITIVITY
The Right Commitment Changes as the Company Does
Reliability posture should evolve, and it should evolve deliberately rather than by accumulation. The stages below describe common patterns rather than a required sequence; companies serving critical infrastructure from their first customer may need enterprise-grade reliability at ten employees, and companies selling internal tooling may never need it.
Early stage. A small number of customers, a small team, and a product whose primary risk is being wrong rather than being down. The appropriate posture occupies the cheap end of the reliability curve: managed services, automated backups, basic alerting, a deployment process that can be reversed, and clarity about what is actually critical. Availability commitments should be modest, honestly measured, and set below demonstrated performance. Nothing here prevents the company from raising the commitment later, and raising a commitment is far easier than lowering one.
Growth stage. More customers, more integrations, more concentrated revenue, and buyers whose procurement processes require formal commitments. This is where the SLA Readiness Gap typically becomes visible, because commitments made during the early stage are now attached to accounts that matter. The work of this stage is operational discipline: real measurement of customer-experienced availability, a defined response model, delivery practices that make change safe, and dependency analysis on the critical path.
Enterprise stage. Contracts carry specific measurement, reporting, response, and remediation obligations, and customers audit them. Reliability becomes a subject of quarterly review rather than an assumption. The requirements extend past availability into evidence: reporting the company can produce reliably, incident processes that withstand scrutiny, and recovery capabilities that have been demonstrated rather than described.
Critical platform. Reliability is a primary product attribute, priced as such, and the organization is structured around it. Investment decisions weigh reliability alongside functionality rather than after it.
The failure mode across all of these is the same: commitments that ratchet upward with each deal while capability advances at its own slower pace. The gap between them is the SLA Readiness Gap, and it widens quietly, one negotiation at a time, until an incident measures it.
PART XL — THE DECISION FRAMEWORK
Five Questions Before Raising the Number
When a deal, a competitor, or a board conversation creates pressure to strengthen an availability commitment, five dimensions frame the decision. This is a structure for executive discussion, not a scoring rubric, and any attempt to reduce it to a total will produce a number that means nothing.
Customer consequence. What actually happens to this customer when the service is unavailable for an hour? Not what they say in a negotiation, where every buyer's requirements are absolute, but what genuinely occurs in their operations. If the honest answer is that work is deferred, the case for a stricter commitment is weak. If their revenue stops or their own customers are affected, it is strong.
Commercial value. Does the stronger commitment unlock revenue that is otherwise inaccessible, or protect revenue that is otherwise at risk? Specifically and in aggregate, since a single deal rarely justifies a permanent operating cost, while a segment might.
Technical capability. Can the system deliver it, based on evidence rather than intention? If not, what specifically would be required, scoped as work with an estimate?
Operational capability. Can the organization detect, respond to, and recover from failure at the pace the commitment implies, during all the hours it covers? This is the dimension most often assumed and least often verified, and it is where the staffing question becomes unavoidable.
Economic capability. Is the company willing and able to fund it, including the recurring costs and the permanent claim on engineering capacity? A commitment the company cannot afford to support is not a commitment; it is a deferred failure.
A weak answer on any single dimension is informative. Weak answers on customer consequence and commercial value together suggest the commitment is being made for reasons that have nothing to do with the business. Weak answers on technical and operational capability with strong answers on the first two suggest a genuine investment decision, which is a good problem. A weak answer on economic capability alone means the decision has already been made and someone has not noticed.
THE OBJECTIONS
Arguing Against This Article
Every argument here is worth pressure-testing, and the following objections are the ones that come up most often in rooms where these decisions are made. Several of them are substantially correct.
"Cloud providers already handle uptime." Partially true, and the part that is true is genuinely valuable. Managed infrastructure has eliminated entire categories of failure that consumed engineering effort a decade ago. The limitation is scope. A provider's commitment covers the provider's service, measured the provider's way, remedied by a credit against the provider's bill. Your customers experience your application, which includes your code, your architectural choices, your deployment process, your data model, and every dependency you selected. Infrastructure reliability is an input to product reliability. It is not a substitute for it, and the composition arithmetic in Part IX explains why the gap can be large.
"We are too small for SRE." Almost certainly true, and irrelevant to the argument. Nothing in this article requires a site reliability engineering function, a formal incident management practice, or an on-call rotation with eight participants. What it requires is that someone knows what was promised, that something measures whether it is being delivered, and that the organization has thought about what happens when it is not. Those are practices, not headcount.
"Our customers don't care about SLAs." Sometimes accurate, and when it is accurate it is a strong argument against building reliability infrastructure the market is not asking for. Part XXVI makes this case at length. The caution is that this claim is easy to hold past its expiry date. Customer requirements change as customers grow, as deployments deepen, and as buying moves from a team lead with a credit card to a procurement function with a questionnaire. It is worth re-testing rather than assuming.
"99.9% is standard, so it's low-risk." The number is standard. The obligations it creates are specific to your architecture, your dependencies, your delivery process, and your staffing. Standard language on a page that describes a non-standard system produces a non-standard commitment. Two companies signing identical clauses can be taking on very different risks.
"More redundancy solves reliability." Redundancy is powerful and it is not free of downside. Redundant systems are more complex, and complexity introduces failure modes of its own: split-brain conditions, failover that triggers when it should not, replication lag that produces inconsistent reads, and configuration drift between supposedly identical paths. Redundancy that has never been exercised is particularly hazardous, because it creates confidence without capability. The failure mode where automated failover promotes a stale replica and causes data divergence is worse than the outage it was built to prevent.
"More monitoring solves downtime." Monitoring detects. It does not prevent, and it does not recover. An organization with excellent monitoring and no response capability discovers its outages promptly and then watches them. Monitoring is necessary and it sits in the middle of a chain that also requires architecture that fails gracefully and an organization that can act on what it sees.
"We should promise 100%." Absolute availability commitments deserve extreme caution. No complex distributed software system achieves perfect availability over meaningful time, because such systems depend on hardware that fails, networks that partition, dependencies that degrade, and changes that carry risk. Google's own guidance calls 100% targets both unrealistic and undesirable, noting they can reduce the rate of innovation and deployment, require expensive, overly conservative solutions, or both. A commitment that will certainly be breached is a commitment that guarantees the company will be in default, and any such term should be reviewed with legal counsel before it is offered under any circumstances.
99.9%
The number has not changed.
It is still three digits and a decimal point in a table in a contract, occupying less space than the notice period. It still looks like a formality. A prospect will still ask for it, a competitor will still advertise it, and a template will still contain it.
What has changed is what the number is understood to contain. Behind it sit the definition of what the service actually is, the instrumentation that produces the metric, the architecture that determines which failures are survivable, the dependencies whose reliability composes into your own, the delivery process through which most incidents enter, the detection that determines how much of the allowance is spent before anyone acts, the recovery capability that determines how the rest is spent, the people who will be reachable at hours nobody wants to think about when the deal is being signed, the communication that decides whether a resolved outage is also a resolved relationship, and the money that funds all of it, permanently.
Forty-three minutes a month. That is the whole allowance at 99.9%, and it is spent by ordinary events: a slow deployment rollback, a dependency that degrades before it fails, twenty minutes when nobody noticed. The organizations that hold the number are not the ones with the most impressive infrastructure. They are the ones that decided what they were promising, measured whether they were delivering it, and closed the distance between the two before a customer measured it for them.
An availability commitment is not a term Sales inserts and Engineering absorbs. It is a description of how the company intends to operate, written in the only language a contract can express it in. The percentage is the summary. The operating model is the promise. A company should sell the reliability it can actually run, price it honestly, and improve the number when the evidence arrives rather than when the deal requires it.
Where to Start
SLA & Reliability Readiness Assessment
Before committing to a stronger availability target, it is worth establishing whether the product and the operating model can support it. A readiness assessment examines the dimensions this article has mapped: the critical customer workflows that define availability, the evidence of current performance, the monitoring that would detect customer-impacting failure, the deployment process through which most incidents arrive, dependency risk on the critical path, performance behavior under realistic load, testing coverage of business-critical journeys, demonstrated recovery capability, and incident readiness across the hours the commitment covers.
QAtronic works with engineering and product leadership to assess these areas and to identify the specific gap between a proposed commitment and demonstrated capability.
If an enterprise deal requires a stronger SLA, evaluate the engineering gap before the commitment becomes contractual.



