
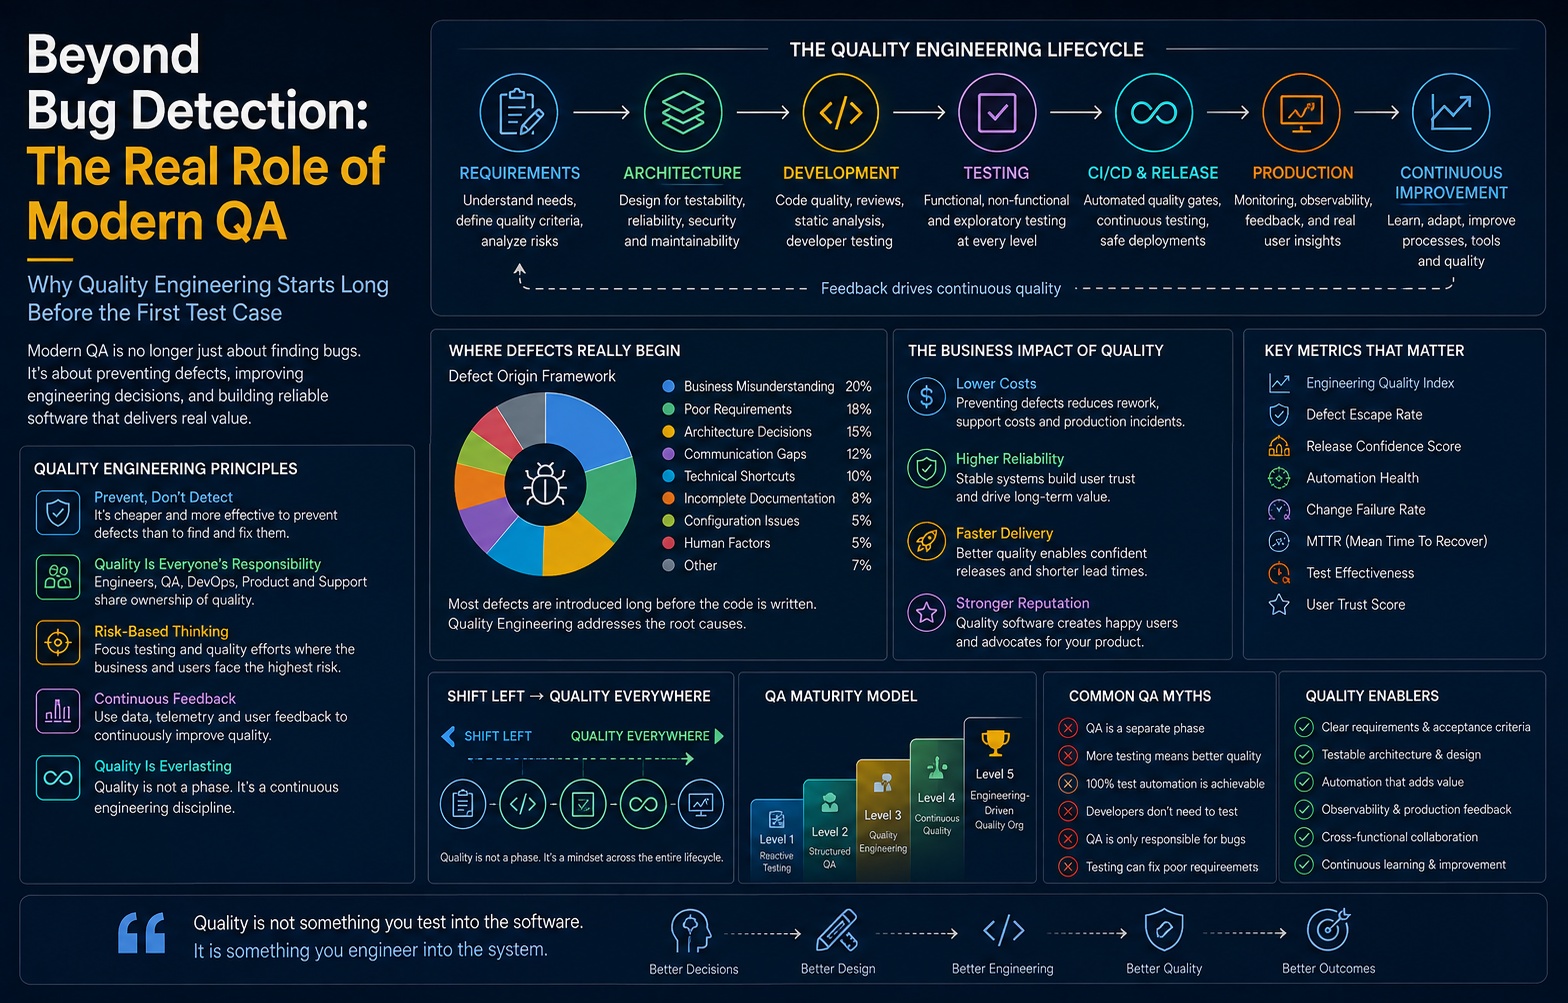
There is a persistent accounting error at the heart of most engineering organizations: quality is budgeted as a phase and consumed as a system property.
The budget line says "QA" and points at a team, a set of tools, a stage in the pipeline, and a number of days before release. The reality is that by the time that stage begins, the overwhelming majority of the defects that will reach production have already been created — not written into code, but decided into existence during a requirements conversation that ended too early, an architecture review that optimized for delivery date, a schema choice that made an invalid state representable, or a deployment topology that nobody modeled under partial failure.
Testing did not create those defects. Testing is simply where they become visible. And an organization that funds visibility while underfunding prevention will spend increasing amounts of money to be told bad news later and later in the lifecycle.
This paper argues a single thesis:
Modern quality engineering is not a testing activity. It is a control system distributed across the entire software development lifecycle, whose purpose is to reduce the rate at which defects are created — not merely the rate at which they are found.
We call this control system the Quality Engineering Lifecycle (QEL). Its central claim is structural rather than cultural: quality is an emergent property of the engineering system that produces the software, in the same way that latency is an emergent property of an architecture rather than a feature you add before launch. You cannot inspect quality into a product for the same reason you cannot inspect throughput into a database — both are consequences of decisions made upstream of the moment you measure them.
Three consequences follow, and this paper develops each.
First, defect origin matters more than defect count. Two teams reporting forty escaped defects per quarter can be in radically different states of health. If thirty-two originated in ambiguous requirements, the correct intervention is a specification protocol, not more regression tests. Chapter 2 introduces the Defect Origin Framework, which reclassifies defects by where they were created rather than where they were caught, and turns that classification into an investment signal.
Second, quality controls have placement economics. Every control — a static analysis rule, a contract test, a canary gate, an architecture review — has a cost, a detection probability, and a latency. Placing a control at the wrong lifecycle stage is not merely inefficient; it is often net-negative, because a slow, low-yield gate imposes a permanent tax on delivery in exchange for information that would have been cheaper to obtain elsewhere. Chapters 3 and 9 develop the placement logic.
Third, quality must be measured as an index, not a metric. Single metrics are trivially gameable and structurally misleading. Test coverage rewards writing tests against code that is easy to test. Defect counts reward not looking. Chapter 11 introduces the Engineering Quality Index (EQI), a composite of nine measurable sub-indices designed so that gaming any one component degrades another.
The paper then addresses the discontinuity that most quality organizations are currently unprepared for. Deterministic systems permit binary assertions: given input X, output Y, else fail. Probabilistic systems — LLM-backed features, retrieval pipelines, agentic workflows, ranking and recommendation surfaces — do not. Their correct behavior is a distribution, not a value. A quality function built on binary assertion cannot evaluate a distribution, which is why so many organizations shipping AI features have discovered that their entire test automation investment is structurally inapplicable to their newest and most reputationally exposed surface. Chapter 12 develops the evaluation model these systems actually require.
Finally, the paper is opinionated about where this discipline is heading. The trajectory of the last thirty years — from inspection, to assurance, to engineering, to continuous quality — is a trajectory of authority migration. Quality decisions have moved steadily closer to the point where the decision that creates the defect is made. The endpoint of that migration is not a larger QA department. It is an engineering organization in which quality reasoning is a normal part of technical judgment, supported by a small, senior quality engineering function whose product is not test cases but leverage: frameworks, gates, evaluation harnesses, risk models, and the organizational memory of how this system fails.
Testing verifies quality. Engineering creates it. The remainder of this paper is about how to build an engineering system where that is structurally true rather than aspirationally stated.
Chapter 1 — The Evolution of QA: Five Eras of Quality Authority
Most treatments of QA history describe changing practices. That framing obscures the actual variable. What has changed across five decades is not primarily technique but the Locus of Quality Authority — the point in the organization where decisions that determine quality are actually made, and the distance between that point and the point where quality is verified.
Every dysfunction described later in this paper is a symptom of a large gap between those two points.
Era 1 — Traditional QA (Inspection)
Quality is a downstream inspection function. A separate team receives a build, executes scripted cases, and files reports. Authority sits entirely with engineering and product; QA has veto influence at best, exercised late, when the cost of acting on it is highest.
The defining property of this era is information latency: a defect created in week two is discovered in week eleven. The organization is not incapable of learning; it is simply learning too slowly for the learning to change anything.
Era 2 — Quality Assurance (Process)
QA gains process authority. Entry and exit criteria, test plans, traceability matrices, defect taxonomies, formal sign-off. This is a genuine advance — for the first time, quality has a defensible position in planning conversations — but the authority is procedural, not technical. QA can block a release; it cannot improve an architecture.
This era produces the most durable misconception in the field: that quality is a governance artifact rather than an engineering outcome. Organizations that never left this era can be identified by a simple test — their quality documentation is more detailed than their quality instrumentation.
Era 3 — Quality Engineering (Technical)
QA becomes a technical discipline. Quality engineers write code, own frameworks, build test infrastructure, and participate in design. Authority becomes technical: the ability to influence a decision by demonstrating a failure mode rather than citing a policy.
The critical shift is that quality work becomes an engineering asset with its own lifecycle, dependencies, and maintenance burden — which is also when the first automation debt crises appear (Chapter 7).
Era 4 — Continuous Quality (Systemic)
Quality signals become continuous and embedded in delivery. Gates run per-commit, environments are ephemeral, production telemetry feeds back into test design, and release decisions become data-driven rather than ceremonial. Authority becomes systemic: the pipeline enforces standards independent of individual judgment.
The corresponding risk is over-gating — an accretion of controls, each individually justified, that collectively make delivery slow enough to encourage bypass. A gate that teams routinely override has negative value: it costs time and provides false assurance.
Era 5 — AI-Aware Quality Engineering (Probabilistic)
Systems become non-deterministic in their core behavior, and the quality function must reason about distributions, drift, evaluation datasets, guardrail effectiveness, and acceptable failure bands. Simultaneously, AI-assisted development changes the production side of the equation: code volume rises, and the marginal cost of writing a plausible-looking implementation falls faster than the marginal cost of verifying it.
This produces the defining asymmetry of the current era: generation capacity is scaling faster than verification capacity. Organizations that respond by generating more tests with the same tools have misread the problem. The constraint is not test quantity; it is the ability to establish confidence in behavior that no longer has a single correct answer.
Comparative view
| Dimension | Traditional QA | Quality Assurance | Quality Engineering | Continuous Quality | AI-Aware QE |
|---|---|---|---|---|---|
| Primary question | Does it work? | Did we follow process? | How do we build it right? | How do we know continuously? | How do we bound behavior? |
| Locus of authority | None (advisory) | Procedural | Technical | Systemic | Statistical |
| Defect discovery latency | Weeks | Days | Hours | Minutes | Continuous + post-hoc |
| Primary artifact | Test cases | Test plans | Frameworks | Pipelines & gates | Eval suites & guardrails |
| Correctness model | Binary | Binary | Binary | Binary + risk-weighted | Probabilistic bands |
| Failure of the era | Too late | Too bureaucratic | Too tool-centric | Too gated | Too confident |
| Cost driver | Manual execution | Documentation | Framework maintenance | Pipeline time | Evaluation data |
The point of the table is the second row. Every other difference follows from where authority sits. An organization that adopts Era 4 tooling while retaining Era 1 authority — a common and expensive configuration — gets fast, continuous, automated confirmation that decisions made without quality input were flawed.
Chapter 2 — Where Bugs Actually Begin: The Defect Origin Framework
Defect tracking systems are almost universally organized around discovery: which environment, which test, which sprint, which severity. This is operationally useful and analytically worthless. Discovery data tells you where your detection is working. It tells you nothing about where your engineering is failing.
The Defect Origin Framework (DOF) reclassifies every defect by the decision that made it possible.
The nine origin classes
1. Business misunderstanding. The software correctly implements an incorrect model of the domain. Tax rules, entitlement logic, clinical workflows, settlement timing. These defects are invisible to every form of testing that derives its oracle from the specification, because the specification is the defect. They are typically discovered by users, in production, at maximum cost.
2. Requirement ambiguity. The specification permits multiple valid readings, and different components chose differently. The classic signature is an integration defect where both sides believe they are correct — and both are, relative to the text.
3. Architectural decision. A structural choice that makes a class of defects possible: shared mutable state across service boundaries, synchronous coupling in a partially-available system, a schema that makes invalid states representable, missing idempotency in an at-least-once delivery path. These generate defect families, not defects. Fixing instances is futile; the origin must be addressed.
4. Communication gap. Information existed but did not reach the person who needed it. A changed contract communicated in a thread. A migration decision made in a meeting one team missed. These defects correlate with organizational topology far more strongly than with technical complexity.
5. Documentation deficit. Behavior that is knowable only by reading source code or asking a specific individual. Manifests as integration errors, incorrect operational response during incidents, and a measurable increase in defect rate when the individual holding the knowledge changes teams.
6. Technical shortcut. A deliberate deviation from a known-correct approach under schedule pressure. These are distinct from all other classes in one important respect: at creation time, someone knew. Which makes them the only class that is fully preventable by disclosure discipline rather than by capability improvement.
7. Deployment risk. Defects introduced by the act of shipping rather than the content shipped: migration ordering, version skew between services, rollout sequencing, cache invalidation timing, rollback paths that were never exercised. The code is correct in every environment except the one that matters, transiently.
8. Configuration. Behavior determined by values rather than logic: feature flags, environment variables, IAM policy, resource limits, timeout and retry values, connection pool sizing. Configuration is the least-tested executable surface in most systems and a disproportionate contributor to severe incidents, because configuration changes typically bypass the entire quality apparatus applied to code.
9. Human factors. Fatigue, context switching, on-call load, unfamiliarity with a codebase, review performed at the end of a long day. Not a moral category — an engineering one. Systems that require sustained human vigilance to remain correct are badly designed systems.
Origin distribution and the investment signal
The framework's operational value comes from measuring the distribution. A representative pattern from mature enterprise systems — presented as an illustrative baseline to be replaced by your own measurement, not as a benchmark:
| Origin class | Share of escaped defects | Detectable by functional testing | Cost multiplier vs. prevention |
|---|---|---|---|
| Business misunderstanding | 12–18% | Rarely | 40–100× |
| Requirement ambiguity | 18–25% | Partially | 15–40× |
| Architectural decision | 10–15% | Rarely (as class) | 50–200× |
| Communication gap | 8–12% | Partially | 10–25× |
| Documentation deficit | 5–8% | Rarely | 8–15× |
| Technical shortcut | 8–12% | Often | 5–12× |
| Deployment risk | 10–14% | Rarely in test envs | 20–60× |
| Configuration | 8–14% | Rarely | 15–50× |
| Human factors | 5–10% | Incidentally | 5–20× |
Read the second column. Between 55% and 70% of escaped defect volume originates in classes that functional testing is structurally poor at detecting — because the test derives its expected result from the same flawed understanding that produced the code, or because the defect only exists in a state (deployment, configuration, production topology) that pre-release testing does not reproduce.
This is the quantitative core of the paper's thesis. The dominant failure mode of quality investment is spending detection budget on origin classes that detection cannot address.
Origin attribution as a practice
Attribution should be a required field on every escaped defect and every incident postmortem, assigned during review rather than by the reporter, with a fixed protocol:
- Identify the earliest decision point at which a different choice would have prevented the defect.
- Classify that decision, not the code change that fixed it.
- Record whether a control existed at that point, and if so, why it did not fire.
- Aggregate monthly; treat the distribution as the primary input to quality investment planning.
Step 3 is the one most organizations skip, and it is the one that produces improvement. A control that exists but does not fire is a more urgent finding than a missing control, because it indicates the organization has already paid for something that does not work.
The reframe
Testing discovers defects. Engineering decisions create them. A quality organization that measures only the first has no feedback loop on the second — it can report faithfully on symptoms forever without ever affecting the disease. The Defect Origin Framework exists to close that loop.
Chapter 3 — Shift Left Is Only the Beginning: The Quality Everywhere Model
Shift Left was directionally correct and structurally incomplete. Its insight — that defects are cheaper to address earlier — is sound. Its implicit model is not: it treats the lifecycle as a line along which activities slide backward, which produces a predictable failure. Teams move testing earlier, discover that early testing cannot detect deployment, configuration, scale, or emergent production behavior, and conclude that Shift Left "didn't work."
It did not fail. It was applied to a linear model of a system that is actually a loop.
Quality Everywhere replaces the line with a closed cycle of eight stations, each with its own defect origin exposure, its own appropriate control types, and its own signal that feeds forward and backward.
                    ┌──────────────────────────────────────────┐
                    ↓                                          │
            [1] REQUIREMENTS                                   │
                    ↓                                          │
            [2] ARCHITECTURE                                   │
                    ↓                                          │
            [3] DEVELOPMENT                                    │
                    ↓                                          │
            [4] CODE REVIEW                                    │
                    ↓                                          │
            [5] CI/CD                                          │
                    ↓                                          │
            [6] PRODUCTION                                     │
                    ↓                                          │
            [7] OBSERVABILITY                                  │
                    ↓                                          │
            [8] CONTINUOUS LEARNING ────────────────────────────┘
The arrow from station 8 back to station 1 is the entire point. In Shift Left, production is the end of the process. In Quality Everywhere, production is the highest-fidelity source of information about how the system actually fails — and that information's destination is the requirements and architecture stations, not the test suite.
Control types by station
Quality controls come in three kinds, and the distinction determines correct placement:
- Preventive controls make a defect class impossible or difficult to create (type systems, schema constraints, architectural boundaries, specification protocols).
- Detective controls identify a defect after creation but before impact (static analysis, tests, gates, canary analysis).
- Corrective controls limit blast radius after impact (circuit breakers, feature flags, rollback, rate limiting, graceful degradation).
| Station | Dominant origin exposure | Preventive | Detective | Corrective |
|---|---|---|---|---|
| Requirements | Business, ambiguity | Specification protocol, example mapping | Testability review, adversarial reading | Rapid clarification loop |
| Architecture | Architectural, deployment | Constraint definition, invalid-state elimination | Design review, failure-mode analysis | Fault isolation design |
| Development | Shortcut, human factors | Types, linting, contracts, invariants | Unit/component/contract tests | Fast local feedback |
| Code review | Communication, shortcut | Ownership rules, review checklists | Risk-weighted human review | Revert discipline |
| CI/CD | Deployment, configuration | Immutable artifacts, config-as-code | Gates, regression, security scanning | Automated rollback |
| Production | Deployment, config, emergent | Progressive delivery, capacity headroom | Canary analysis, SLO burn alerts | Flags, circuit breakers, rollback |
| Observability | All (as feedback) | Instrumentation standards | Anomaly detection, RUM, error budgets | Guided incident response |
| Continuous learning | All (as origin correction) | Origin attribution, standards evolution | Trend and regression analysis | Systemic remediation programs |
The Quality Control Placement Matrix
Given a defect class, where should the control live? Two variables decide it:
Detection latency cost (how expensive is it for this class to be found one stage later?) and control cost (what does maintaining the control cost in engineering time and delivery latency?).
| Low control cost | High control cost | |
|---|---|---|
| High latency cost | Place early and always. Types, schema constraints, contract tests, config validation. Non-negotiable. | Place early with risk weighting. Architecture review, threat modeling, performance modeling. Apply proportional to blast radius, not to every change. |
| Low latency cost | Place wherever cheapest. Style, formatting, minor lint. Automate fully; never gate human attention on these. | Do not place. Detect in production. Rare, low-impact, expensive-to-reproduce conditions. Invest in observability and fast correction instead. |
The bottom-right quadrant is the one most organizations get wrong. There exists a category of defect for which building pre-release detection is more expensive than detecting and correcting it in production — rare timing conditions, unusual data shapes, third-party degradation, long-tail device behavior. The mature response is deliberate: instrument heavily, deploy progressively, correct quickly, and stop spending on a test environment that will never faithfully reproduce the condition.
This is not lowered standards. It is capital allocation. Every hour spent building a low-yield detective control is an hour not spent on a preventive control that eliminates a defect family.
Feed-forward and feed-back
Quality Everywhere requires two information flows that most organizations lack:
Feed-forward: each station passes explicit quality context downstream. Requirements pass risk classification and edge case inventory to architecture. Architecture passes failure domains and testability constraints to development. CI/CD passes change risk to progressive delivery. Without this, each station rediscovers the risk profile independently — or does not.
Feed-back: each station returns evidence upstream. Production returns real failure modes to requirements. Observability returns actual usage distribution to test design (the highest-value input to risk-based testing that most teams ignore in favor of guessing). Incidents return architectural constraints to design standards.
An organization can be measured on this directly: what percentage of test scenarios created in the last quarter were derived from production evidence rather than from specification reading? Below 20%, the loop is not closed.
Chapter 4 — QA Starts with Requirements: Specification as an Engineering Artifact
Requirements are executable. They are executed by human beings, in wetware, with no type checking and no compiler error on ambiguity. Every requirement that admits two readings is a race condition in the organization.
Quality engineering's role at this station is not to write requirements. It is to apply adversarial reading — the systematic search for readings that satisfy the text while violating the intent.
The ambiguity taxonomy
Six failure patterns account for most requirement-origin defects:
| Pattern | Signature | Adversarial probe |
|---|---|---|
| Unbounded quantifier | "users can upload files" | How many? How large? Concurrently? Which types? What happens at the boundary? |
| Undefined state transition | "the order is cancelled" | From which states? What if already shipped? Partially fulfilled? Mid-payment? |
| Implicit actor | "the record is updated" | By whom? With what authority? What if two actors act simultaneously? |
| Missing failure branch | "the system sends a notification" | And if delivery fails? Retries? How many? Idempotent? Visible to the user? |
| Temporal vagueness | "immediately", "in real time", "soon" | What is the numeric bound? Measured at which point? What happens when exceeded? |
| Unstated non-functional | any feature spec without NFRs | Under what load? What latency budget? What availability? What data retention? |
The pattern to note: none of these probes require domain expertise. They are mechanical. They can be applied by anyone trained to apply them, which makes requirement quality a capability that can be systematically installed rather than a talent that must be hired.
Specification by adversarial example
The most effective requirements practice observed in high-performing organizations is not documentation improvement. It is concrete example generation before implementation — and specifically, the generation of examples that the specification cannot resolve.
The protocol:
- Nominal path — one concrete example with real values, end to end.
- Boundary set — examples at every numeric, temporal, and cardinality edge.
- Adversarial set — three examples deliberately constructed to break the stated rule.
- Failure set — one example per external dependency failure.
- Resolution — every example the specification cannot answer becomes a required clarification before estimation.
Step 5 is the gate. The output is not a document; it is a count of unresolved examples, and that count is the single best leading indicator of downstream defect volume available to any organization.
The Requirement Clarity Index (RCI)
RCI = (E_resolved / E_total) × (1 - A_density) × C_coverageWhere:
E_resolved / E_total= proportion of generated examples the specification unambiguously answersA_density= ambiguity markers per 100 words (normalized, from the taxonomy above)C_coverage= proportion of acceptance criteria with defined failure behavior and at least one non-functional bound
RCI runs 0 to 1. Below 0.6, the specification will generate defects regardless of engineering quality downstream. Between 0.6 and 0.8, defects will concentrate at integration boundaries. Above 0.85, requirement-origin defects become a minor share of escape volume.
The measurement is worth more than the number. Teams that begin measuring RCI usually discover that clarity varies far more by author and feature type than by team — which converts an unfalsifiable complaint ("requirements are bad") into a targeted, addressable finding.
Non-functional requirements as first-class
The most reliable predictor of a costly late-stage architectural rewrite is the absence of numeric non-functional bounds in the original specification. Every feature specification should carry a minimum NFR block: expected and peak load, latency budget at p50/p95/p99, availability target, data volume growth, retention and deletion obligations, and the specific regulatory regime that applies.
The reason this belongs to quality engineering rather than architecture is timing. By the time architecture is engaged, the commitment has often already been made. NFRs must enter at specification, because they are frequently the input that changes what gets built.
Requirement review workflow
Draft specification
        ↓
Adversarial read (taxonomy applied) ──→ ambiguity list
        ↓
Example generation (nominal / boundary / adversarial / failure)
        ↓
Unresolved example count ──→ [ > threshold? ] ──→ return to author
        ↓ no
NFR block validated ──→ risk classification assigned
        ↓
Testability assessment (can this be verified? at what cost?)
        ↓
Specification accepted for estimation
The testability assessment deserves emphasis. A requirement that cannot be verified at acceptable cost is a defective requirement, and the correct time to discover that is before implementation — not during the release when someone asks how we will know it works.
Chapter 5 — Quality and Architecture: Designing Out Defect Families
Architectural defects are qualitatively different from all others: they do not produce bugs, they produce bug generators. A missing idempotency guarantee in an at-least-once messaging path does not create one duplicate-charge defect. It creates a permanent, renewable supply of them, one per consumer, forever, until the architecture changes.
This is why architecture is the highest-leverage station in the Quality Everywhere loop, and why quality engineering's involvement there returns more than its involvement anywhere else.
Testability as an architectural quality attribute
Testability is treated as a testing concern. It is not. It is an architectural property with the same standing as scalability or security, and it is determined almost entirely by decisions the quality function does not currently participate in.
Four architectural properties determine testability:
Observability of state. Can the system's internal state be inspected without invasive instrumentation? Systems that hide state behind side effects require integration testing for behavior that should be unit-testable.
Controllability of dependencies. Can external dependencies be substituted at a stable boundary? Systems with dependencies reached through deep call chains and static clients cannot be tested in isolation at any reasonable cost.
Determinism of behavior. Are time, randomness, ordering, and identity injected or ambient? Ambient non-determinism is the single largest source of flaky tests, and it is an architectural choice, not a test infrastructure problem.
Isolation of failure domains. Can a component fail without cascading? Systems without isolation cannot be tested for failure behavior, because inducing any failure induces all failures.
An architecture that scores poorly on these four will make its test suite expensive, slow, and flaky — permanently, regardless of tooling investment. Most flaky test crises are architecture problems presenting as tooling problems.
Invalid states and the strongest available control
The most powerful preventive control in software is making the defect unrepresentable. Ranked by strength:
- Impossible by type — the invalid state cannot be constructed (sum types over boolean flags, non-empty collections, validated wrapper types, phantom-typed state machines).
- Impossible by schema — the database rejects it (constraints, foreign keys, check constraints, exclusion constraints).
- Impossible by protocol — the API makes the sequence unexpressible.
- Rejected at boundary — validated on entry.
- Detected by test — found after creation.
- Detected in production — found after impact.
Every step down this ladder increases cost by roughly an order of magnitude. An organization spending heavily at levels 5 and 6 while having available options at levels 1–3 is misallocating capital, and the architecture review is where that is caught.
Architecture Quality Checklist
To be applied at design review, proportional to blast radius:
Scalability
- Load profile stated numerically, with growth trajectory and a defined breaking point
- Every unbounded collection, queue, and cache has an explicit bound and an overflow behavior
- Statefulness identified; horizontal scaling path defined or explicitly rejected
- Hot-partition and skew behavior analyzed for every sharded resource
Reliability
- Every external call has timeout, retry policy, backoff, and jitter defined
- Retry safety established: all retried operations idempotent, with idempotency key strategy
- Failure domains mapped; blast radius of each component failure documented
- Degraded mode defined per dependency — what still works when this is down?
- No unbounded synchronous dependency chains across availability boundaries
Maintainability
- Boundaries align to change frequency and ownership, not to nouns
- Contracts explicit and versioned; no shared mutable state across boundaries
- Migration path defined for every schema and contract change
- Deletion path defined — how is this decommissioned?
Security
- Trust boundaries enumerated; data classification assigned per store and transit path
- AuthN/AuthZ model stated per entry point, including service-to-service
- Secret lifecycle defined: issuance, rotation, revocation, audit
- Threat model completed for changes crossing a trust boundary
Performance
- Latency budget allocated across components, summing to the stated SLO
- N+1 and fan-out patterns identified in read paths
- Cache strategy includes invalidation correctness and stampede protection
- Backpressure defined at every producer/consumer boundary
Observability
- Instrumentation defined at design time, not retrofitted
- Correlation identifiers propagate across every boundary including async
- SLIs defined and measurable from telemetry that will actually exist
- Every failure mode in the design has a corresponding detectable signal
Testability
- Dependency substitution boundary identified
- Time, randomness, and identity injected rather than ambient
- Component testable without full environment instantiation
- Test data strategy defined, including production-shaped data
The Observability Contract
A design review artifact that pairs each identified failure mode with its detection:
| Failure mode | Signal | Instrumentation | Detection latency | Owner |
|---|---|---|---|---|
| Downstream latency degradation | p99 client-side latency by dependency | Histogram + trace | < 2 min | Service team |
| Silent data staleness | Freshness lag metric | Emitted per pipeline run | < 5 min | Data platform |
| Partial write on failure | Reconciliation mismatch count | Scheduled invariant check | < 15 min | Service team |
| Config drift | Applied vs. declared diff | Continuous reconciliation | < 1 min | Platform |
The rule: a failure mode without a corresponding row is an accepted blind spot, and must be recorded as such. This converts unknown risk into known, documented, owned risk — which is the only form of risk an organization can manage.
Chapter 6 — Quality During Development: The Developer Quality Surface
The development station is where the largest number of defects are created and where the cheapest controls exist. Yet it is also where quality engineering has the least traditional presence, for a structural reason: historically, QA received code rather than participating in its production.
The corrective concept is the Developer Quality Surface — the total set of quality signals a developer encounters between writing a line and merging it, evaluated by two properties: feedback latency and signal precision.
The latency ladder
| Control | Typical latency | Precision | Cost per finding |
|---|---|---|---|
| Type checker / IDE | < 1s | Very high | Near zero |
| Linter / formatter | < 5s | High | Near zero |
| Unit test (local) | 1–30s | High | Low |
| Static analysis (deep) | 30s–5m | Medium | Low |
| Component / contract test | 1–5m | High | Medium |
| Peer review | 1h–2d | Variable | High |
| Integration suite (CI) | 5–30m | Medium | Medium |
| E2E suite (CI) | 20–90m | Low | High |
| Manual exploratory | Hours | High (novel) | High |
| Production | Days+ | Definitive | Very high |
The engineering objective is explicit: push each defect class to the highest row it can be caught in. A defect class caught by E2E that could be caught by a contract test is costing the organization roughly two orders of magnitude more per detection, plus the compounding cost of a slower pipeline.
This produces a concrete, unglamorous, high-return activity that most quality organizations do not perform: periodically sampling recent CI and production failures and asking, for each, what is the highest row in this table that could have caught it, and what would it cost to move it there?
Static analysis tiering
Undifferentiated static analysis produces alert fatigue and gets disabled. Tier it:
- Tier 0 — Blocking, zero tolerance. Correctness-affecting: null safety violations, resource leaks, unchecked concurrency, injection-prone patterns, known-vulnerable dependencies. Non-negotiable, non-overridable without documented exception.
- Tier 1 — Blocking with expiring waiver. Complexity thresholds, coverage on changed lines, dependency freshness. Waivable with an expiry date and an owner.
- Tier 2 — Advisory. Style, structure suggestions, informational metrics. Never blocking. Never in the merge path.
The mistake to avoid is placing Tier 2 findings in a blocking position. It trains engineers to treat all findings as noise, which destroys the value of Tier 0.
Contract testing as the boundary control
In distributed systems, the highest-value test category is also the most under-adopted. Contract tests verify that a provider satisfies the expectations of its consumers, and they are cheap, fast, and precise — the properties E2E tests lack.
A functioning contract discipline requires four elements: consumer expectations expressed as executable artifacts; provider verification in the provider's own pipeline; a broker that makes the compatibility matrix visible; and a deployment gate that refuses to deploy a provider that would break a consumer currently in production.
The fourth element is the one that converts contract testing from documentation into a control. Without it, contract tests report incompatibility after it ships.
Test intent review
A practice with disproportionate return: review the test plan before the implementation, not the test code after it.
Before writing code, the engineer states — in three to six lines — what they intend to verify, at which level, and what they are deliberately not verifying. A quality engineer or peer responds. This catches the two most common test-design failures at the point where correction is free: testing the implementation rather than the behavior, and omitting the failure paths entirely.
The observed effect is not primarily better tests. It is better interfaces, because articulating what will be verified forces articulation of what the component actually promises.
Collaboration model
The productive relationship between developers and quality engineers is neither "QA tests what developers build" nor "developers do all their own testing." It is a division by control type:
- Developers own preventive and fast detective controls: types, invariants, unit and component tests, contract definitions.
- Quality engineers own systemic detective controls: test architecture, risk models, integration and end-to-end strategy, evaluation harnesses, production-derived scenario design.
- Both own the corrective path jointly with operations.
The quality engineer's product in this model is leverage, not coverage. A quality engineer who writes 200 tests has produced 200 tests. A quality engineer who eliminates a flakiness source affecting 40 engineers has produced considerably more.
Chapter 7 — Test Automation as an Engineering System
Test automation is software. It has architecture, dependencies, a maintenance burden, a failure mode, and a total cost of ownership. Organizations that treat it as a project — funded once, delivered, then expected to persist — reliably produce the same outcome: an initially valuable suite that degrades into an unreliable, slow, distrusted obstacle that is eventually bypassed and then abandoned.
The reframe: an automated test is not an asset. It is a position, held at ongoing cost, that pays out only when it detects a real defect.
Test value economics
V(test) = (P_detect × C_escape × F_exercise) − C_maintain − C_runtime − C_flakeWhere:
P_detect= probability this test catches a real defect in the covered pathC_escape= cost if that defect escapes to productionF_exercise= frequency the covered code actually changesC_maintain= annualized maintenance and update costC_runtime= pipeline time cost × execution frequency × engineers blockedC_flake= cost of false failures: investigation time, plus the compounding cost of eroded trust
Three consequences follow immediately.
Tests over stable code have low value. F_exercise near zero drives the whole first term to near zero while maintenance continues. Suites accumulate large numbers of these; they should be identified and deleted.
Flaky tests have negative value. C_flake is unbounded because trust erosion is not linear. A suite at 2% flake rate across 500 tests fails spuriously most runs, and at that point engineers rerun by default — which means the suite no longer gates anything while still consuming full cost.
Coverage is not the objective function. Coverage measures which lines executed, not which behaviors were verified. A suite can achieve 90% coverage while asserting almost nothing. Mutation testing — measuring whether tests actually fail when behavior changes — is a far better proxy, and organizations serious about automation health should track it on critical paths even if the full-suite cost is prohibitive.
Test architecture
Automation requires the same architectural discipline as production code, along four layers:
- Intent layer — expresses what is verified, in domain language, free of technical mechanism.
- Orchestration layer — composes actions and manages workflow.
- Interaction layer — the sole point of coupling to the system under test (selectors, clients, protocols).
- Infrastructure layer — environment, data, fixtures, execution, reporting.
The single most important rule: coupling to the system under test exists only in layer 3. When a UI or API changes, exactly one layer changes. Suites that violate this — where selectors appear in test bodies — have maintenance cost proportional to test count rather than to interface count, and that is the mechanism by which large suites become unmaintainable.
The flakiness protocol
Flakiness must be managed as an incident class, not tolerated as an environmental condition:
- Detect — track per-test pass/fail history; flag any test with non-deterministic outcome on identical commits.
- Quarantine within 24 hours — remove from the blocking path immediately. A flaky test in the gate is worse than no test.
- Assign an owner and a deadline — typically 5 working days.
- Root-cause by category — test-side (timing, ordering, shared state, poor waits), infrastructure-side (environment instability, data contention), or product-side (a real non-determinism defect).
- Delete on expiry — an unfixed quarantined test is removed, and the coverage gap is recorded as accepted risk.
Category 4 findings deserve emphasis: a meaningful fraction of "flaky tests" are correctly detecting genuine race conditions in the product. Organizations that reflexively fix the test are deleting their only signal about a real defect.
Automation strategy: what not to automate
An automation strategy that does not state exclusions is not a strategy. Do not automate:
- Behavior still in active design churn — the test will be rewritten before it detects anything.
- Paths where the oracle is subjective (visual aesthetics, content quality, usability) — use targeted human review.
- Rare conditions whose setup cost exceeds the escape cost — detect in production (Chapter 3's bottom-right quadrant).
- Anything better verified one level lower — the most common and most expensive violation.
The pyramid, corrected
The classic pyramid is widely taught and widely misapplied, because its axis is ambiguous. The useful formulation is not about test types but about the scope of the failure a test can localize:
| Level | Localizes failure to | Target share | Max acceptable runtime | Flake tolerance |
|---|---|---|---|---|
| Unit | A function or class | 60–70% | < 3 min total | 0% |
| Component | A module with substituted deps | 15–20% | < 8 min | < 0.1% |
| Contract | An interface between services | 5–10% | < 5 min | 0% |
| Integration | A subsystem with real deps | 5–10% | < 15 min | < 0.5% |
| End-to-end | The system (weakly) | 1–5% | < 25 min | < 1% |
The percentages are less important than the localization column. The reason E2E tests should be rare is not that they are slow. It is that when one fails, it tells you almost nothing about where the defect is — which converts every failure into an investigation.
Automation Health Score
AHS = (0.30 × Reliability) + (0.20 × Speed) + (0.20 × Maintainability)
+ (0.20 × Effectiveness) + (0.10 × Relevance)- Reliability = 1 − flake rate (weighted by blocking position)
- Speed = normalized against target pipeline duration
- Maintainability = 1 − (test-fix commits ÷ total test-touching commits)
- Effectiveness = mutation score on critical paths, or real-defect detection rate
- Relevance = proportion of tests covering code changed in the last two quarters
Below 0.6, the suite is a liability. Above 0.85, it is a genuine engineering asset. Track it as a first-class engineering metric, because unlike coverage, it cannot be improved by writing more tests — only by writing better ones and deleting bad ones.
Chapter 8 — Quality Beyond Functional Testing: The Non-Functional Risk Grid
Functional correctness is the quality attribute most easily verified and, in mature systems, least often the cause of severe incidents. Systems rarely fail because a calculation was wrong. They fail because they were slow under an unanticipated load, were unavailable during a dependency degradation, leaked data through an authorization gap, were unusable for a population that was never considered, or behaved unpredictably when a downstream service returned partial results.
These attributes are systematically under-tested because each requires distinct expertise, distinct tooling, and distinct timing — and because, unlike functional testing, no single team is obviously accountable for them.
The Non-Functional Risk Grid
Rather than testing all attributes equally, assess exposure per attribute and invest proportionally.
| Attribute | Primary risk question | Exposure driver | Earliest effective control | Failure signature |
|---|---|---|---|---|
| Performance | Does it meet latency budget at peak? | Traffic growth, data volume, fan-out depth | Latency budget at design | Gradual p99 degradation, then cliff |
| Scalability | What breaks first, and at what multiple of current load? | Growth rate, event spikes | Capacity model at design | Resource saturation, queue growth |
| Security | What is reachable by whom? | Data sensitivity, attack surface, regulatory regime | Threat model at design | Silent until disclosure |
| Resilience | What happens when each dependency degrades? | Dependency count, coupling type | Failure mode analysis at design | Cascading timeout, thread exhaustion |
| Reliability | Does it meet SLO over time? | User criticality, contractual commitments | SLO definition at requirements | Error budget burn |
| Accessibility | Is it usable by assistive technology? | Regulatory exposure, user base breadth | Design system + automated checks in CI | Legal exposure; silent user loss |
| Usability | Can users complete tasks without support? | Task complexity, user expertise | Prototype testing pre-implementation | Support volume, funnel drop-off |
| Compatibility | Which environments are actually supported? | Client diversity, API consumer count | Support matrix at requirements | Long-tail defect reports |
| Compliance | Can we evidence conformance? | Jurisdiction, data class | Control mapping at requirements | Audit finding, enforcement |
| AI behavior | Is output quality within acceptable bounds? | Autonomy level, user trust, harm potential | Evaluation suite before launch | Silent degradation, drift |
Performance: from testing to modeling
Load testing as commonly practiced — a scripted run before release against an environment unlike production — produces a number with unclear validity. Mature performance engineering is continuous and model-based:
- Budget allocation. The end-to-end latency SLO is decomposed across components at design time, so each team has a numeric target rather than a shared aspiration.
- Continuous micro-benchmarking. Critical paths benchmarked per-commit, alerting on regression percentage rather than absolute threshold — this catches the slow accumulation that annual load tests miss entirely.
- Production-shaped load profiles. Derived from real traffic distribution, including the skew and hot keys that synthetic uniform load never reproduces.
- Saturation discovery. Rather than confirming the system handles expected load, deliberately find the breaking point and the failure mode at that point. The valuable output is not "we handled 10k RPS" but "at 14k RPS the connection pool saturates and latency goes non-linear, and we degrade by shedding writes."
Resilience and chaos engineering
Chaos engineering is frequently adopted at the wrong maturity level, producing dramatic outages and organizational rejection. It has prerequisites, and a progression:
| Stage | Prerequisite | Practice | Output |
|---|---|---|---|
| 0 — Analysis | Architecture documented | Tabletop failure mode analysis | Failure inventory, blind spots |
| 1 — Component | Isolated environments | Dependency failure injection in test | Verified degraded modes |
| 2 — Staged | Full observability, rollback | Game days in staging with production-shaped load | Validated runbooks |
| 3 — Production, bounded | SLOs, error budgets, flags | Limited-blast-radius experiments during business hours | Real resilience evidence |
| 4 — Continuous | Automated abort on SLO burn | Continuous automated fault injection | Regression detection for resilience |
The rule that makes this safe: never run an experiment whose failure mode you have not already reasoned about and can abort. Chaos engineering is hypothesis testing, not vandalism. If you cannot state the hypothesis and the abort condition, you are not ready for the stage.
Accessibility and compliance as engineering constraints
Both are frequently treated as pre-release audits, which is the most expensive possible placement. Both are substantially preventable at the design system and control-mapping level: an accessible component library eliminates the majority of accessibility defects at the source, and a control map that connects regulatory obligations to specific technical controls and their evidence converts compliance from a periodic scramble into a continuously verifiable property.
The general principle, consistent throughout this paper: for any quality attribute, ask what the strongest available control is (Chapter 5's ladder) rather than what the most familiar test is.
Chapter 9 — Continuous Quality in CI/CD: Gate Economics and Release Confidence
A deployment pipeline is a sequence of bets. Each gate spends time and compute in exchange for a reduction in the probability of a bad release. Gates are therefore an investment portfolio, and like any portfolio, adding positions indiscriminately degrades returns.
Gate economics
NetValue(gate) = (P_catch × C_escape) − (T_gate × D_frequency × C_delay) − C_falsePositiveA gate is worth having when the expected escape cost it prevents exceeds the aggregate delivery cost it imposes. Two failure patterns follow:
Over-gating. Each gate is individually justified; collectively they push pipeline duration past the threshold where engineers stop waiting. Symptoms: routine gate overrides, "emergency" paths used non-emergently, batched releases (which increase per-release risk and destroy the diagnostic value of small changes). A pipeline that is bypassed provides negative assurance — it costs money and produces a false sense of control.
Uniform gating. Every change traverses every gate regardless of risk. A copy change and a payment-authorization change take the same 45-minute path. This is fair, simple, and economically wrong: it under-protects high-risk changes (which deserve more than the standard path) while taxing low-risk changes into batching.
Risk-based pipeline routing
Classify every change automatically, and route accordingly.
| Risk tier | Classification signals | Gate path | Deployment strategy |
|---|---|---|---|
| Low | Docs, copy, feature-flagged-off code, test-only changes | Fast path: build, unit, lint, security scan (~5 min) | Direct, auto-promote |
| Medium | Standard feature work within one service, no schema change | Standard: full unit + component + contract + integration (~15 min) | Canary 5% → 50% → 100%, automated analysis |
| High | Schema migration, auth path, payment path, cross-service contract change, config affecting >1 service | Extended: standard + targeted E2E + performance regression + security review | Canary 1% extended bake, manual promotion gate |
| Critical | Data migration, tenancy boundary, cryptographic change, third-party integration replacement | Extended + architecture sign-off + rehearsed rollback + dark launch where possible | Staged over days, explicit go/no-go per stage |
Classification should be derived automatically from the diff — paths touched, files matching risk patterns, schema directories, IAM and configuration files, dependency changes — with manual escalation always available and manual de-escalation never permitted without a named approver.
The gain is directional: low-risk changes get faster, high-risk changes get more scrutiny than a uniform pipeline would ever justify applying to everything.
Progressive delivery as the primary quality control
The most significant shift in release quality over the last decade is not better pre-release testing. It is the recognition that exposure control is a stronger quality mechanism than pre-release verification, because it works on the defect classes verification cannot reach: deployment, configuration, scale, and emergent behavior.
The elements, in dependency order — each requires the previous:
- Deployment decoupled from release (feature flags). Code ships dark; exposure is a separate, reversible decision.
- Progressive exposure (canary, percentage rollout, ring deployment). Blast radius is a controlled variable.
- Automated canary analysis. Comparison of canary against baseline on error rate, latency distribution, saturation, and business metrics — with automated abort. Manual canary watching does not scale and does not work at 3 a.m.
- Verified rollback. Rollback exercised regularly, not assumed. Includes the hard cases: schema changes (expand-migrate-contract, never destructive-in-place), stateful services, and in-flight work.
- Kill switches on external dependencies. Every third-party integration disableable without deployment.
Element 4 is the one most commonly assumed and least commonly verified. A rollback path that has never been executed is a hypothesis, and incidents are a poor time to test hypotheses.
The Release Confidence Score
Release decisions are frequently made on a mix of gate status and intuition. The Release Confidence Score (RCS) makes the reasoning explicit and, importantly, comparable across releases:
RCS = (0.20 × ChangeRiskInverse)
    + (0.20 × TestSignalQuality)
    + (0.15 × EnvironmentFidelity)
    + (0.15 × ObservabilityReadiness)
    + (0.15 × RollbackReadiness)
+ (0.15 × OperationalReadiness)| Component | Measured by | Score 1.0 | Score 0.3 |
|---|---|---|---|
| Change risk (inverse) | Diff size, risk-path touches, schema/config changes, coupling breadth | Small, isolated, flagged | Large, cross-cutting, schema + auth |
| Test signal quality | Pass rate, flake rate, mutation score on changed paths, contract verification | Green, zero flake, high mutation score | Green with reruns, unknown flake |
| Environment fidelity | Config, data shape, topology, dependency version parity | Production-equivalent | Partial-topology, synthetic data |
| Observability readiness | Instrumentation for the new behavior, alerts defined, dashboards ready | Signals defined and verified | Retrofit after incident |
| Rollback readiness | Rollback tested, migration reversible, flags in place | Verified this cycle | Assumed, untested |
| Operational readiness | Runbook, on-call informed, capacity headroom, no conflicting change window | Fully prepared | Ship-and-hope |
Thresholds: above 0.85, standard progressive rollout. 0.65–0.85, extended canary with explicit promotion gates. Below 0.65, the release proceeds only with a named accountable owner and a documented reason.
The score's value is not gatekeeping. It is that it makes the shape of a risky release legible: two releases scoring 0.7 may need entirely different mitigations, and the component breakdown says which.
Quality gates worth having
A defensible minimum set, in order:
| Gate | Blocks on | Placement |
|---|---|---|
| Build + type check | Any failure | Pre-merge |
| Unit + component tests | Any failure; no reruns permitted | Pre-merge |
| Coverage on changed lines | Below threshold (changed lines only, never total) | Pre-merge |
| Tier 0 static analysis | Any finding | Pre-merge |
| Dependency + secret scanning | Known-critical vulnerability, any secret | Pre-merge |
| Contract verification | Any consumer incompatibility | Pre-deploy |
| Migration safety check | Destructive or non-reversible operation | Pre-deploy |
| Performance regression | Regression above % threshold on critical paths | Pre-deploy (medium+) |
| Canary analysis | SLI deviation from baseline | Post-deploy, automated abort |
| Error budget check | Budget exhausted for the affected service | Pre-deploy |
Note the last: an error budget gate is the only control in the list that regulates release rate itself based on demonstrated reliability. It is the mechanism that converts reliability from an aspiration into a constraint with teeth.
Chapter 10 — Production Quality: The Highest-Fidelity Test Environment
Production is the only environment with real users, real data volume, real traffic distribution, real dependency behavior, real infrastructure, and real concurrency. Every other environment is a model of it, and every model omits the properties that cause the most expensive failures.
The mature position is not that pre-release testing is unnecessary. It is that production is a primary source of quality information, and treating it as merely the place where quality is consumed forfeits the best data the organization has.
The Production Learning Cycle
   PRODUCTION SIGNAL
   (telemetry, incidents, support, user behavior)
            ↓
   [1] DETECT — is something wrong, and how quickly did we know?
            ↓
   [2] DIAGNOSE — what is the mechanism?
            ↓
   [3] CORRECT — restore service (flag, rollback, mitigate)
            ↓
   [4] ATTRIBUTE — which defect origin class? (Chapter 2)
            ↓
   [5] LOCALIZE CONTROL — at which station could this have been prevented
            or detected earlier? What is the strongest available control?
            ↓
   [6] IMPLEMENT — install the control at that station
            ↓
   [7] VERIFY — did the control fire on a subsequent similar condition?
            ↓
   FEEDS BACK TO REQUIREMENTS / ARCHITECTURE / DEVELOPMENT
Steps 5 and 7 are where most organizations stop short. Postmortems commonly end at step 4 with action items that add a test — a detective control at a late station — rather than asking whether a preventive control at an earlier station was available. And almost no organization performs step 7, which means controls accumulate without any evidence they work.
Observability versus monitoring
The distinction is not semantic. Monitoring answers questions you anticipated. Observability lets you answer questions you did not. Systems fail in ways nobody predicted; a dashboard designed around predicted failures is useless precisely when it is most needed.
| Capability | Monitoring | Observability |
|---|---|---|
| Question type | Known-unknowns | Unknown-unknowns |
| Data model | Pre-aggregated metrics | High-cardinality events, traces |
| Investigation | Dashboard navigation | Arbitrary slicing by any dimension |
| Failure mode | The dashboard for this failure doesn't exist | Cost and cardinality management |
| Design timing | Retrofitted | Designed with the system |
The practical test: during your last severe incident, could engineers answer "which specific tenants, on which client version, in which region, hitting which code path, are affected?" without deploying new code? If not, the system is monitored but not observable.
The four signal classes
Production quality signal comes from four sources with different properties, and organizations typically over-weight the first:
System telemetry — metrics, traces, logs. High volume, low interpretation cost, but only detects failures the system knows about. Silent correctness failures — wrong data, wrong authorization outcome, wrong calculation — produce no telemetry anomaly at all.
Real user monitoring — actual client-side experience, including the long tail of devices, networks, and regions that no test environment covers. The only reliable source for genuine perceived performance.
Support and user reports — highest interpretation cost, lowest volume, and the only reliable detector of business-misunderstanding defects (Chapter 2, class 1), because those are exactly the defects where the system behaves as designed and the design is wrong. A quality organization that does not systematically mine support data is blind to its most expensive defect class.
Continuous verification — synthetic transactions and invariant checks running against production: reconciliation between systems that should agree, assertions that should always hold, critical-path synthetic journeys. This is the only class that detects silent correctness failures, and it is the most under-adopted of the four.
Production invariant checking
The highest-value under-adopted practice in production quality. For every business-critical invariant, run a continuous check:
- Sum of ledger entries equals account balance
- Every completed order has exactly one fulfillment record
- No user holds an entitlement without a corresponding active subscription
- Every emitted event has a corresponding processed record within the SLA window
- Search index document count matches source of truth within tolerance
Each check is cheap. Each detects a class of silent defect that no functional test suite will ever catch, because the defect emerges from concurrency, partial failure, and time — not from logic. When an invariant breaks, you have both a precise defect signal and a bounded blast radius.
Error budgets as the quality control loop
Error budgets close the loop between reliability and delivery rate. Define an SLO, derive the permitted unreliability, spend it on releases. When the budget is exhausted, release velocity is constrained until reliability is restored.
This is the only mechanism that makes the reliability/velocity tradeoff explicit, quantitative, and self-correcting — replacing a recurring political argument with an agreed policy. Its adoption is a reliable marker of Level 4 maturity (Chapter 17), because it requires an organization willing to be bound by its own measurements.
Chapter 11 — Measuring Software Quality: The Engineering Quality Index
Every single quality metric is gameable, and the gaming is usually unconscious. Coverage rewards testing easily-tested code. Defect count rewards not finding defects. Test count rewards writing redundant tests. Velocity rewards deferring quality work. Each is locally rational and globally destructive.
The Engineering Quality Index (EQI) addresses this with a composite designed so that improving any component by gaming degrades another. It is not a score for comparing teams — that use converts it into a target and destroys it — but an instrument for detecting directional change within a system over time.
EQI = (0.15 × DPE) + (0.12 × RSI) + (0.12 × AHS) + (0.12 × RCS)
    + (0.10 × RCI) + (0.10 × AQS) + (0.10 × TEI) + (0.10 × ORI) + (0.09 × UTS)
The nine sub-indices
1. Defect Prevention Effectiveness (DPE) — inverse of the escape rate, weighted by origin and severity.
DPE = 1 − Σ(escaped_defects × severity_weight × origin_weight) / total_defects_identifiedOrigin weighting is what makes this resistant to gaming: escapes from origin classes the organization has invested in preventing are weighted more heavily, so DPE degrades when installed controls fail to fire.
2. Regression Stability Index (RSI) — the proportion of production defects that are reintroductions of previously fixed behavior, inverted.
RSI = 1 − (regression_defects / total_production_defects)Below 0.85 indicates the organization does not retain learning — fixes are applied without controls that prevent recurrence. This is the single most diagnostic metric for whether the Production Learning Cycle is functioning.
3. Automation Health Score (AHS) — as defined in Chapter 7.
4. Release Confidence Score (RCS) — as defined in Chapter 9, averaged across releases in the period.
5. Requirement Clarity Index (RCI) — as defined in Chapter 4.
6. Architecture Quality Score (AQS) — composite of measurable architectural health:
AQS = (0.25 × testability) + (0.20 × coupling_health) + (0.20 × failure_isolation)
    + (0.20 × observability_coverage) + (0.15 × contract_maturity)
Where observability coverage is the proportion of identified failure modes with a corresponding row in the Observability Contract (Chapter 5), and contract maturity is the proportion of service boundaries under executable contract verification.
7. Testing Efficiency Index (TEI) — defects detected per unit of quality-engineering effort, weighted by detection stage.
TEI = Σ(defects_caught × stage_value_multiplier) / total_quality_effortStage multipliers reflect the cost avoided: development ~1.0, code review ~1.5, CI ~3, staging ~8, production ~30. A rising TEI means detection is moving earlier, which is the actual objective.
8. Operational Reliability Index (ORI) — composite of SLO attainment, MTTD, MTTR, change failure rate, and error budget burn stability. Note the inclusion of MTTD: organizations optimize recovery time while neglecting detection time, and undetected degradation is indistinguishable to users from unrecovered degradation.
9. User Trust Score (UTS) — the outward-facing signal: quality-attributed churn, quality-related support contact rate, task completion rate on critical journeys, and quality sentiment from user feedback channels.
UTS is the check on all others. An organization can improve eight sub-indices while UTS declines — which means it has become excellent at building the wrong thing correctly. That divergence is the most important pattern the index can surface.
Metric integrity rules
Four non-negotiable rules, without which the index will be corrupted within two quarters:
- Never use EQI or its components in individual performance evaluation. Goodhart's law is not a caution; it is a certainty.
- Publish the full component breakdown always. A composite reported without components hides exactly the information that makes it actionable.
- Track direction, not absolute value. Cross-team comparison is invalid; different systems have different achievable baselines.
- Re-derive weights annually. Weights encode current priorities. If they never change, they have stopped reflecting reality.
Metrics to stop reporting
| Metric | Why it misleads | Replace with |
|---|---|---|
| Total test count | Rewards redundancy, no relationship to risk coverage | Mutation score on critical paths |
| Total code coverage | Measures execution, not verification; rewards easy code | Coverage on changed lines + mutation score |
| Bugs found by QA | Rewards late detection; penalizes prevention | Defect Prevention Effectiveness |
| Test execution pass rate | Approaches 100% asymptotically and stops informing | Flake rate + real-defect detection rate |
| Automation percentage | Automating the wrong tests raises it | Automation Health Score |
| Defects per release | Confounded by release size and detection capability | Escape rate per unit of change, by origin |
Chapter 12 — AI Changes Quality Engineering: Evaluating Probabilistic Systems
The introduction of LLM-backed features, retrieval pipelines, and agentic workflows into production systems constitutes the most significant discontinuity in quality engineering since continuous integration — and most quality organizations are approaching it with tools that are structurally inapplicable.
The reason is precise. Traditional testing rests on a deterministic oracle: for input X, the correct output is Y, and any deviation is a defect. Probabilistic systems have no such oracle. For input X, there is a distribution of acceptable outputs, quality is graded rather than binary, the same input may yield different outputs across invocations, and the acceptability boundary is often a matter of judgment rather than specification.
An assertion framework cannot evaluate a distribution. This is not a tooling gap that better libraries will close; it is a category difference requiring a different quality model.
Deterministic versus probabilistic quality
| Dimension | Deterministic system | Probabilistic system |
|---|---|---|
| Correctness | Binary: matches expected | Graded: within acceptable band |
| Oracle | Specification | Rubric, reference set, human judgment, or model-as-judge |
| Repeatability | Same input → same output | Same input → distribution of outputs |
| Failure mode | Exception, wrong value | Plausible-but-wrong, silently degraded |
| Regression detection | Diff against expected | Statistical comparison across an eval set |
| Coverage meaning | Code paths executed | Input space and failure modes represented |
| Release criterion | All tests pass | Aggregate score above threshold; no critical-category regression |
| Post-deploy risk | Static until changed | Drifts with data, usage, and provider model updates |
The last row is the one that most surprises organizations. A deterministic system that passed its tests will behave identically next month. An LLM-backed feature can degrade without any change to your code — because the input distribution shifted, the retrieval corpus changed, or the provider updated the underlying model. Quality for these systems is not established at release; it is maintained continuously.
The evaluation stack
Five layers, in dependency order:
Layer 1 — Component evaluation (deterministic). The non-probabilistic scaffolding: prompt template rendering, tool-call schema conformance, output parsing, token limit handling, timeout and retry behavior, fallback paths. This layer is fully testable with conventional methods and is, in practice, the source of a large fraction of production incidents in AI features. Do not skip it because the interesting problems are elsewhere.
Layer 2 — Retrieval evaluation (for RAG). Evaluated independently of generation, because retrieval failures and generation failures require entirely different fixes. Measure precision and recall at k against a labeled set, chunk boundary quality, embedding drift as the corpus evolves, freshness and staleness, and permission correctness — the last being a security control, not a quality metric, since retrieval that surfaces documents a user cannot access is a data breach delivered in fluent prose.
Layer 3 — Generation evaluation. Scored against a curated dataset spanning nominal cases, boundary cases, adversarial inputs, and — critically — every failure observed in production. Scoring combines deterministic checks (format, schema, required elements, forbidden content), reference-based metrics where ground truth exists, model-as-judge with a published rubric, and periodic human review to calibrate the judge. Model-as-judge is indispensable at scale and unreliable without calibration: it must itself be evaluated against human agreement, and that agreement rate reported alongside every score.
Layer 4 — System evaluation. End-to-end task success for multi-step and agentic flows: task completion rate, step efficiency, recovery from tool failure, cost per completed task, and containment — whether the agent stayed within its intended action boundary. For agentic systems, the action boundary is the primary safety control, and it must be enforced by architecture (permissions, allow-lists, approval gates) rather than by instruction.
Layer 5 — Production evaluation. Continuous monitoring on live traffic: guardrail trigger rates, refusal and fallback rates, user-signal quality proxies (regeneration, edit, abandonment), latency and cost distributions, and drift detection against the eval baseline. A representative sample of production traffic should be scored continuously, not merely logged.
The evaluation dataset is the asset
The single most important realization for organizations building AI features: the evaluation dataset, not the prompt, is the durable engineering asset. Prompts are rewritten constantly. Models are replaced. Frameworks change. The curated, versioned, growing set of inputs with expected-behavior annotations is what allows any of those changes to be made safely.
Properties of a well-run eval dataset:
- Versioned and immutable per version, so scores are comparable over time
- Stratified across user segments, input types, difficulty levels, and languages
- Adversarially extended — injection attempts, ambiguous requests, out-of-scope queries, contradictory context
- Production-fed — every production failure becomes a permanent eval case, which is the mechanism by which the system stops repeating mistakes
- Held-out portion never used during prompt iteration, to detect overfitting to the eval set
Treat it as production data: reviewed, owned, access-controlled, and backed up. Most organizations discover its value at the moment they need to migrate models and find they have no way to know whether the new one is better.
Acceptance bands, not pass/fail
Release criteria for probabilistic systems take a different shape:
| Criterion type | Example | Failure action |
|---|---|---|
| Aggregate threshold | Mean quality score ≥ 0.82 on eval set v14 | Block release |
| Regression bound | No category degrades more than 3% vs. current production | Block release |
| Critical category floor | Safety, factual accuracy, and PII-handling categories ≥ 0.95 | Block release, no override |
| Variance bound | Score standard deviation within historical range | Investigate before release |
| Cost and latency bound | p95 latency and cost per request within budget | Block release |
The "no override" designation on critical categories matters. Aggregate improvement that masks degradation in a safety-relevant category is the characteristic failure mode of averaged evaluation, and the only defense is a floor that cannot be traded against the mean.
Guardrails as engineering controls
Guardrails are not prompt instructions. They are enforced controls outside the model:
- Input controls — injection detection, scope classification, PII detection and redaction before the model sees the request
- Output controls — schema validation, content policy classification, factual grounding checks against retrieved sources, forbidden-pattern detection
- Action controls — for agents: permission enforcement, allow-listed operations, spend and rate limits, human approval gates for irreversible actions
- Circuit breakers — automatic degradation to a deterministic fallback when guardrail trigger rates spike
Every guardrail must itself be evaluated: false positive rate (usable product degraded) and false negative rate (harm passed through). An unmeasured guardrail is a claim, not a control.
AI-assisted development and the verification gap
The second-order effect deserves separate treatment. AI coding assistance increases code production rate substantially. It does not increase review capacity, architectural coherence, or the organization's ability to reason about what it has built. The result is a widening gap between generation and verification.
The organizational response should be to strengthen exactly the controls that are independent of code volume: type systems and invariants that scale automatically, contract verification at boundaries, architectural constraints enforced by tooling, mutation testing to verify that the increased test volume actually verifies anything, and review practices weighted by risk rather than by diff size.
The failure response is to generate more tests with the same assistance that generated the code — producing a suite that confirms the implementation's behavior, including its defects, at scale.
Chapter 13 — Engineering Collaboration: Ownership Mapped to Defect Origin
"Everyone owns quality" is a slogan that reliably produces the opposite outcome, because ownership without specificity is diffusion of responsibility. The corrective is to assign ownership by defect origin class rather than by lifecycle phase — because origin is where prevention is possible.
| Origin class (Ch. 2) | Accountable | Contributing | Control the accountable party owns |
|---|---|---|---|
| Business misunderstanding | Product | Domain experts, Support, QE | Domain validation, example-based specification |
| Requirement ambiguity | Product + QE (joint) | Engineering, Design | RCI threshold before estimation |
| Architectural decision | Architecture / Tech lead | QE, Security, SRE | Design review with quality checklist |
| Communication gap | Engineering Manager | All | Contract-first changes, decision records |
| Documentation deficit | Owning team | QE, Support | Docs as a definition-of-done item |
| Technical shortcut | Tech lead | Engineering Manager | Disclosed debt register with expiry |
| Deployment risk | DevOps / Platform | Engineering, SRE | Progressive delivery, verified rollback |
| Configuration | Platform | Security, Engineering | Config-as-code, validation, drift detection |
| Human factors | Engineering Manager | All | Load management, review scheduling, automation of vigilance |
Two structural notes. First, QE is accountable for exactly one class and contributing to seven — which is the correct shape for a function whose product is leverage. An organization where QE is accountable for everything has recreated the inspection model with better tooling. Second, every row has a named accountable party. Rows with two or more accountable parties do not exist; joint accountability is how origin classes become nobody's problem.
Structural models
| Model | Structure | Best for | Failure mode |
|---|---|---|---|
| Centralized | Single QA org, assigned to projects | Regulated domains, heavy compliance evidence | Becomes a bottleneck and an inspection gate |
| Embedded | QE within each team, no central function | Small orgs, high team autonomy | Practice divergence, duplicated infrastructure, no career path |
| Platform + embedded | Central QE builds infrastructure and standards; embedded QEs apply them | Most organizations above ~60 engineers | Platform builds what teams don't need; requires product discipline |
| Guild | No dedicated QE; a cross-team community of practice owns standards | Very mature, high-capability engineering orgs | Depends on sustained voluntary energy; degrades under delivery pressure |
The platform-plus-embedded model is the default recommendation, with one condition that determines success: the central function must treat its internal offerings as products with users, adoption metrics, and a deprecation policy. Central quality platforms fail for the same reason internal platforms generally fail — they are built to a mandate rather than to a demand.
Interfaces that matter
- QE ↔ Security. Share the same threat inputs; separate the controls. Security defines what must be true; QE builds continuous verification that it remains true.
- QE ↔ SRE. SLOs are the shared contract. SRE owns the production signal; QE owns turning that signal into upstream control changes.
- QE ↔ Support. The most undervalued interface in the industry. Support holds the only reliable signal for business-misunderstanding defects. A structured monthly review of support themes, attributed by origin, is among the highest-return hours a quality organization can spend.
Chapter 14 — The Economics of Quality
Quality investment is capital allocation under uncertainty, and it is chronically mis-argued because the cost of prevention is visible and budgeted while the cost of defects is distributed, delayed, and largely unmeasured.
The cost gradient
Cost of resolution by the stage at which a defect is addressed, relative to resolution at its origin. Illustrative multipliers, consistent across decades of industry measurement:
| Resolution stage | Relative cost | Cost drivers |
|---|---|---|
| Requirements (origin) | 1× | Conversation, edit |
| Architecture | 3–5× | Design rework before implementation |
| Development | 8–12× | Implementation rework, re-review |
| Code review | 10–15× | Context switching, rework, re-test |
| CI / integration | 20–30× | Investigation, pipeline cycles, blocked engineers |
| Staging / release testing | 40–60× | Multi-team coordination, schedule risk |
| Production (contained) | 100–150× | Incident response, rollback, customer contact, remediation |
| Production (customer harm) | 500–1500×+ | Support load, churn, credits, regulatory exposure, brand |
The gradient's shape, not its precise values, is the argument: cost escalation is exponential in lifecycle position. Any control that moves a defect class one stage earlier returns roughly its own cost, and controls that move a class several stages earlier return multiples.
The prevention/detection portfolio
| Investment | Cost profile | Return profile | Payback | Risk |
|---|---|---|---|---|
| Requirements clarity protocol | Low, recurring | High — addresses 18–25% of escapes | 1–2 quarters | Perceived as slowing delivery |
| Architectural quality review | Medium, per-decision | Very high — eliminates defect families | 2–4 quarters | Scales poorly if applied uniformly |
| Type systems and invariants | High upfront, near-zero ongoing | Very high, permanent | 2–3 quarters | Language and legacy constraints |
| Contract testing | Medium | High at boundaries | 1–2 quarters | Requires cross-team coordination |
| Unit/component automation | Medium, ongoing | Medium-high; degrades without care | 2–3 quarters | Maintenance burden if poorly architected |
| E2E automation | High, ongoing | Low-medium; high flake exposure | 4–8 quarters or never | Highest failure rate of any investment |
| Progressive delivery | High upfront (platform) | Very high — reaches classes testing cannot | 2–4 quarters | Requires observability maturity first |
| Observability | High upfront + ongoing spend | High and broad | 2–4 quarters | Cardinality cost explosion |
| Production invariants | Low | High — only detector of silent failures | 1 quarter | Requires domain modeling |
| AI evaluation infrastructure | Medium-high | Necessary, not optional, for AI features | Immediate for AI surfaces | Dataset curation is the real cost |
The pattern worth noting: the two highest-cost, lowest-return lines in most organizations' actual spend — broad E2E automation and late-stage manual regression — are also the two most commonly funded, because they are the most legible to non-technical stakeholders. Reallocating from these to the top of the table is the highest-return move available to most quality organizations, and it is an organizational problem rather than a technical one.
Quality debt
Quality debt behaves like financial debt: it carries interest, and the interest is paid in delivery velocity.
Interest_period = (Σ defect_handling_hours + Σ flake_investigation_hours
                   + Σ rework_hours + Σ incident_hours) / total_engineering_hours
This ratio — the Quality Debt Service Ratio — is the most persuasive single number available to a quality leader, because it converts an abstract argument into a directly observed cost. Below 10%, healthy. 10–20%, meaningful drag with a clear investment case. 20–35%, the organization is substantially working for its own defects. Above 35%, feature delivery is effectively a side effect of maintenance, and no roadmap commitment made in this state is reliable.
The argument to make to a CFO
Not "quality is important." Rather: here is the percentage of engineering capacity currently consumed by defect handling; here is the origin distribution of the defects consuming it; here is the specific control that addresses the largest origin class; here is its cost and expected payback in recovered capacity. Quality investment framed as capacity recovery is fundable. Quality investment framed as risk reduction is discretionary — and discretionary budgets are cut first.
Chapter 15 — Enterprise Case Study: A Multi-Tenant SaaS Platform
A composite drawn from repeated engagement patterns. Metrics are illustrative placeholders demonstrating the shape of a transformation, not measured results from a single organization.
Context
A B2B SaaS platform, seven years old, 240 engineers across 22 teams, ~40 services, multi-tenant with enterprise contractual SLAs. Growth had been strong; ARR roughly doubled in eighteen months while headcount grew 60%.
Symptoms
Defect escape rate rising quarter over quarter despite QA headcount growth. Release cadence lengthened from weekly to bi-weekly to "when regression passes," typically 3–4 weeks. The E2E suite reached 2,800 tests and a 22-minute-to-4-hour runtime with a ~7% flake rate; engineers routinely reran until green. Three severity-1 incidents in one quarter, two caused by configuration changes that had bypassed every quality gate. Support ticket volume growing faster than customer count.
Diagnosis
Origin attribution over one quarter of escaped defects produced a distribution the organization had not anticipated: 24% requirement ambiguity, 17% deployment and configuration, 14% architectural, 12% communication gaps — and 19% functional logic errors, the only category the substantial test investment was well-positioned to catch. Roughly two-thirds of escape volume originated in classes the organization's entire quality spend was structurally unable to address.
Secondary findings: no production-derived test scenarios; environment fidelity low (synthetic data, partial topology); configuration changes deployed without review; rollback never exercised; four teams maintaining four incompatible test frameworks.
Intervention (three phases over eleven months)
Phase 1 — Stop the bleeding (months 1–3). Flaky test quarantine protocol; 640 tests quarantined in two weeks, 310 deleted outright. E2E suite reduced from 2,800 to 310 tests covering only revenue-critical journeys. Configuration brought under code review and validation. Rollback exercised on every service, uncovering four services that could not roll back at all.
Phase 2 — Move controls upstream (months 4–8). Requirements protocol with example generation and an RCI threshold before estimation. Contract testing across all 40 services with a deployment gate. Architecture quality checklist applied to all high-risk designs. Risk-based pipeline routing replacing the uniform path. Support data reviewed monthly with origin attribution.
Phase 3 — Close the loop (months 9–11). Progressive delivery with automated canary analysis. Observability contracts required at design review. Production invariant checks on billing, entitlement, and provisioning. EQI instrumented and reviewed monthly. Postmortems extended to steps 5–7 of the Production Learning Cycle.
Outcomes
| Metric | Before | After 11 months | Change |
|---|---|---|---|
| Defect escape rate (per 100 changes) | 14.2 | 4.1 | −71% |
| Requirement-origin escapes (share) | 24% | 9% | −15 pts |
| Deployment/config escapes (share) | 17% | 5% | −12 pts |
| E2E suite size | 2,800 | 310 | −89% |
| Suite flake rate | 7.0% | 0.3% | −96% |
| Pipeline duration (p50) | 74 min | 16 min | −78% |
| Release frequency | Every 3–4 weeks | 8–14 per week | ~30× |
| Change failure rate | 18% | 4.5% | −75% |
| MTTD (production issues) | 47 min | 6 min | −87% |
| MTTR | 3h 40m | 41 min | −81% |
| Severity-1 incidents / quarter | 3 | 0.5 (avg) | −83% |
| Quality Debt Service Ratio | 31% | 13% | −18 pts |
| QA headcount | 26 | 18 | −31% |
| EQI | 0.41 | 0.79 | +93% |
What actually produced the results
Three observations, ranked by contribution.
Deletion outperformed addition. The largest early gain came from removing 89% of the E2E suite. The suite was not detecting defects; it was consuming engineering attention and manufacturing distrust. Organizations consistently underestimate how much quality improvement is available from subtraction.
Requirements work produced the largest sustained reduction. The intervention with the lowest cost — a specification protocol requiring resolved examples before estimation — addressed the single largest origin class and required no tooling investment at all.
Headcount fell while quality rose. This is the counterintuitive but repeatable result, and the reason is structural: when quality work shifts from detection to prevention, the labor requirement changes shape. Detection scales with the number of things to check. Prevention scales with the number of decisions to influence — a far smaller and slower-growing number.
Chapter 16 — Twenty-Four Myths That Persist in Engineering Organizations
| # | Myth | Why it fails |
|---|---|---|
| 1 | QA owns quality | Quality is created by decisions QA does not make. Assigning ownership to the verification function guarantees the creation function optimizes for something else. |
| 2 | More testing means better software | Testing has diminishing returns per origin class. Beyond the point where detection is adequate, additional testing measures the same things again. |
| 3 | 100% automation is achievable | Exploratory, usability, and novel-condition testing have no automatable oracle. Chasing 100% automates the wrong things. |
| 4 | More test cases equal higher quality | Test count correlates with maintenance cost and pipeline duration. Its correlation with defect prevention is weak past a modest threshold. |
| 5 | Testing can compensate for poor requirements | Tests derive their oracle from requirements. Ambiguous requirements produce ambiguous tests that pass. |
| 6 | 100% code coverage means well-tested | Coverage measures execution, not assertion. A suite with no assertions can achieve full coverage. |
| 7 | Automation replaces manual testing | It replaces repetitive checking. It cannot replace investigative testing, which finds different defect classes entirely. |
| 8 | The test environment must mirror production | Impossible at scale and a poor use of budget. Fidelity should be targeted at properties that matter, with production itself used for the rest. |
| 9 | Shift Left solves quality | It relocates detection. Defect origins in deployment, configuration, and emergent behavior remain unreachable. |
| 10 | A green pipeline means it's safe to release | The pipeline verifies what it was built to verify. Confidence requires knowing what it does not cover. |
| 11 | Flaky tests are an environment problem | A meaningful share are genuine product race conditions. Reflexively stabilizing the test deletes the signal. |
| 12 | Fixing bugs faster improves quality | MTTR improvement is valuable and orthogonal to defect creation rate. Optimizing it alone builds a fast treadmill. |
| 13 | Quality slows delivery | Below Level 3 maturity it appears to. Above it, quality is the primary enabler of delivery speed — that is the entire DORA finding. |
| 14 | Senior engineers don't need QA involvement | Seniority reduces implementation defects. It does not address ambiguity, communication, configuration, or emergent behavior. |
| 15 | We'll add tests after we ship | Untested code that ships becomes untestable code, because tests were never a design constraint. |
| 16 | Performance testing belongs before release | By then the architecture is fixed. Performance is decided at design; testing only confirms the decision. |
| 17 | Security is the security team's job | Security teams define requirements. Every engineer creates or prevents vulnerabilities. |
| 18 | Accessibility is a compliance checkbox | It is a design system property. Retrofitting costs an order of magnitude more than building it in. |
| 19 | More QA headcount improves quality | Adding detection capacity to a system with high defect creation rate scales the symptom. Case study: headcount fell 31% as quality doubled. |
| 20 | Bug count is a quality metric | It measures detection capability confounded with creation rate. It falls when you stop looking. |
| 21 | Exploratory testing is unstructured | Structured exploratory testing uses charters, time-boxes, and coverage models. It is disciplined, not improvised. |
| 22 | Production issues mean QA failed | Some defect classes are cheaper to detect in production by design. The failure is undetected production issues, not detected ones. |
| 23 | AI will automate QA away | AI increases code volume faster than verification capacity. It raises the value of quality engineering, and shifts it toward evaluation design. |
| 24 | LLM features can be tested like normal features | Binary assertion cannot evaluate a distribution. Applying conventional tests to probabilistic systems produces false confidence in both directions. |
Chapter 17 — The QA Maturity Model
Maturity models fail when they describe practices, because organizations then adopt the practices without the underlying capability. This model is defined by what the organization can answer at each level.
| L1 — Reactive Testing | L2 — Structured QA | L3 — Quality Engineering | L4 — Continuous Quality | L5 — Engineering-Driven Quality | |
|---|---|---|---|---|---|
| Can answer | "Did it pass?" | "Did we cover the plan?" | "What is the risk of this change?" | "What is our confidence, continuously?" | "Where do our defects originate, and what did we change?" |
| Quality timing | After development | Planned phase | Throughout development | Throughout lifecycle | Before creation |
| QA role | Executes tests | Plans and governs | Engineers systems | Designs controls | Designs the system that produces quality |
| Automation | None or ad hoc | Scripted regression | Architected suite, layered | Risk-routed, health-monitored | Continuously pruned; value-measured |
| Requirements | Not involved | Reviews for testability | Improves clarity | RCI measured and gated | Specification quality is a tracked capability |
| Architecture | Not involved | Not involved | Consulted | Quality checklist in review | Testability and observability are stated constraints |
| Production | Out of scope | Incident reports received | Monitoring consumed | Observability drives test design | Origin attribution drives investment |
| Metrics | Bugs found | Coverage, pass rate | Escape rate, automation health | EQI composite | EQI + origin distribution trends |
| AI systems | Untested | Manually spot-checked | Ad hoc eval scripts | Versioned eval suites in CI | Continuous production eval, calibrated judges |
| Release decision | Sign-off meeting | Exit criteria met | Risk-assessed | Release Confidence Score | Error-budget-governed |
| Failure response | Fix the bug | Fix and add a test | Fix and improve the control | Fix, attribute, relocate the control | Fix, relocate, and verify the control fired next time |
| Escape rate trend | Unknown | Measured, flat | Declining | Declining with origin shift | Low, stable, with known residual |
| Typical debt ratio | 30–45% | 25–35% | 15–25% | 10–18% | < 10% |
Progression rules
L1 → L2 requires making quality work visible and planned. The trap is stopping here: L2 organizations often mistake documentation maturity for quality maturity.
L2 → L3 requires technical capability in the quality function. It cannot be achieved by process. It requires hiring or developing engineers, and it usually requires changing what the quality function is measured on — from defects found to defects prevented.
L3 → L4 requires platform investment: pipelines, environments, observability, progressive delivery. This is the most capital-intensive transition and the one most often attempted without the prerequisite of L3 technical capability, producing expensive tooling operated at L2 sophistication.
L4 → L5 is not a tooling transition at all. It requires that engineering decision-makers — architects, tech leads, product managers — internalize quality reasoning as part of ordinary technical judgment. The observable marker is that quality concerns are raised in design discussions by people who do not work in the quality function. At L5, the quality organization is smaller than at L3 and more senior, and its output is frameworks rather than findings.
Two rules govern movement. Levels cannot be skipped: L4 tooling deployed on an L2 organization produces continuous, automated, high-resolution reporting of an unmanaged defect creation rate. And maturity is per-capability, not per-organization: it is common and healthy to be L4 in automation, L2 in requirements, and L1 in AI evaluation. Assess each dimension separately; invest in the lowest, since quality is limited by its weakest station.
Chapter 18 — The Enterprise Quality Framework
Twelve pillars. Each defined by a governing question, a primary control, and a measurable signal. The framework's purpose is diagnostic: score each pillar 1–5 against the maturity model, and the shape of the resulting profile determines investment priority.
| # | Pillar | Governing question | Primary control | Signal |
|---|---|---|---|---|
| 1 | Requirements | Does the specification admit exactly one reading? | Example generation with resolution threshold | RCI |
| 2 | Architecture | Which defect families does this design make possible? | Quality checklist at design review; invalid-state elimination | AQS |
| 3 | Development | Is each defect class caught at the earliest feasible stage? | Types, invariants, contracts, tiered static analysis | Detection stage distribution |
| 4 | Automation | Is the suite an asset or a liability? | Test architecture, flakiness protocol, value-based pruning | AHS |
| 5 | CI/CD | Are gates placed where their economics are positive? | Risk-based routing; gate net-value review | Pipeline duration, override rate |
| 6 | Production | How fast do we know, and how fast can we undo? | Progressive delivery, verified rollback, invariant checks | MTTD, change failure rate |
| 7 | Observability | Can we answer questions we did not anticipate? | Observability contracts at design | Failure-mode coverage |
| 8 | Continuous learning | Do we relocate controls, or only fix defects? | Origin attribution; Production Learning Cycle steps 5–7 | Regression Stability Index |
| 9 | People | Do engineers have quality capability, not just quality process? | Capability development; test intent review; embedded QE | Quality issues raised by non-QE roles |
| 10 | Culture | Is disclosure of risk safe and normal? | Blameless postmortems; disclosed technical debt register | Time from defect awareness to disclosure |
| 11 | Metrics | Do we measure prevention or detection? | EQI with integrity rules | EQI trend + component divergence |
| 12 | Governance | Are quality decisions explicit, owned, and reversible? | Origin-based ownership map; documented accepted risks | Accepted-risk register currency |
Pillar 10 warrants emphasis because it is the only one that cannot be installed by tooling. The time between an engineer becoming aware of a risk and that risk being disclosed is the most sensitive available indicator of quality culture. In organizations where disclosure is costly, technical shortcuts (origin class 6) migrate from a manageable, registered category into an invisible one — and invisible shortcuts are the mechanism by which systems become unmaintainable without anyone deciding that they should.
Chapter 19 — QA Leadership Checklist: Forty Questions
Origin and measurement (1–6)
- What is our defect origin distribution, measured rather than assumed?
- What percentage of escapes originate in classes our testing cannot detect?
- What is our Quality Debt Service Ratio this quarter?
- Which controls exist but failed to fire on our last five significant escapes?
- What percentage of our test scenarios derive from production evidence rather than specification reading?
- Are any of our quality metrics used in individual performance evaluation?
Requirements (7–11) 7. What is the count of unresolved examples at the point specifications enter estimation? 8. Do our specifications carry numeric non-functional bounds, or adjectives? 9. Which specification authors produce the most downstream defects, and do they know? 10. Is testability assessed before implementation is committed? 11. How long does a clarification request take to resolve, on average?
Architecture (12–17) 12. Which of our current defect families are architectural in origin? 13. Is testability treated as an architectural quality attribute in design review? 14. For each identified failure mode, is there an owned detection signal? 15. Which invalid states are representable in our data model that need not be? 16. Which components cannot fail without cascading, and is that documented? 17. Are time, randomness, and identity injected or ambient in our services?
Development and automation (18–25) 18. What is our mutation score on critical paths? 19. What is our current flake rate, and are flaky tests quarantined within 24 hours? 20. How many tests in our suite cover code unchanged in the last two quarters? 21. Is coupling to the system under test confined to a single architectural layer? 22. Which defect classes are caught at a later stage than they could be, and what would moving them cost? 23. Are all service boundaries under executable contract verification with a deployment gate? 24. Is our static analysis tiered, and are advisory findings ever blocking? 25. What have we deleted from the test suite this quarter?
Pipeline and release (26–31) 26. What is the net value of our slowest gate? 27. How often are gates overridden, by whom, and is the reason recorded? 28. Does a low-risk change traverse the same path as a payment-path change? 29. When did we last execute a rollback in production, deliberately? 30. Is canary analysis automated with an abort condition, or watched by a human? 31. Can we state a Release Confidence Score for our last release, with components?
Production and learning (32–36) 32. What is our MTTD, and how does it compare to our MTTR? 33. Which business invariants are continuously verified in production? 34. Could we answer an unanticipated question during our last incident without deploying code? 35. Do our postmortems relocate controls, or only add tests? 36. Do we review support data monthly with origin attribution applied?
AI and organization (37–40) 37. Do we have a versioned evaluation dataset, and is a held-out portion protected from prompt iteration? 38. What is our model-as-judge agreement rate with human review, and when was it last calibrated? 39. Are our guardrails measured for false positive and false negative rates? 40. If our model provider silently updated the underlying model tomorrow, how long until we knew?
A leader unable to answer question 1 cannot answer any of the others meaningfully, because every subsequent question is an inquiry into a specific control, and control investment without origin data is guesswork with a budget attached.
Chapter 20 — Final Thoughts
The premise this paper set out to dismantle is that quality is a stage — something applied to software after it exists, by a function whose contribution is measured in defects found.
The evidence against it is structural rather than philosophical. Between 55% and 70% of escaped defect volume originates in classes that testing is poorly positioned to detect, because those defects are created by decisions — about domain understanding, about specification, about architecture, about deployment topology, about configuration — that occur long before any code is executed. An organization that responds to rising defect rates by adding detection capacity is treating a creation-rate problem with a detection-rate intervention, and will spend increasing amounts of money to receive the same bad news slightly sooner.
What replaces it is not a bigger quality organization. It is a differently-placed one. Every framework in this paper — origin attribution, control placement, gate economics, release confidence, the evaluation stack, the maturity model — serves a single purpose: moving the point at which quality is decided closer to the point at which it is created, and installing the strongest available control at that point rather than the most familiar one.
That shift has a consequence that leaders should anticipate, because it is counterintuitive enough to be resisted. A quality organization operating this way produces fewer findings. It runs fewer tests. It reports smaller numbers in every category historically used to demonstrate its value. The case study in Chapter 15 is not an anomaly: escape rate fell 71% while the end-to-end suite shrank by 89% and quality headcount fell by nearly a third. Subtraction is frequently the highest-return quality investment available, and it is almost never the one that gets funded, because deletion is difficult to present as progress.
The organizations that navigate this well share one characteristic. They have stopped asking whether the software passed, and started asking where their defects come from and what they changed about it. That question cannot be answered by a testing function. It requires a quality engineering discipline with technical authority, positioned upstream of the decisions that matter, measured on prevention rather than discovery, and equipped to reason about systems — increasingly probabilistic systems — whose correct behavior is a property of the whole rather than of any component.
Quality is not added before release. It is decided in every requirement that was left ambiguous or made precise, every architecture that made a failure mode possible or impossible, every gate placed where its economics work or where they do not, every production signal that changed an upstream control or was merely logged.
Testing verifies quality. Engineering creates it. The purpose of a modern quality function is to make sure the engineering that creates it is done deliberately.



