
Introduction
Speed, by itself, is not a strategy. An engineering organization that ships faster than it can operate safely is not accelerating — it is borrowing against its own future, and the interest rate is paid in outages, rollback cycles, and customer churn. The SaaS leaders who treat "we ship fast" as a competitive claim, without a parallel claim about stability, are usually one bad release away from a board-level incident review.
This is the core tension every engineering executive eventually confronts: velocity and reliability are not opposing forces to be traded off against each other — they are two readings on the same instrument panel, and elite organizations have learned to optimize both simultaneously. The instrument panel that makes this possible is a small set of metrics first identified through multi-year research into software delivery performance: Deployment Frequency, Lead Time for Changes, Change Failure Rate, and Mean Time to Recovery — collectively known as the DORA metrics.
Industry research spanning hundreds of thousands of survey responses across years of analysis has consistently found that elite-performing organizations deploy on demand — often many times per day — recover from incidents in under an hour, and keep change failure rates in the single digits, while low performers deploy monthly or less, take weeks to recover from failure, and fail on nearly half of their changes. The gap between these two populations is not a difference of degree. It is a difference of operating model, and it shows up directly in revenue growth, market responsiveness, and talent retention.
What makes DORA metrics valuable to a CTO is not that they measure DevOps practice — plenty of internal dashboards do that. It is that they translate engineering behavior into a vocabulary the rest of the executive team already speaks: throughput, risk, recovery, and quality. A VP of Sales understands "we can ship a customer-requested fix in hours, not weeks." A CFO understands "our failure rate dropped, so our incident-related revenue exposure dropped with it." A board understands "our delivery capability is now a competitive asset, not a liability." This article is written for that audience — leaders who need to manage engineering as a business function, not merely operate it as a technical one.
We will not explain DORA metrics as a checklist for engineers to implement. We will explain them as an operating system for executives to govern by: how to read them, how to set targets by team size and maturity stage, how to diagnose bottlenecks before they become incidents, how to build a scorecard that survives a board meeting, and how to avoid the measurement mistakes that turn a useful framework into a source of organizational distrust.
Why Engineering Teams Need Objective Metrics
Every engineering organization already has an opinion about how it's performing. The problem is that opinions don't scale, don't compare across teams, and don't survive contact with a board deck. "We're moving pretty fast" is not a data point — it's a sentiment, shaped by whoever spoke most recently, most confidently, or most loudly in the leadership meeting.
Opinion vs. data. Sentiment-based engineering management tends to be recency-biased: a single dramatic outage colors leadership's view of the whole quarter, while months of quietly elevated lead times go unnoticed because no one event made it visible. Metrics correct for this by aggregating signal over time, independent of who is in the room.
Engineering visibility. Without objective metrics, the only visibility executives have into delivery performance comes through anecdote — a customer escalation, a missed deadline, an engineer's offhand comment in a town hall. DORA metrics convert delivery performance into something that can be reported on a cadence, trended over quarters, and compared against industry benchmarks.
Delivery predictability. Sales and product teams make commitments to customers based on an assumed engineering capability. If that capability is unmeasured, those commitments are guesses. Lead Time for Changes alone allows a VP of Product to know, with evidence rather than hope, how long a roadmap commitment will actually take to reach production.
Business alignment. The ultimate purpose of measuring engineering is not to monitor engineers — it's to align engineering investment with business outcomes. A metrics framework that can't be explained to a CFO in one sentence has failed at this job. DORA metrics pass that test.
Comparison: Opinion-Based vs. Metrics-Based Engineering Management
| Dimension | Opinion-Based Management | Metrics-Based Management (DORA) |
|---|---|---|
| Basis for decisions | Anecdote, recency bias, loudest voice in the room | Trended, aggregated delivery data |
| Comparability across teams | Not possible — every team's "fast" means something different | Standardized definitions enable apples-to-apples comparison |
| Response to incidents | Reactive, driven by visibility of the specific failure | Proactive, driven by trend deviation before failure becomes visible |
| Communication to the board | Qualitative narrative, difficult to defend under scrutiny | Quantitative trend lines with industry benchmarks |
| Investment prioritization | Driven by whoever advocates most effectively | Driven by where the data shows the biggest constraint |
| Talent retention signal | Invisible until attrition spikes | Developer experience and toil are visible leading indicators |
| Customer commitment accuracy | Best guess from senior engineers | Statistically grounded lead time data |
The Four DORA Metrics
Each of the four metrics answers a distinct executive question. Together, they answer the only question that ultimately matters: can this organization deliver value to customers quickly, safely, and repeatably?
Deployment Frequency answers: how often does this organization successfully release value to production? This is the throughput metric. It is not a measure of busyness — a team that deploys fifty times a day but ships nothing customers notice has high frequency and low value. But at the population level, deployment frequency correlates strongly with an organization's ability to respond to market signals, customer feedback, and competitive pressure within days rather than quarters.
Lead Time for Changes answers: how long does it take from a code commit to that code running safely in production? This is the friction metric. It captures everything that slows a team down between "the work is done" and "the customer can use it" — code review queues, approval bureaucracy, manual testing cycles, deployment gatekeeping. Short lead time is a proxy for organizational agility: it means the distance between deciding to do something and having it done is small.
Change Failure Rate answers: what percentage of changes to production result in degraded service, requiring remediation? This is the quality metric, but it should be read as a risk metric by executives. A high change failure rate doesn't just mean bugs — it means every release is a roll of the dice on customer trust, support load, and engineering time diverted from new work to firefighting.
Mean Time to Recovery (MTTR) answers: when something does fail, how long until service is restored? This is the resilience metric. No organization — however disciplined — eliminates failure entirely. What separates elite organizations is not the absence of failure but the speed and confidence with which they recover from it. MTTR is, in a real sense, the metric that determines how much failure an organization can tolerate without it becoming a business event.
The critical executive insight is that these four metrics must be read together, never individually. A team can inflate Deployment Frequency by shipping trivial changes constantly while Lead Time and Change Failure Rate quietly degrade. A team can drive Change Failure Rate to zero by freezing releases — which destroys Deployment Frequency. The four metrics function as checks on each other; that is precisely what makes them resistant to gaming and trustworthy as an executive instrument.
Comparison Table: The Four DORA Metrics
| Metric | Executive Question | What It Reveals | What Gaming It Looks Like | Primary Owner |
|---|---|---|---|---|
| Deployment Frequency | How fast can we move? | Organizational throughput and batch size discipline | Shipping trivial commits to inflate counts while real work queues up | Engineering leadership, Platform |
| Lead Time for Changes | How much friction exists between decision and delivery? | Process efficiency, approval bureaucracy, automation maturity | Excluding "in progress" work from the clock, redefining "start" | Engineering Directors, Product |
| Change Failure Rate | How much risk does each release carry? | Testing discipline, release quality, architectural blast radius | Reclassifying incidents as "non-change-related" to avoid counting them | QA/Release leadership, SRE |
| Mean Time to Recovery | How resilient is the organization when things break? | Incident response maturity, observability, rollback capability | Closing incidents early before full service restoration is confirmed | SRE, Incident Command |
The Engineering Pulse Monitor
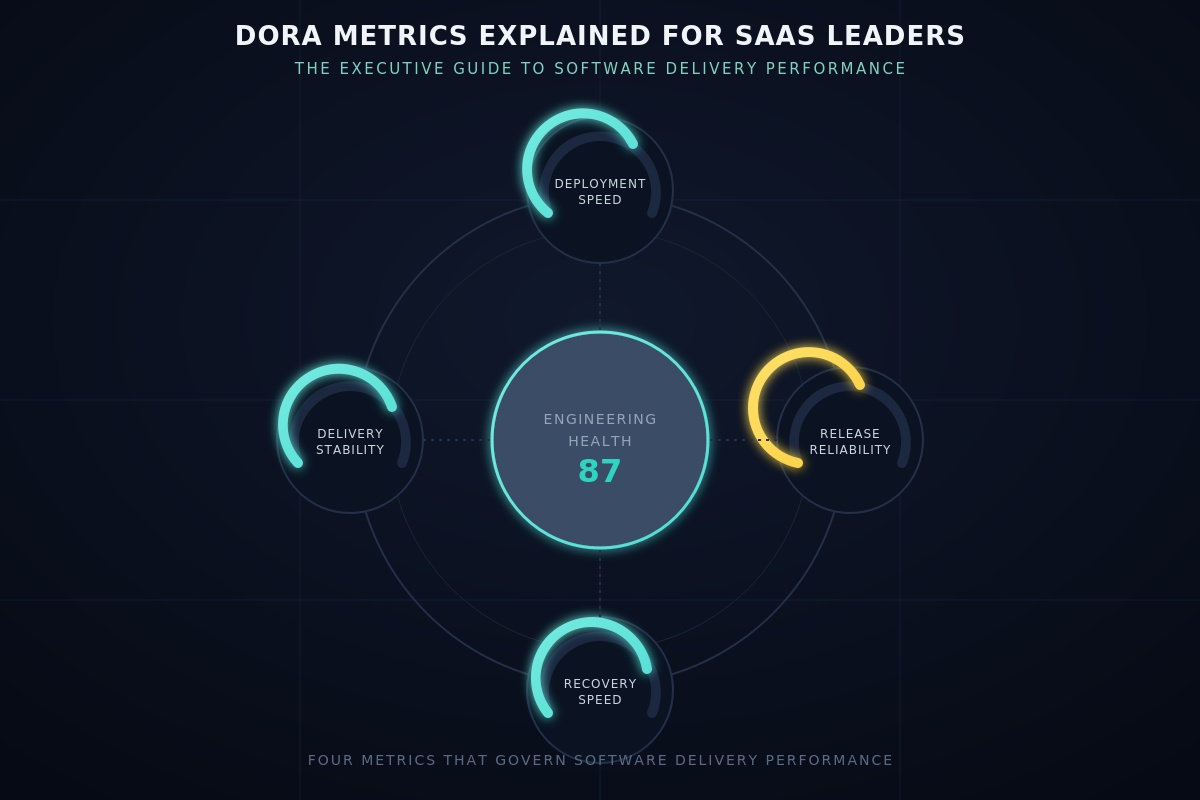
Picture a circular instrument panel — not a chart, an instrument panel, the kind found in a cockpit or a hospital monitoring station. At its center sits a single composite reading: Engineering Health. Around it, four arced gauges, positioned like the cardinal points of a compass:
- North — Deployment Speed (driven by Deployment Frequency)
- East — Release Reliability (driven by Change Failure Rate)
- South — Recovery Speed (driven by Mean Time to Recovery)
- West — Delivery Stability (driven by Lead Time for Changes)
Each gauge fills along an arc from "Cold" (empty, red) through "Elite" (full, bright teal). The visual power of this instrument is that no single gauge can be pushed to full without the others noticing. If Deployment Speed surges north while Release Reliability collapses east, the composite center reading drops — the dashboard visually punishes velocity-without-safety the same way a real cockpit punishes engine output without fuel efficiency.
For an executive audience, the Pulse Monitor reframes engineering health the way a vitals monitor reframes patient health: you do not ask "is the patient fine?" — a single, unreliable, sentiment-laden question. You ask "what is heart rate, blood pressure, oxygen saturation, and temperature, each independently, and how do they move together?" The Engineering Pulse Monitor gives a CTO the same instrument: four independent vitals, one composite read, and a visual language that makes degradation visible before it becomes an incident.
In practice, this dashboard belongs on a screen in the engineering leadership's weekly sync — not because the underlying numbers change weekly, but because the discipline of reading it weekly is what prevents slow drift from becoming a quarter-ending surprise.
How DORA Metrics Influence Business Growth
Executives don't fund engineering metrics programs because metrics are intrinsically interesting. They fund them because delivery performance is a lever on revenue — and the connection between the two is direct enough to draw as a closed loop. Call it the Business Growth Flywheel:
   Engineering Performance
            ↓
      Faster Releases
            ↓
  Better Customer Experience
            ↓
       Revenue Growth
            ↓
        Investment
            ↓
    Better Engineering
            ↓
   (returns to Engineering Performance)
Engineering Performance → Faster Releases. When Lead Time for Changes is short and Deployment Frequency is high, the organization's capacity to act on decisions — not just make them — increases. A roadmap is only as good as the speed with which it can be shipped.
Faster Releases → Better Customer Experience. Customers experience speed as responsiveness: bugs fixed in days instead of sprints, requested features shipped while still relevant, competitive gaps closed before they become competitive losses. Low Change Failure Rate ensures that this speed doesn't come at the cost of reliability the customer also experiences directly.
Better Customer Experience → Revenue Growth. Retention, expansion, and referral all correlate with experienced reliability and responsiveness. In subscription businesses especially, the cost of a bad release is not just the incident — it's the renewal conversation six months later that opens with "remember when..."
Revenue Growth → Investment. Growth justifies further investment in engineering capacity, tooling, and headcount — but only if leadership can demonstrate that prior investment converted into delivery performance. This is where DORA metrics become a budget defense mechanism: they are the evidence that engineering spend produced measurable capability, not just headcount growth.
Investment → Better Engineering. Reinvested capital, deployed correctly, improves automation, reduces toil, and strengthens the platform — which is precisely what improves the four DORA metrics in the next cycle.
Better Engineering → Engineering Performance. The loop closes, and — critically — it closes at a higher baseline than where it started. This is the difference between a flywheel and a static cycle: each rotation should leave the organization measurably better positioned than the rotation before.
The strategic implication for a CTO is that DORA metrics are not a cost center reporting tool — they are the connective tissue that lets engineering performance be argued, in board terms, as a revenue driver rather than an operating expense.
The Engineering Velocity Timeline
Lay the software delivery lifecycle out horizontally, left to right, as a single continuous timeline — not a pipeline diagram with boxes and arrows, but a flow of time with named waypoints:
Idea → Planning → Development → Code Review → Testing → Deployment → Monitoring → LearningEach waypoint is where a different DORA metric exerts its greatest leverage:
Idea. No DORA metric applies directly here, but the discipline of small, well-scoped ideas determines batch size downstream — and batch size is the single biggest hidden driver of Lead Time.
Planning. Lead Time for Changes begins its clock conceptually here in mature organizations: the moment work is committed to, the delay-accumulation process starts. Poor planning discipline (oversized tickets, unclear acceptance criteria) is one of the most common silent inflators of Lead Time.
Development. Deployment Frequency is shaped here by trunk-based development practices versus long-lived feature branches. Long branches mean infrequent, large merges — the opposite of the small-batch behavior elite performers exhibit.
Code Review. This is frequently the single largest contributor to Lead Time in organizations that haven't examined it directly. Review queue depth, reviewer availability, and approval bureaucracy live here, invisible to any dashboard that only measures "time in CI."
Testing. Change Failure Rate is most directly influenced at this waypoint. The ratio of automated to manual testing, and the comprehensiveness of test coverage on the critical path, predicts how many defects escape to production.
Deployment. Both Deployment Frequency and Change Failure Rate converge here. Deployment automation, progressive rollout strategy (canary, blue-green), and rollback tooling determine whether deployment is a routine event or a stressful one.
Monitoring. Mean Time to Recovery begins its true test here. Detection time — the gap between a failure occurring and someone knowing about it — is frequently the largest single component of MTTR, larger even than the time to fix the actual problem.
Learning. Blameless postmortems and systematic incident review feed back into every upstream waypoint. Organizations that skip this stage see the same failure modes recur, which shows up as a Change Failure Rate that never improves despite engineering effort elsewhere.
The executive value of this timeline is diagnostic: when a DORA metric underperforms, the timeline tells leadership where in the lifecycle to look, rather than leaving the team to guess.
The Engineering Thermometer
Replace the conventional KPI dashboard with a single visual metaphor: a thermometer, vertical, with five temperature zones rising from bottom to top — Cold, Cool, Healthy, High Performance, Elite. Each of the four DORA metrics gets its own thermometer reading, side by side, so an executive can see at a glance which metric is "running cold" relative to the others.
Thresholds by Metric and Zone
| Zone | Deployment Frequency | Lead Time for Changes | Change Failure Rate | Mean Time to Recovery |
|---|---|---|---|---|
| Cold | Fewer than monthly | More than 6 months | Above 45% | More than 1 week |
| Cool | Monthly to every 6 months | 1–6 months | 30–45% | 1 day to 1 week |
| Healthy | Weekly to monthly | 1 week to 1 month | 15–30% | A few hours to 1 day |
| High Performance | Daily to weekly | 1 day to 1 week | 10–15% | Under 1 hour to a few hours |
| Elite | On-demand, multiple per day | Less than 1 day | 5% or lower | Under 1 hour |
The thermometer metaphor does something a table cannot: it makes uneven performance visually obvious. A team with an Elite Deployment Frequency thermometer reading and a Cold Change Failure Rate reading isn't "mostly elite" — visually and substantively, that team is one severe incident away from a very bad month. The thermometer format forces leadership to confront the lowest reading, not the highest, because the lowest reading is what determines organizational risk exposure.
This is also a useful tool for quarterly planning: rather than setting a single composite OKR ("improve DevOps maturity"), leadership can set a specific target — move Change Failure Rate from Cool to Healthy this quarter — which is concrete, measurable, and resistant to the vague reporting that composite scores invite.
DORA Metrics Across Team Size
A target that's appropriate for a 5-engineer startup can be actively harmful if applied unmodified to a 300-engineer organization, and vice versa. Coordination overhead, architectural coupling, and organizational complexity all change the achievable range for each metric — and executives who don't adjust their expectations by team size end up either declaring victory too early or punishing teams for physics they don't control.
DORA Targets by Engineering Team Size
| Metric | 5 Engineers | 20 Engineers | 50 Engineers | 100 Engineers | 300 Engineers |
|---|---|---|---|---|---|
| Deployment Frequency | Multiple/day (low coordination cost) | Daily, moving toward on-demand | Daily across most services | On-demand per service, requires service ownership | On-demand per service; org-wide aggregate frequency is very high but individually owned |
| Lead Time for Changes | Hours (minimal review bureaucracy) | Under 1 day | 1–2 days, watch for review bottlenecks | 1–3 days, dependent on platform maturity | Varies widely by team; platform investment becomes the deciding factor |
| Change Failure Rate | Can be volatile — small sample size | 10–20%, stabilizing | Under 15% achievable with mature CI | Under 10% requires strong service boundaries | Under 10% requires strong service boundaries and cross-team contract discipline |
| Mean Time to Recovery | Minutes to hours — small blast radius | Under 1 hour achievable | Under 1 hour requires real observability investment | Under 1 hour requires mature incident command process | Under 1 hour requires dedicated SRE function and service-level ownership |
The pattern executives should internalize: as team size grows, the limiting factor shifts from individual engineering skill to organizational design. A 300-person engineering org with poor service boundaries will underperform a well-architected 50-person org on every DORA metric, because the metric is ultimately measuring coordination cost as much as technical capability. This is why platform investment, service ownership models, and team topology decisions belong on a CTO's desk, not just an engineering director's.
The Engineering Bottleneck Radar
Picture a spider (radar) chart with eight axes radiating from a central point, each axis representing a domain that can constrain delivery performance:
            Testing
              |
Security --   |   -- Code Reviews
         \    |    /
          \   |   /
Developer  \  |  /
Experience--- + ---CI/CD
          /   |   \
         /    |    \
Monitoring--  |  --Infrastructure
              |
       Release Process
A team plots its current capability on each axis (1–10), producing a shape rather than a single score. A "healthy" shape is roughly circular and pushed outward on all axes — even capability across domains. A "bottlenecked" shape is spiky and uneven: high on Code Reviews, collapsed on Infrastructure, for instance.
The executive insight this radar delivers that a single composite score cannot: DORA metrics are outcomes. The radar axes are causes. A Change Failure Rate stuck at 25% could be explained by weak Testing, weak Security review, or weak Release Process — three very different remediation paths with very different costs. Without a bottleneck radar, leadership is left improving the metric blind, often investing in the axis that's easiest to fund rather than the one that's actually constraining performance.
In practice, the most common bottleneck pattern observed across maturing SaaS organizations is a radar that's strong on CI/CD and Code Reviews (because these are visible, tool-purchasable improvements) and weak on Developer Experience and Monitoring (because these require sustained, less glamorous investment). That imbalance shows up directly as elevated MTTR and Change Failure Rate that automation alone never resolves.
How Elite Engineering Teams Improve Every Metric
Deployment Frequency
Common bottlenecks: Large batch sizes, long-lived feature branches, manual deployment steps, fear of releasing due to past incidents. Improvement strategies: Trunk-based development, feature flagging to decouple deploy from release, fully automated deployment pipelines, small-batch work decomposition. Leadership actions: Fund platform engineering explicitly; remove approval gates that exist for political rather than risk reasons; protect teams from "release freeze" reflexes after incidents. Business outcome: Faster response to market and competitive signals; shorter time from customer request to customer value.
Lead Time for Changes
Common bottlenecks: Review queue depth, environment provisioning delays, manual QA cycles, unclear ownership of approval steps. Improvement strategies: Service-level ownership to reduce cross-team review dependencies, automated testing to replace manual QA gates, self-service environments, review SLAs. Leadership actions: Treat review latency as an organizational metric, not an individual performance issue; invest in internal developer platforms; set explicit SLA expectations for review turnaround. Business outcome: Roadmap commitments become credible; sales and product can quote realistic delivery timelines.
Change Failure Rate
Common bottlenecks: Insufficient automated test coverage on critical paths, unclear service contracts, inadequate staging environment fidelity, rushed releases under deadline pressure. Improvement strategies: Progressive delivery (canary releases, feature flags with gradual rollout), contract testing between services, staging environments that mirror production realistically, mandatory rollback plans before release. Leadership actions: Resist deadline pressure that compresses testing time; fund a staging environment that's actually representative; make rollback capability a release-readiness requirement, not an afterthought. Business outcome: Fewer customer-facing incidents; reduced support load; preserved customer trust.
Mean Time to Recovery
Common bottlenecks: Poor observability (slow detection), unclear incident command structure, manual rollback procedures, lack of runbooks. Improvement strategies: Invest in alerting and observability tied to customer-facing symptoms (not just infrastructure metrics), formal incident command training, one-click or automated rollback, living runbooks reviewed after every incident. Leadership actions: Fund observability as a first-class platform investment, not an afterthought; sponsor blameless postmortems and ensure their findings are actually implemented; designate clear incident command authority before incidents happen. Business outcome: Failures become operational events, not business crises; customer-facing downtime shrinks even as release frequency increases.
The Cost of Poor DORA Metrics
Rather than a financial iceberg, picture a Water Leak illustration: a tank labeled "Engineering Capacity," full at the top, with six separate leak points along its side, each one draining capacity before it ever reaches the spout labeled "Customer Value."
   ENGINEERING CAPACITY TANK
   ┌─────────────────────┐
   │ ███████████████████ │ ← full capacity in
   │ ██████████████      │ ← leak: Manual Deployments
   │ █████████████       │ ← leak: Rollback Failures
   │ ██████████          │ ← leak: Slow Reviews
   │ ████████            │ ← leak: Environment Issues
   │ █████                │ ← leak: Hotfixes
   │ ███                  │ ← leak: Technical Debt
   └─────────────────────┘
              ↓
      (trickle reaching "Customer Value" spout)
Manual deployments leak capacity every single release cycle — engineering time spent on repetitive, error-prone manual steps that automation could eliminate entirely. Rollback failures leak capacity catastrophically: when a rollback doesn't work cleanly, the team isn't just delayed, they're now debugging a failure under pressure with reduced confidence in their own tooling. Slow reviews leak capacity quietly, in small increments per pull request, but compound across hundreds of pull requests a month into a major source of Lead Time inflation. Environment issues — staging environments that don't match production, flaky test infrastructure — leak capacity into rework and false-positive debugging. Hotfixes leak capacity at a premium rate: emergency fixes pulled engineers off planned work, frequently introduce their own follow-on defects, and erode the very testing discipline meant to prevent the next incident. Technical debt is the slowest leak and the easiest to ignore, but it raises the cost of every future change, compounding the other five leaks over time.
The business implication: a tank with six active leaks doesn't just deliver less — it requires constantly adding more capacity (headcount) just to maintain the same trickle of customer value. Organizations that don't measure DORA metrics often respond to declining output by hiring, when the actual fix is plugging leaks. This is one of the most expensive mistakes a CTO can make, because it converts an operational efficiency problem into a permanent and growing payroll cost.
Benchmarking Against Elite Teams
| Metric | Low | Medium | High | Elite |
|---|---|---|---|---|
| Deployment Frequency | Fewer than once per month | Between once per month and once per week | Between once per week and once per day | On-demand, multiple deployments per day |
| Lead Time for Changes | More than 6 months | Between 1 month and 6 months | Between 1 day and 1 week | Less than 1 day |
| Change Failure Rate | 45%+ | 30–45% | 15–30% | 5% or less |
| Mean Time to Recovery | More than 1 week | Between 1 day and 1 week | Between 1 hour and 1 day | Less than 1 hour |
Business implications by tier. Organizations in the Low tier are typically characterized by quarterly or less-frequent release cycles, multi-week incident resolution, and engineering organizations that are perceived internally as a bottleneck to business strategy rather than an enabler of it. Medium tier organizations have usually invested in basic CI/CD but haven't yet addressed organizational and process bottlenecks — they automate the pipeline without addressing the review queue, the staging environment fidelity, or the incident response structure around it. High tier organizations have closed most of the gap to elite performance and are typically differentiated from elite performers primarily by inconsistency — strong in some services or teams, weaker in others, often due to architectural coupling that elite organizations have already resolved. Elite tier organizations treat delivery performance as a competitive differentiator explicitly, often citing deployment capability in competitive sales conversations and investor updates, because the capability itself has become a defensible business asset.
The DORA Improvement Roadmap
Picture a mountain, drawn in profile, with a climbing route marked from base to summit:
                                          🏔  ELITE PERFORMER
                                        ╱
                                  ENGINEERING EXCELLENCE
                                ╱
                    CONTINUOUS DEPLOYMENT
                  ╱
        IMPROVE AUTOMATION
      ╱
STABILIZE RELEASES
  ╱
BASE CAMP
Base Camp. Process improvements: establish a single source of truth for what "production" means; define and start tracking the four DORA metrics consistently. Tools: basic CI, version control discipline, incident tracking. Leadership changes: assign explicit ownership of delivery metrics; stop treating releases as ad hoc events.
Stabilize Releases. Process improvements: reduce release batch size; introduce a release checklist; formalize rollback procedure. Tools: automated build pipeline, basic monitoring/alerting. Leadership changes: protect release windows from last-minute scope additions; sponsor the first blameless postmortems.
Improve Automation. Process improvements: automate testing on critical paths; reduce manual QA gates; introduce review SLAs. Tools: automated test suites, staging environments with production parity, feature flagging infrastructure. Leadership changes: fund platform engineering as a distinct function; tie engineering investment explicitly to Lead Time and Change Failure Rate targets.
Continuous Deployment. Process improvements: move to trunk-based development; decouple deploy from release using flags; implement progressive rollout (canary/blue-green). Tools: deployment automation, real-time observability tied to customer-facing symptoms, automated rollback. Leadership changes: redesign team topology around service ownership; formalize incident command structure.
Engineering Excellence. Process improvements: systematic chaos engineering and proactive failure testing; cross-team contract testing; continuous postmortem-driven architecture review. Tools: full observability stack with predictive alerting; self-service internal developer platform. Leadership changes: treat delivery performance as a board-reportable metric; integrate DORA targets into engineering compensation and promotion criteria.
Elite Performer. Process improvements: delivery performance is now a competitive differentiator, referenced in customer and investor conversations. Tools: the platform is invisible — engineers experience it as "how things work," not as tooling. Leadership changes: engineering capability is governed with the same rigor as financial performance, with quarterly trend review at the executive level.
The roadmap's executive value is sequencing discipline: organizations frequently fail not because they choose the wrong improvements, but because they attempt Continuous Deployment-stage practices (canary releases, full automation) before completing Base Camp-stage fundamentals (consistent metric tracking, basic release discipline). Skipping stages produces fragile, expensive tooling layered on top of unstable process — the climbing equivalent of attempting the summit push without first acclimatizing at base camp.
The Executive Scorecard
A monthly, board-ready scorecard organized into five sections, each scored independently:
Sample Monthly Scorecard
| Section | Metric(s) Tracked | This Month | Last Month | Target | Status |
|---|---|---|---|---|---|
| Engineering Speed | Deployment Frequency, Lead Time for Changes | Daily / 1.8 days | Weekly / 3.2 days | On-demand / <1 day | 🟡 Improving |
| Reliability | Change Failure Rate | 12% | 18% | <10% | 🟡 Improving |
| Operational Risk | Mean Time to Recovery, open Sev-1 incidents | 47 min / 1 open | 95 min / 3 open | <60 min / 0 open | 🟢 On Track |
| Developer Experience | Build time, review turnaround, engineer-reported toil score | 14 min / 6 hrs / 6.4 of 10 | 22 min / 11 hrs / 5.1 of 10 | <10 min / <4 hrs / 8+ of 10 | 🟡 Improving |
| Business Alignment | % roadmap commitments delivered on time, customer-reported incident count | 78% / 2 | 64% / 5 | 90%+ / 0–1 | 🟡 Improving |
This format gives a CTO something a raw metrics dump cannot: a status column that a board member can scan in ten seconds, backed by a trend (this month vs. last month) that demonstrates whether investment is working, and a target that ties the scorecard to a stated strategy rather than an arbitrary number.
Real SaaS Case Study
Consider a representative — though composite and illustrative — mid-market SaaS company at Series C, roughly 60 engineers, serving an enterprise customer base sensitive to downtime.
Before. The engineering organization released weekly, on a fixed Thursday deployment window. Lead Time for Changes averaged 11 days. Outages were frequent enough that the customer success team kept a running incident log separate from engineering's own tracking — itself a signal of the trust gap between functions. Mean Time to Recovery averaged 6 hours, largely because detection depended on customer complaints rather than internal monitoring. Change Failure Rate sat near 35%, and roughly a third of each sprint's capacity was informally absorbed by hotfixes and firefighting, though no one had measured this precisely until the DORA initiative began.
The intervention. Leadership did not start with tooling. They started by instrumenting the four metrics consistently across all services, which immediately surfaced the previously invisible firefighting tax. They then sequenced improvement using the mountain roadmap: stabilizing release batch size and rollback procedure first, automating the test suite on the three highest-traffic services second, and only then investing in canary deployment infrastructure.
After (12 months). Deployment Frequency moved from weekly to daily across most services, with the two highest-traffic services reaching on-demand deployment. Lead Time for Changes dropped from 11 days to under 2 days. Mean Time to Recovery dropped from 6 hours to under 40 minutes, driven primarily by investment in customer-symptom-based alerting rather than infrastructure-only monitoring. Change Failure Rate fell from 35% to 9%. The previously informal "firefighting tax" on sprint capacity dropped from an estimated one-third to under 10%, freeing measurable engineering capacity for roadmap work without any corresponding increase in headcount.
Measurable business outcomes. Net Promoter Score among enterprise accounts rose meaningfully over the same period, with customer success specifically citing faster resolution of reported issues. Sales began referencing release cadence and incident response time in competitive evaluations against slower-moving competitors. Engineering attrition — which had been elevated, driven largely by on-call fatigue from the high incident rate — declined as on-call burden fell in proportion to the drop in Change Failure Rate and MTTR.
The lesson generalizes: the company didn't improve its DORA metrics by hiring more engineers. It improved them by sequencing process and tooling investment correctly, and the business outcomes followed directly from the delivery outcomes — exactly as the Business Growth Flywheel predicts.
Top Mistakes When Measuring DORA
1. Measuring Deployment Frequency without measuring batch size. Problem: Teams deploy frequently but each deployment bundles dozens of unrelated changes. Business consequence: Change Failure Rate stays high because failures can't be isolated to a single cause; rollback becomes harder, not easier. Correct approach: Track batch size (commits or story points per deployment) alongside frequency.
2. Letting teams define "incident" inconsistently. Problem: Without a shared definition, some teams report every minor blip while others suppress real incidents to protect their Change Failure Rate. Business consequence: Cross-team comparison becomes meaningless and the metric loses executive credibility. Correct approach: Establish a single, severity-based incident definition enforced organization-wide.
3. Starting the Lead Time clock at the wrong point. Problem: Measuring only "commit to deploy" time hides the much larger "ticket created to commit" delay. Business consequence: Leadership believes Lead Time is healthy while customers still experience multi-week delays on requested features. Correct approach: Measure the full cycle from work committed-to through production deployment, not just the engineering-visible portion.
4. Treating MTTR as time-to-fix rather than time-to-restore. Problem: Teams stop the clock when a workaround is applied, not when full service is restored. Business consequence: Reported MTTR looks excellent while customers experience extended degraded service. Correct approach: Define recovery as full restoration of customer-facing functionality, and timestamp accordingly.
5. Comparing teams of different sizes on identical targets. Problem: A 300-engineer platform team is held to the same Lead Time target as a 5-engineer startup squad. Business consequence: Either demoralizes large, complex teams unfairly or sets dangerously low expectations for small teams. Correct approach: Use team-size-adjusted benchmarks, as outlined earlier in this article.
6. Optimizing one metric in isolation. Problem: A team chasing Deployment Frequency targets ships smaller, less-tested changes more frequently without addressing test coverage. Business consequence: Change Failure Rate rises even as the celebrated metric improves. Correct approach: Report all four metrics together, every time, with no exceptions for "good news" reporting.
7. Using DORA metrics for individual performance reviews. Problem: Engineers start gaming personal contribution to team metrics — e.g., splitting commits artificially to inflate personal deployment counts. Business consequence: Metric integrity collapses, and psychological safety around incident reporting erodes. Correct approach: Apply DORA metrics at the team or service level only, never to individuals.
8. Ignoring the detection-time component of MTTR. Problem: Leadership assumes MTTR problems are "fix" problems and invests in remediation speed. Business consequence: Investment misses the actual bottleneck, which is frequently detection time, not fix time. Correct approach: Break MTTR into detection time and remediation time, and diagnose separately.
9. Setting Elite-tier targets for organizations still at Cold or Cool maturity. Problem: Leadership mandates daily deployment before the team has basic test automation in place. Business consequence: Change Failure Rate spikes, trust in the metrics program collapses, and the initiative is abandoned. Correct approach: Use the maturity roadmap and thermometer thresholds to set sequenced, achievable targets.
10. Excluding "small" or "internal" changes from the data. Problem: Teams selectively exclude low-risk-seeming changes from tracking, shrinking the denominator. Business consequence: Reported Change Failure Rate looks artificially favorable. Correct approach: Track all production changes without exception-based exclusions.
11. Treating the scorecard as a one-time initiative rather than an ongoing cadence. Problem: DORA tracking is set up for a quarter, presented once, then quietly abandoned as priorities shift. Business consequence: The organization reverts to opinion-based management within two quarters. Correct approach: Build DORA review into a permanent, recurring leadership cadence — monthly at minimum.
12. Failing to connect metrics to a named business outcome. Problem: Metrics are reported as engineering trivia, disconnected from revenue, retention, or cost. Business consequence: Other executives disengage from the metrics program, viewing it as an engineering-only concern. Correct approach: Pair every metric trend with an explicit business outcome (as in the case study above).
13. Allowing review SLAs to substitute for review quality. Problem: Teams optimize Lead Time by rubber-stamping reviews to hit turnaround targets. Business consequence: Change Failure Rate rises as review rigor erodes. Correct approach: Pair Lead Time targets with a minimum review quality bar (e.g., required test coverage, required reviewer comments above a threshold).
14. Benchmarking against industry averages instead of industry elites. Problem: Leadership feels satisfied hitting "average" performance. Business consequence: The organization remains structurally uncompetitive against elite performers in the same market. Correct approach: Benchmark explicitly against the elite tier, even if the roadmap to reach it spans multiple years.
15. Punishing teams for reporting bad metrics honestly. Problem: A team with a rising Change Failure Rate is publicly criticized in a leadership forum. Business consequence: Teams learn to hide or massage data rather than surface it; the entire program loses integrity. Correct approach: Treat declining metrics as a diagnostic signal requiring support and investigation, not a basis for blame.
16. Conflating velocity (story points) with Deployment Frequency. Problem: Leadership assumes a team that completes many story points per sprint is automatically deploying frequently. Business consequence: Work accumulates in an unreleased state, inflating perceived progress while delivering zero customer value. Correct approach: Track Deployment Frequency as a distinct, production-anchored metric, separate from internal velocity measures.
Building a High-Performance Engineering Culture
Metrics alone do not build culture — they reveal whether the culture underneath them can sustain improvement. Five elements determine whether a DORA initiative produces lasting change or a brief spike followed by regression.
Psychological safety. Engineers will not report incidents honestly, flag risky releases, or admit uncertainty in a culture where doing so triggers blame. Every other element on this list depends on this one being true first.
Automation. Manual processes are not just slower — they are inconsistent, which means they introduce variance that makes metrics noisy and hard to trust. Automation converts tribal knowledge into repeatable, measurable process.
Ownership. Teams that own a service end-to-end — including its on-call burden and its production behavior — develop a fundamentally different relationship to quality than teams that hand off a finished feature to someone else to operate. Service ownership is consistently associated with stronger DORA performance because the people who can fix a problem are the same people who feel its consequences.
Continuous learning. Elite organizations treat every incident, every slow release, and every metric regression as a source of organizational learning rather than a closed event. This requires deliberate time investment — postmortem review time is not "extra," it's part of the delivery process.
Blameless postmortems. The specific mechanism by which continuous learning becomes systematic: a structured review, after every significant incident, that asks "what in our systems and processes allowed this to happen" rather than "who made this mistake." Organizations that skip this step see the same incident categories recur indefinitely.
Metrics transparency. DORA metrics should be visible to the entire engineering organization, not filtered through management layers before reaching individual contributors. Transparency builds the trust that makes the metrics actionable rather than merely reported.
Executive Checklist: 30 Questions Every CTO Should Ask About Engineering Performance
- What is our current Deployment Frequency, and has it trended up or down over the last two quarters?
- What is our current Lead Time for Changes, measured from work committed-to, not just commit-to-deploy?
- What is our current Change Failure Rate, and how is "failure" defined organization-wide?
- What is our current Mean Time to Recovery, broken into detection time and remediation time?
- Which of the four metrics is our weakest, and do we know why?
- Are our targets adjusted for team size, or are we applying a single standard across very different teams?
- Do all teams use the same definition of "incident," "deployment," and "change"?
- Is anyone gaming these metrics — splitting commits, excluding changes, redefining recovery?
- How much of our engineering capacity is currently consumed by hotfixes and unplanned firefighting?
- What percentage of our roadmap commitments were delivered on the originally communicated timeline last quarter?
- How does our Change Failure Rate correlate with customer-reported incidents and support ticket volume?
- Do we have observability tied to customer-facing symptoms, or only to infrastructure-level signals?
- How long does it take us to detect an incident versus how long it takes to fix one once detected?
- Do we have a standing, recurring cadence for reviewing these four metrics at the leadership level?
- Is our metrics program reported to the board, and in what format?
- Have we benchmarked ourselves against elite-tier industry performance, not just internal historical trends?
- What stage of the improvement roadmap are we actually at, versus what stage are we behaving as if we're at?
- Are we attempting advanced practices (canary deployment, full automation) before stabilizing basic release discipline?
- Do engineers trust that reporting a bad metric will lead to support rather than blame?
- Are blameless postmortems happening consistently, and are their findings actually implemented?
- How is on-call burden distributed, and does it correlate with our weakest DORA metric?
- What is our current review queue depth, and how long does code sit waiting for review?
- Do we have rollback capability that's been tested recently, or only assumed to work?
- How representative is our staging environment of actual production conditions?
- Are DORA metrics ever used in individual performance reviews? (If yes — why, and how is that affecting reporting honesty?)
- What is our developer experience score, and how does it trend alongside our delivery metrics?
- How much engineering investment last quarter went toward platform and automation versus net-new features, and was that ratio deliberate?
- If a customer asked us directly how fast we can fix a critical bug, could we answer with data rather than confidence?
- Does our service ownership model match our team topology, or are teams operating services they don't fully control?
- If we presented our current DORA scorecard to the board today, would the trend line support our stated growth strategy?
Conclusion
DORA metrics are frequently introduced to organizations as DevOps tooling — something for the platform team to track, report on, and quietly improve in the background. That framing dramatically understates what these four numbers actually represent. Read correctly, Deployment Frequency, Lead Time for Changes, Change Failure Rate, and Mean Time to Recovery are executive indicators of software delivery capability, organizational maturity, and long-term business performance — as material to a SaaS company's competitive position as gross margin or net revenue retention.
The organizations that treat these metrics this way don't just ship faster. They make better-funded decisions, defend engineering investment with evidence rather than advocacy, recover from failure as a routine operational event rather than a business crisis, and retain the engineers who would otherwise leave for organizations where their work isn't constantly undone by firefighting. The gap between elite and low-performing organizations on these four metrics is not a gap in talent. It is a gap in operating discipline — and operating discipline is, unlike talent, something every leadership team can choose to build.
The case for action is straightforward: assess where your organization currently sits on each of the four metrics, honestly and without selective exclusion. Identify the single weakest metric, trace it back through the bottleneck radar to its root cause, and sequence your investment using the improvement roadmap rather than reaching for the most advanced tooling first. Build the review cadence into your leadership rhythm before you build the dashboard. And report the trend — not the snapshot — to your board, because the trend is what proves the investment is working.
Engineering performance, measured this way, stops being a technical concern reported up to leadership. It becomes a business capability that leadership actively governs. That shift is the real outcome of adopting DORA metrics — and it is the one that compounds, quarter after quarter, into a durable competitive advantage.



