
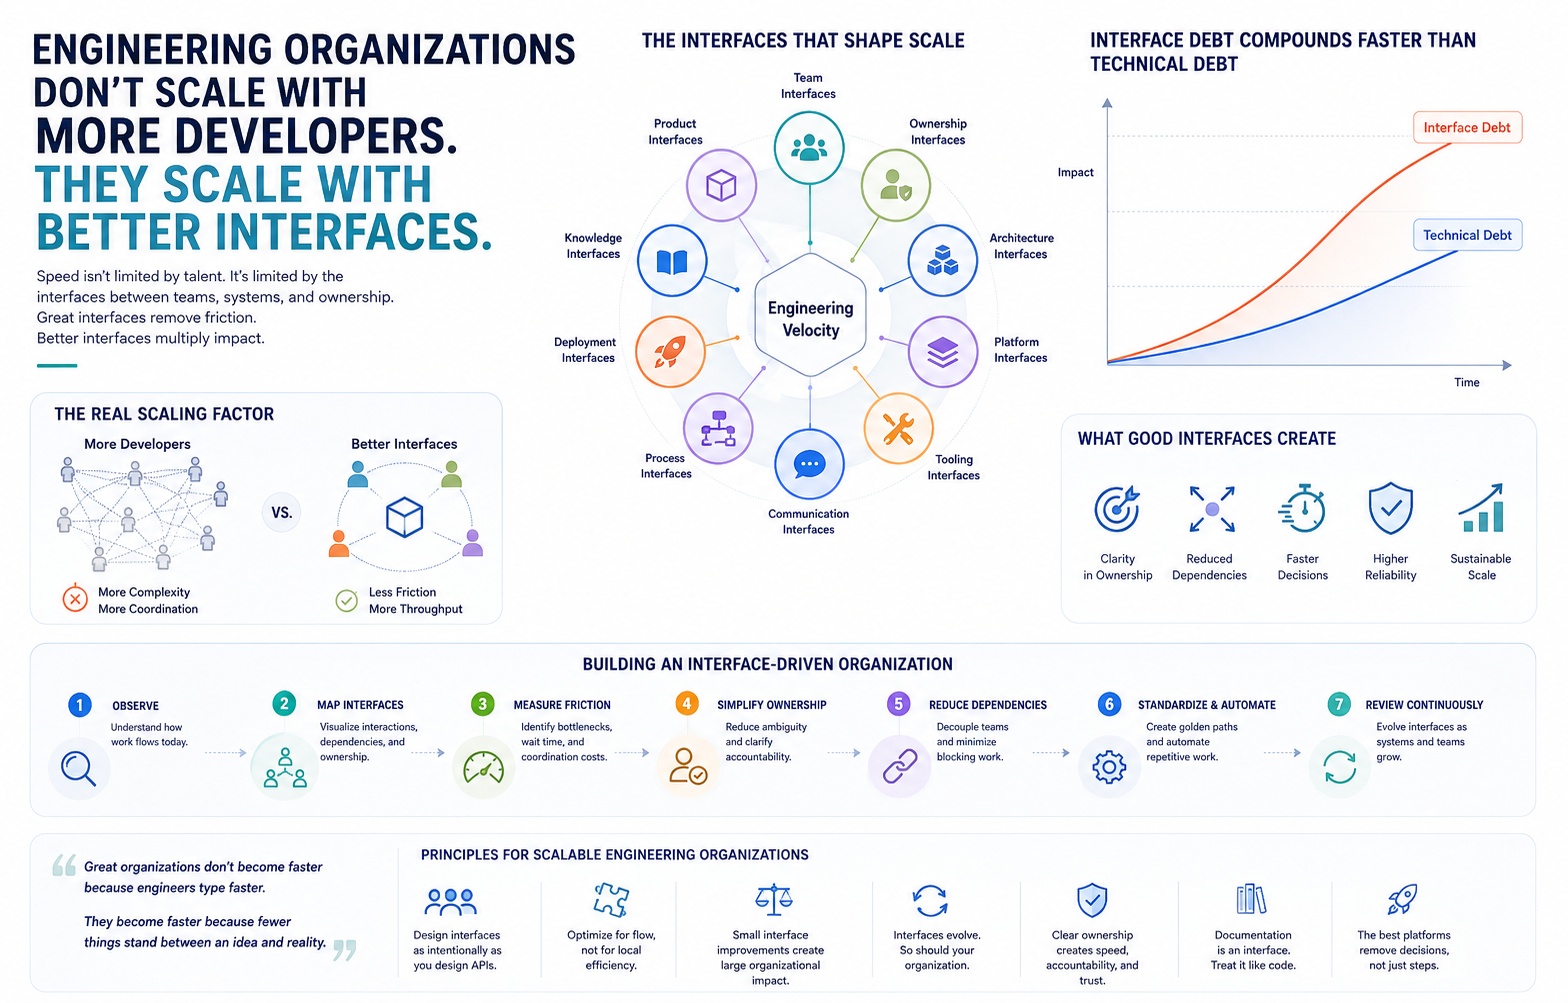
Add fifty engineers to a two-hundred-person engineering organization and you will not get fifty engineers' worth of output. You may not get ten. In some organizations, you get negative throughput — the codebase ships slower six months after the hiring spree than it did before.
This is not a mystery. It is not a talent problem, a motivation problem, or a tooling problem. It is a structural one, and most engineering leadership never diagnoses it correctly, because the instinct when delivery slows is always the same: hire more.
Headcount is the most visible lever in engineering leadership, which is exactly why it's the most overused. It's easy to point to, easy to justify in a budget review, and easy to believe in, because it maps to an intuitive story — more hands, more output. But past a certain organizational size, the thing constraining velocity stops being the number of people writing code and starts being the number and quality of the connections between them.
Large engineering organizations are not collections of individual contributors. They are systems of interfaces — between teams, between services, between decisions, between ownership boundaries. And systems don't scale by adding parts. They scale by how well the parts connect.
Lens 1 — Organizational Physics
Treat an engineering organization as a system rather than a headcount roster and the slowdown stops being mysterious. Every additional team is a new node. Every new node requires communication paths to the nodes it depends on and the nodes that depend on it. The number of potential communication paths grows roughly with the square of the number of teams, not linearly with team count.
This is coordination cost, and it is not overhead in the accounting sense — it's not a tax skimmed off the top of otherwise-full productivity. It's structural drag that increases with every dependency a team carries. A ten-person team with three external dependencies moves differently than the same ten people with twelve external dependencies, even though nothing about their individual skill has changed.
The failure mode is that leadership measures the parts — sprint velocity, individual output, story points closed — and never measures the connective tissue between them. An org chart shows reporting lines. It says nothing about how many other teams a given team has to negotiate with to ship a single change. The real map of an engineering organization isn't the org chart. It's the dependency graph, and almost nobody draws it.
(Infographic opportunity: an Engineering Interface Map — teams as nodes, dependencies as weighted edges, edge thickness representing coordination cost rather than headcount.)
Lens 2 — Invisible Interfaces
Architecture diagrams show service boundaries, API contracts, data flows. They do not show the interfaces that actually determine whether a change ships in a day or a month.
Ownership is an interface. When a service has ambiguous ownership — inherited from a team that reorged away, or shared by two teams that both assume the other is watching it — every change to that service requires a negotiation that isn't written down anywhere. Nobody designed this interface. It exists by default, and default interfaces are almost always worse than designed ones.
Priorities are an interface. A platform team's roadmap is an interface to every team that depends on platform capabilities; if that roadmap is opaque, every dependent team is operating against an unknown. Documentation is an interface, arguably the cheapest one to build and the most consistently neglected — stale docs don't just fail to help, they actively cost time, because someone has to discover they're wrong before they can be useful.
Deployment responsibility is an interface. Who is on the hook when a change to a shared library breaks a downstream consumer at 2 a.m.? If the answer isn't specified before the incident, it gets negotiated during the incident, which is the most expensive possible time to design an interface.
Product boundaries are interfaces too — not technical ones, but they behave identically. When two teams believe they own the same piece of user-facing behavior, every feature decision becomes a cross-team negotiation that nobody scheduled and nobody owns.
None of these appear on an architecture diagram. All of them determine how fast work actually moves.
(Infographic opportunity: an Ownership Graph showing every system, service, and product surface mapped against a single clearly-designated owner — with ambiguous or dual-owned nodes flagged in a distinct color.)
Lens 3 — Team APIs
The most useful mental model for fixing this isn't a process framework. It's borrowed from software design itself: treat every team as if it exposes an API to the rest of the organization.
A well-designed Team API specifies:
- Inputs — what a team accepts as a request: a ticket format, a specific channel, a defined intake process.
- Outputs — what the team commits to producing, and in what shape.
- Expectations — turnaround time, quality bar, what counts as "done."
- SLAs — explicit, not implied. "We respond to P1 requests within four hours" is an SLA. "We're usually pretty responsive" is not.
- Escalation paths — what happens when the SLA is missed, and who has authority to intervene.
- Ownership — a name or a team, not a rotating cast of whoever happens to see the Slack message.
- Contracts — the shape of what's exchanged, versioned like any other interface.
- Versioning and deprecation — how the team communicates breaking changes to its own way of working.
- Dependency management — what the team itself depends on, made visible rather than discovered during an incident.
Teams without an explicit API still have one — it's just undocumented, inconsistent, and different depending on who you ask inside the team. That's the equivalent of a service with no contract: every caller has to reverse-engineer the behavior, and every change risks breaking someone who was depending on an unstated assumption.
The organizations that scale well are the ones that treat this as seriously as they treat versioning a public API. The ones that don't scale well treat it as a soft-skills problem to be solved with better meetings.
(Infographic opportunity: a Team API Matrix — rows as teams, columns as Inputs / Outputs / SLA / Escalation / Owner — making gaps immediately visible.)
Lens 4 — Interface Debt
Technical debt has a well-understood shape: a shortcut taken under time pressure, paid back later with interest in the form of harder maintenance. Interface debt is the organizational equivalent, and it is far less visible, which makes it far more dangerous.
Interface debt accumulates every time a team takes on a dependency without negotiating a contract for it. It accumulates every time an escalation path is improvised instead of designed. It accumulates every time two teams agree to "just talk it through" instead of defining who owns what.
The critical difference is compounding speed. Technical debt in a single codebase is contained — it slows down the team that owns that code, and the blast radius is usually visible in code review, in test failures, in the file itself. Interface debt spreads across every team that touches the ambiguous boundary. A single undefined ownership boundary can slow down five teams simultaneously, each one unaware that the other four are hitting the same wall for the same underlying reason.
Technical debt is usually discovered by the team that created it. Interface debt is usually discovered by the teams that didn't create it — which means the people paying the cost have no authority to fix the cause. That asymmetry is why interface debt persists so much longer than technical debt in most organizations: nobody with the power to resolve it is the one feeling the pain.
(Infographic opportunity: an Interface Debt Growth Curve, plotted against a standard technical debt curve on the same axes — showing steeper compounding and a wider blast radius over time.)
Lens 5 — Why More Developers Sometimes Reduce Throughput
Fred Brooks made this observation about a single project in 1975, and it remains one of the most under-applied insights in engineering leadership: adding people to a late project makes it later. The mechanism generalizes far beyond a single project to an entire organization.
Every new engineer added to a team increases that team's internal communication paths. Every new team added to an org increases cross-team communication paths at a faster rate than the team count itself. New hires need onboarding time from people who are already doing the work that's late. Code review queues lengthen, because reviewers are a fixed resource that doesn't scale with headcount unless deliberately expanded. Decisions that used to require two people now require five, because more people have a stake in the outcome — and decision latency, unlike headcount, is not something you can hire your way out of.
Handoffs multiply. A feature that used to move through one team's hands now crosses three team boundaries, and each crossing introduces queueing time — the work isn't being done during that wait, it's just waiting for capacity or attention. Platform fragmentation compounds the effect: if new teams stand up their own tooling instead of using shared platform capabilities, every fragmentation point becomes a future interface that has to be reconciled or maintained twice.
None of this means hiring is wrong. It means hiring without addressing the interfaces those new people will operate inside of converts headcount growth into coordination cost growth — and coordination cost grows faster than the value new engineers add, past a threshold that most organizations cross without noticing.
(Infographic opportunity: a Scaling Friction Model — headcount on the x-axis, two curves on the y-axis: theoretical output capacity versus actual delivered throughput, with the widening gap between them labeled as coordination drag.)
Lens 6 — Platform Engineering as Interface Engineering
The organizations that have figured this out tend to converge on the same solution, even when they arrive at it independently: an internal platform. Not because platform engineering is a trend, but because a good internal platform is, functionally, an interface simplification tool.
A self-service deployment pipeline removes the interface between a product team and the infrastructure team that used to need to be looped in for every release. A golden path — a supported, opinionated, pre-integrated way to build and ship a service — removes the interface where every team used to negotiate its own tooling choices from scratch. Good internal documentation removes the interface where the only way to get an answer was to interrupt someone who already knew it.
The value of a platform team isn't the tools it builds. It's the number of interfaces those tools make unnecessary. A platform team that ships a highly capable but unused internal tool has added an interface — one more system to learn, integrate with, and depend on — without removing any of the ones that made teams slow in the first place. That is a common and expensive failure mode: building platform capability that doesn't actually get adopted, which means the coordination cost it was meant to eliminate is simply replaced by a new coordination cost — negotiating with the platform team itself.
The best platform teams measure themselves not by capabilities shipped but by dependencies removed and decisions made unnecessary for other teams to make.
(Infographic opportunity: Platform Capability Layers — a stack diagram showing which layers are self-service, which still require negotiation, and which remain fully manual, with an adoption percentage per layer.)
Lens 7 — Architecture Creates Interfaces
Software architecture and organizational structure are not two separate concerns that happen to interact. They are the same structure, viewed from two angles. Every architectural boundary is also an organizational interface, whether or not anyone designed it that way.
Bounded contexts, in the domain-driven design sense, work because they make an explicit claim: this is where one team's model of the world ends and another's begins. When bounded contexts are fuzzy, team boundaries end up fuzzy too, because the two are entangled by default. Contracts between services — API schemas, event definitions, data ownership — function as documentation that doesn't go stale the way prose does, because a broken contract fails loudly instead of silently drifting out of date.
Modularity at the code level and modularity at the team level reinforce or undermine each other. A monolith with unclear internal boundaries tends to produce an organization with unclear ownership boundaries, because the code doesn't force a decision about who's responsible for what. Microservices don't automatically fix this — a service architecture with the wrong boundaries just creates more interfaces, more of them poorly defined, and more coordination overhead than a well-bounded monolith would have.
This is the core insight behind team topologies as a discipline: architecture should be drawn with organizational communication patterns in mind, not the other way around. Draw the service boundaries first and hope the team structure sorts itself out, and you'll get an organization shaped by accident rather than by design.
(Infographic opportunity: an Architecture Boundary Diagram overlaid directly on a team ownership map — showing where the two align and, more usefully, where they don't.)
Lens 8 — Measuring Interface Quality
Most engineering metrics measure output. Almost none measure the interfaces that determine how much output is possible. That's a measurement gap worth closing, because you cannot fix what you don't track, and interface problems are consistently the ones nobody is tracking.
Useful signals include:
- Cross-team dependency count — how many external teams does a given team need in order to ship independently?
- PR waiting time — not time to write the code, but time a reviewable change sits waiting for attention, which is a direct proxy for review-capacity interfaces.
- Decision latency — the time between a decision being needed and a decision being made, especially for decisions that cross team boundaries.
- Ownership ambiguity — the count of systems, services, or product surfaces without a single clearly accountable owner.
- Deployment independence — can a team ship a change without coordinating a release with another team?
- Change failure rate — a classic DevOps metric, but also an interface signal, since many failures trace back to an undocumented or misunderstood contract between systems.
- Review queue length — sustained queue growth is a leading indicator of a reviewer-capacity interface breaking down before anyone complains about it directly.
- Knowledge discoverability — how long does it take a new team member to find the answer to a common question without asking a person?
- Documentation freshness — not whether documentation exists, but whether it was updated the last time the thing it describes changed.
- Service dependency depth — how many hops does a request take through how many independently-owned services, and how many of those owners would a given team need to contact to debug a failure?
None of these metrics are exotic. What's notable is how rarely they're tracked with the same rigor as sprint velocity or deployment frequency. Organizations that measure output but not interfaces end up optimizing the part of the system that was never the bottleneck.
(Infographic opportunity: a Decision Latency Funnel — stages from "decision needed" to "decision made," with time-in-stage and the number of people or teams required to approve at each stage.)
(Infographic opportunity: a Dependency Heatmap — a matrix of teams against teams, shaded by dependency count and average PR waiting time between them.)
Lens 9 — A Practical Transformation Roadmap
Fixing interface quality is not a reorg, and it doesn't require a big-bang architectural rewrite. It's closer to a diagnostic and remediation process, applied continuously rather than as a one-time initiative.
Observe. Before changing anything, watch how work actually moves — not how the process documentation says it moves. Interview a handful of teams about where their last three shipped changes got stuck, and the pattern usually surfaces within the first few conversations.
Map interfaces. Draw the real dependency graph, not the org chart. Include the invisible interfaces from Lens 2 — ownership, documentation, escalation — not just the technical ones.
Measure friction. Apply the metrics from Lens 8 to the map. Friction that seemed anecdotal usually turns out to be concentrated in a small number of specific boundaries, not spread evenly across the organization.
Simplify ownership. Every ambiguous ownership boundary identified in the mapping step gets a single accountable owner. This step alone resolves a disproportionate share of coordination overhead, because so much of it originates in "who's supposed to handle this" rather than in technical complexity.
Reduce dependencies. Where possible, restructure so teams need fewer other teams to ship independently. This sometimes means changing service boundaries, sometimes means changing team boundaries, and sometimes just means giving a team the access or capability it previously had to request from someone else.
Standardize. For the dependencies that can't be removed, standardize the interface — a consistent intake process, a documented SLA, a defined escalation path — so at least the coordination cost is predictable instead of improvised each time.
Automate. Where a standardized interface can be turned into a self-service capability, automate it. This is where platform engineering earns its place in the roadmap, not as a first step but as a mechanism applied once the interface itself is well understood.
Review continuously. Interfaces decay. A team reorg, a new service, a departed engineer who was the unofficial owner of an undocumented process — any of these can silently reintroduce the exact ambiguity the earlier steps removed. Treat interface health as an ongoing operating metric, not a project with an end date.
(Infographic opportunity: a Scaling Friction Model roadmap variant — the eight-step process laid out as a cycle rather than a line, emphasizing that "review continuously" feeds back into "observe.")
Final Reflection
The instinct to solve slow delivery by hiring persists because it feels like action. It's visible, it's measurable in a budget line, and it satisfies the pressure to do something. But past a certain size, headcount is not the constraint. The constraint is how many things a piece of work has to pass through — how many teams, how many undefined ownership boundaries, how many contracts that were never written down — before it reaches production.
Great organizations don't become faster because engineers type faster. They become faster because fewer things stand between an idea and reality.



