
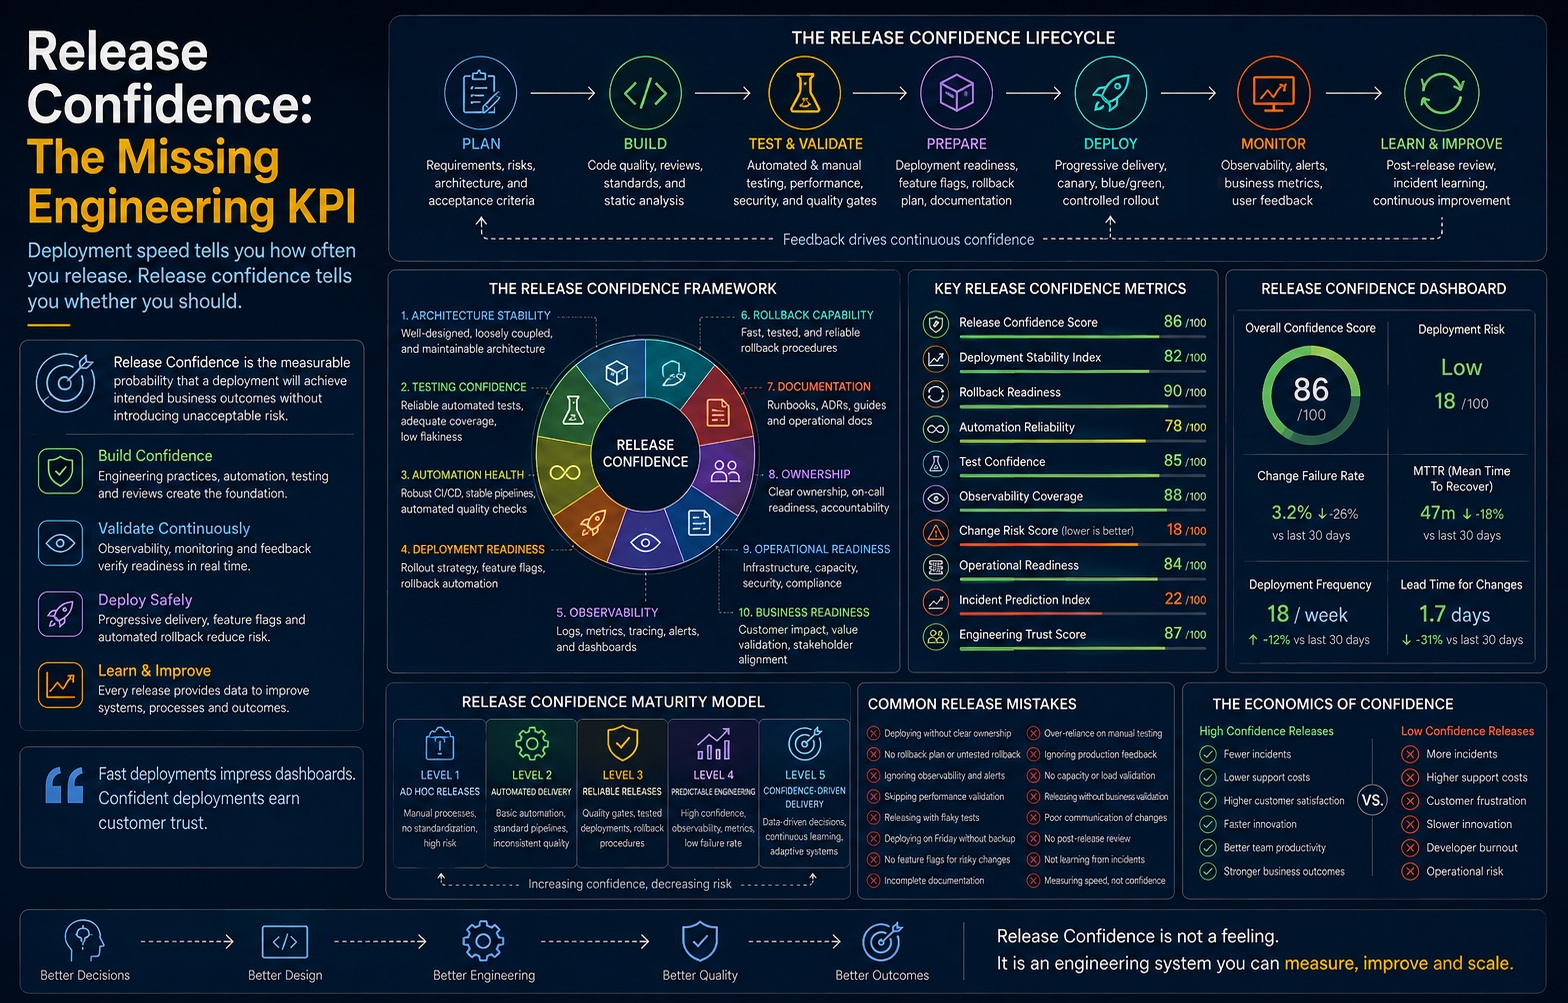
Every mature engineering organization can now answer the question "how often do you deploy?" Most can answer "how long does a change take to reach production?" A growing number can answer "what percentage of changes cause degradation?"
Almost none can answer the question that actually predicts outcomes: "How confident were you before you shipped — and were you right to be?"
This is not a rhetorical gap. It is a measurement gap with direct financial consequences. Deployment frequency is a measure of motion. Lead time is a measure of friction. Change failure rate is a measure of hindsight. None of them is a measure of knowledge held at the moment of decision. An organization can deploy forty times a day, recover in eleven minutes, and still be operating on institutional guesswork — because the speed metrics describe the pipeline's throughput, not the organization's epistemic state.
Release Confidence is the missing dimension. We define it as:
Release Confidence is the measurable probability that a deployment will achieve its intended business outcome without introducing unacceptable operational risk — expressed as a score, computed from evidence, and validated against subsequent production reality.
Three properties distinguish it from every metric currently on an engineering dashboard.
It is predictive, not retrospective. Change failure rate tells you what already broke. Release Confidence is computed before the deploy button is pressed. It is the only release metric that can change a decision rather than explain one.
It is falsifiable. A confidence score that is never compared against outcomes is theater. The framework in this paper includes a calibration loop: predicted confidence is scored against realized outcomes, and the model is corrected. An organization that reports 92% confidence and experiences a 30% incident rate does not have a reliability problem first — it has a measurement integrity problem first.
It is perishable. Confidence is not a property of an artifact. It is a property of the relationship between an artifact and a moving environment. A build that scored 94 on Tuesday does not score 94 on Friday. Confidence has a half-life, and most release processes have no mechanism for recognizing decay.
The economic argument is straightforward. Fast delivery without confidence produces a recognizable pathology: deploy → hotfix → rollback → escalation → freeze → batch → larger blast radius → slower delivery. Speed compounds into fragility, then fragility compounds into slowness. Organizations that appear to be trading safety for velocity are usually, over a twelve-month horizon, trading both.
This paper contributes:
- A ten-pillar Release Confidence Framework with weightings and blocking floors
- A composite Release Confidence Score (RCS) with a specified formula, decay function, and calibration method
- Ten original engineering KPIs, including the Deployment Stability Index, Change Risk Score, Confidence Half-Life, and Engineering Trust Score
- A Confidence-Driven Delivery maturity model (L0–L4) with objective exit criteria per level
- A treatment of probabilistic release validation for AI systems, where deterministic pass/fail gating structurally fails
- A dashboard specification, a 40-question readiness checklist, twenty-four documented anti-patterns, twelve diagram specifications, ten comparison tables, five maturity models, eight frameworks, and six operational workflows
The argument in one line: deployment frequency tells you how often you release software; Release Confidence tells you whether you should.
"Fast deployments impress dashboards. Confident deployments earn customer trust."
Chapter 1 — The Illusion of Fast Delivery
1.1 The metric that measures the wrong noun
Deployment frequency is a measure of a pipeline. It is not a measure of an organization. This distinction collapses in practice because the pipeline is the most instrumented part of the delivery system and therefore the easiest thing to report upward. What gets measured is not what matters; what gets measured is what emits events.
Consider two organizations with identical DORA profiles: 40 deploys/day, 22-minute lead time, 14% change failure rate, 18-minute MTTR. Externally indistinguishable. Internally:
Organization A ships 40 times a day because 38 of those deploys are independently reversible, feature-flagged, single-service changes with automated canary analysis and pre-computed rollback plans. Engineers deploy on Friday afternoon without discussion. The 14% failure rate is dominated by low-severity, auto-remediated canary aborts that never reach a customer.
Organization B ships 40 times a day because it has decomposed a fragile monolith into forty coupled services whose deploys must be sequenced, and because a substantial fraction of those deploys are hotfixes for the previous deploy. The 14% failure rate is dominated by customer-visible incidents. Engineers avoid deploying after Wednesday. Nobody says this out loud; it appears in the data as a bimodal deploy-time distribution.
Both organizations report the same numbers to the board. One is compounding capability. The other is compounding debt. No DORA metric distinguishes them. The distinguishing variable is confidence, and it is unmeasured.
1.2 The redeployment tax
The clearest empirical fingerprint of low confidence is that deploys are caused by other deploys. We formalize this as the Redeployment Tax:
Redeployment Tax (RT) = corrective deploys / total deploys

corrective deploy = any deploy whose primary purpose is to remediate,
                    revert, patch, or complete a prior deploy within 72h
An organization with RT = 0.05 deploying 40 times a day is delivering ~38 units of intended change. An organization with RT = 0.45 deploying 40 times a day is delivering ~22 units of intended change — while paying full operational, review, and cognitive cost for all 40. The second organization's deployment frequency is not a productivity signal. It is a rework signal wearing a productivity costume.
This matters because RT is not visible in any standard delivery dashboard, yet it is trivially computable from commit metadata, incident linkage, and deploy annotations. It is the cheapest high-signal metric most organizations are not collecting.
1.3 The fatigue cascade
Low confidence does not fail loudly. It degrades the organization along a predictable path.
   Fast releases, unverified assumptions
                 │
                 ▼
   Frequent hotfixes  ──────────► Redeployment Tax ↑
                 │
                 ▼
   Rollbacks under time pressure ─► Rollback rehearsal ↓
                 │
                 ▼
   Customer-visible degradation ──► Support load ↑, NPS ↓
                 │
                 ▼
   Escalation culture, heroics ───► On-call attrition ↑
                 │
                 ▼
   Defensive process: freezes, ───► Batch size ↑
   approval boards, sign-offs
                 │
                 ▼
   Larger, riskier releases ──────► Blast radius ↑
                 │
                 ▼
   Lower confidence  ◄─────────────┘  (reinforcing loop)
The critical property of this loop is that the organizational response to low confidence reduces confidence further. Change advisory boards, release freezes, and mandatory sign-offs increase batch size. Larger batches have larger blast radii, more coupled failure modes, and worse attributability when they fail. The governance intended to restore safety mechanically destroys it.
This is why "add more approval" is the single most reliably counterproductive intervention in release engineering. It substitutes ceremony for evidence. Approval is a signature. Confidence is a measurement.
1.4 Speed without confidence is operational debt
Technical debt is a well-understood metaphor: a deliberate or accidental shortcut that accrues interest in the form of future development cost. Operational debt is its runtime sibling — a shortcut in verification, observability, reversibility, or ownership that accrues interest in the form of future incident cost.
The debt instrument is precise. Each deploy shipped without verified rollback, without an instrumented success signal, without a named owner, or without a tested failure path is a loan drawn against production. The principal is the unverified assumption. The interest is paid in incident hours, support tickets, and engineer attention. Unlike technical debt, operational debt is called at random — you do not choose when it comes due.
The framework's core assertion follows directly:
An organization's real delivery capacity is not its deployment frequency. It is its deployment frequency multiplied by the probability that each deployment was a good idea.
1.5 Practical recommendations
| # | Recommendation | Measurable outcome |
|---|---|---|
| 1 | Instrument the Redeployment Tax from commit + deploy metadata | RT reported weekly; target < 0.10 |
| 2 | Split change failure rate into customer-visible vs. auto-remediated | Two distinct series; the first is the board metric |
| 3 | Plot deploy-time-of-week histograms per team | Bimodality is a confidence deficit fingerprint |
| 4 | Ban "deploy count" from executive reporting unless paired with RT | Removes the incentive to inflate motion |
| 5 | Audit every release freeze introduced in the last 24 months | Each is a documented confidence failure; treat as a defect backlog |
1.6 KPIs introduced in this chapter
- Redeployment Tax (RT) — corrective deploys ÷ total deploys
- Intended Change Throughput (ICT) — total deploys × (1 − RT)
- Deploy Time Skew (DTS) — variance in deploy distribution across the working week; high skew indicates informal risk avoidance
Chapter 2 — What Is Release Confidence?
2.1 A working definition
Release Confidence (RC) is the measurable probability, computed from evidence available before deployment, that a specific change deployed to a specific environment at a specific time will achieve its intended business outcome without introducing unacceptable operational risk.
Every clause is load-bearing.
"Measurable probability" — RC is a number, not an adjective. If a release process produces the words "we think we're good," it has produced sentiment, not confidence. Sentiment cannot be trended, calibrated, or audited.
"Computed from evidence" — the inputs must be artifacts: test results, coverage deltas, canary telemetry, dependency scans, contract verification, rollback rehearsal records, ownership registries. Human judgment is a legitimate input but must be encoded as a scored, attributable signal, not as an unexamined veto.
"Available before deployment" — this is the property that makes RC unique. It is a decision-time metric. Retrospective quality metrics cannot change decisions; they can only score them.
"A specific change" — confidence is not a property of a team, a service, or a quarter. A schema migration and a copy change in the same repository, shipped by the same pipeline, have radically different confidence profiles. Any framework that assigns one score per pipeline rather than per change is measuring infrastructure, not risk.
"At a specific time" — see §2.4. Confidence decays.
"Intended business outcome" — this excludes the most common false success in modern delivery: a deploy that is technically green, causes no incident, and does not do what it was built to do. A feature that ships without moving the metric it was funded to move is a failed release with a passing pipeline.
"Unacceptable operational risk" — the threshold is contextual. A payments ledger and an internal admin tool do not share a risk appetite. RC is normalized; risk tolerance is configured.
2.2 Confidence is not the same as quality, safety, or certainty
These four are routinely conflated. They are orthogonal.
| Concept | Question it answers | Time orientation | Failure mode when conflated with RC |
|---|---|---|---|
| Quality | Is the artifact well built? | Timeless | High-quality code shipped into an environment nobody can observe |
| Safety | Can we survive being wrong? | Recovery | Excellent rollback used to justify shipping untested change |
| Certainty | Do we know the outcome? | Absolute | Chasing 100% guarantees; delivery stalls |
| Confidence | Should we ship this, now? | Decision-time | — |
Certainty is the trap. Certainty is unobtainable in distributed systems and its pursuit produces the freeze/batch pathology of §1.3. Confidence is explicitly probabilistic: it accepts that we will be wrong some percentage of the time and demands that we know which percentage and survive it.
"We do not ship because we are certain. We ship because we are calibrated, instrumented, and reversible."
2.3 The five dimensions of Release Confidence
Confidence decomposes into five questions. Every pillar in Chapter 3 serves one of them.
D1 — Correctness confidence. Does the change do what we think it does? Sources: unit/integration/contract tests, static analysis, type systems, formal specification where warranted, review depth.
D2 — Behavioural confidence. Do we know how it behaves under real conditions? Sources: load testing, soak testing, chaos experiments, production traffic shadowing, dependency latency budgets.
D3 — Detection confidence. If it goes wrong, will we know — and how fast? Sources: instrumentation coverage of the changed path, SLO alerting, canary analysis, synthetic probes, RUM. This is the most under-invested dimension in most organizations.
D4 — Recovery confidence. If it goes wrong, can we undo it — provably, quickly, without data loss? Sources: rollback rehearsal recency, migration reversibility class, flag kill-switch coverage, state compatibility.
D5 — Outcome confidence. Will it produce the business result it was funded for? Sources: experiment design, guardrail metrics, business KPI instrumentation, pre-registered success criteria.
A crucial asymmetry: D3 and D4 are worth more than D1 in high-change-rate systems. An organization that is 80% correct with 2-minute detection and 90-second rollback outperforms an organization that is 95% correct with 40-minute detection and manual recovery — every time, across every severity class. This inverts the instinct of most quality organizations, which invest almost entirely in D1.
2.4 Confidence is perishable: the Confidence Half-Life
A build's confidence is not a stored value. It is a decaying one. The moment a build is verified, the world begins to diverge from the conditions of verification: dependencies publish, infrastructure patches, traffic patterns shift, feature flags change, adjacent services deploy.
We model this explicitly:
RC(t) = RC₀ · e^(−t/τ)

RC₀ = confidence at time of verification
t   = elapsed time since verification
τ   = Confidence Half-Life of the environment (in hours)
Confidence Half-Life (τ) is an environmental property, empirically derived per system, and it is one of the most useful numbers an organization can compute about itself. Estimate it as:
τ ≈ k / (D_adjacent + Δ_dependency + Δ_infra)

D_adjacent    = deploys/hour into services within the blast radius
Δ_dependency  = dependency change events/hour
Δ_infra       = infrastructure/config mutation events/hour
Practical consequences:
- A high-velocity microservice mesh may have τ ≈ 6–18 hours. A build verified on Friday and deployed on Monday carries roughly a quarter of the confidence it was awarded.
- Long-lived release branches are, in this model, systematically overconfident by construction. The longer the branch, the more the score reflects a world that no longer exists.
- Re-verification is not bureaucratic duplication. It is confidence recharging, and it should be automated on a cadence tied to τ, not to human calendar habits.
This single formula reframes several long-running debates. "Should we re-run the full suite before promotion?" is not a philosophical question; it is a question of whether elapsed time since verification is large relative to τ.
2.5 Practical recommendations
| # | Recommendation | Measurable outcome |
|---|---|---|
| 1 | Compute RC per change, never per pipeline | Score variance across changes in one pipeline > 20 points |
| 2 | Empirically derive τ per deployment environment | τ published; promotion windows bounded at 0.5τ |
| 3 | Require pre-registered success criteria for any funded feature | % of releases with defined outcome metric; target > 90% |
| 4 | Report D3/D4 scores separately to leadership | Detection and recovery become funded programs, not by-products |
| 5 | Reject "certainty" language in release reviews | Release notes state residual risk explicitly |
2.6 KPIs introduced in this chapter
- Confidence Half-Life (τ) — hours until verified confidence decays by 1/e
- Verification Age (VA) — elapsed time between last full verification and deployment
- Confidence Decay Ratio (CDR) — RC(t) ÷ RC₀ at deploy time; target > 0.7
- Outcome Attainment Rate (OAR) — % of releases meeting pre-registered success criteria
Chapter 3 — The Release Confidence Framework
3.1 Structure
The framework decomposes Release Confidence into ten pillars, each independently scored 0–100, each mapped to one or more confidence dimensions (D1–D5), each with a weight and a blocking floor.
| # | Pillar | Dimension | Weight | Floor | Rationale for weight |
|---|---|---|---|---|---|
| P1 | Architecture Stability | D1, D2 | 0.12 | 40 | Coupling determines blast radius |
| P2 | Testing Confidence | D1 | 0.14 | 50 | Highest-volume evidence source |
| P3 | Automation Health | D1, D2 | 0.10 | 50 | Untrustworthy pipeline invalidates all signals |
| P4 | Deployment Readiness | D2, D4 | 0.11 | 40 | Progressive delivery caps blast radius |
| P5 | Observability | D3 | 0.15 | 60 | Highest weight: undetected failure is unbounded |
| P6 | Rollback Capability | D4 | 0.13 | 60 | Reversibility is the dominant risk control |
| P7 | Documentation | D3, D4 | 0.05 | 30 | Force-multiplier under incident conditions |
| P8 | Ownership | D3, D4 | 0.08 | 50 | Unowned change has no recovery path |
| P9 | Operational Readiness | D2, D3 | 0.07 | 40 | Capacity, quota, dependency posture |
| P10 | Business Readiness | D5 | 0.05 | 20 | Prevents technically-green business failures |
Weights sum to 1.00. Observability and Rollback Capability together carry 0.28 — more than testing and automation combined. This is deliberate and is the framework's principal departure from conventional quality models.
3.2 The composite score
                10
RCS_raw  =  Σ   wᵢ · sᵢ            (weighted pillar score, 0–100)
               i=1

RCS_time =  RCS_raw · e^(−VA/τ)     (apply confidence decay)

RCS      =  RCS_time · Π gᵢ         (apply blocking gates)

where gᵢ = 1        if sᵢ ≥ floorᵢ
           0.55     if sᵢ <  floorᵢ   (hard-capped, non-recoverable by other pillars)
The gate multiplier is the mechanism that prevents the single most common failure of composite scores: compensation. Without gates, a team with a superb test suite and zero observability scores 78 and ships. With gates, that same change is capped below the ship threshold regardless of how strong the other nine pillars are. You cannot buy your way out of blindness with test coverage.
3.3 Decision bands
| RCS | Band | Required action |
|---|---|---|
| 90–100 | Autonomous | Deploy automatically; no human in the loop; canary auto-promote |
| 75–89 | Progressive | Deploy behind progressive rollout with automated abort criteria |
| 60–74 | Supervised | Deploy with named owner online, manual promotion gates, reduced rollout ceiling |
| 40–59 | Remediate | Do not deploy; specific pillar deficits are the work item |
| < 40 | Blocked | Structural deficit; escalate to architecture/platform, not to the release |
Note what the bands do not say: nothing here says "get approval." Each band prescribes an engineering control, not a signature. This is the operational meaning of confidence-driven delivery.
3.4 The ten pillars in detail
P1 — Architecture Stability. Measures the structural predictability of the change's environment. Inputs: afferent/efferent coupling of touched modules, number of synchronous downstream dependencies in the request path, cyclic dependency presence, interface churn rate over trailing 90 days, presence of bulkheads/timeouts/circuit breakers on the changed path. A change to a leaf service with three async consumers scores very differently from a change to a synchronously-called shared library with forty dependents.
P2 — Testing Confidence. Not coverage. Coverage is an input; confidence is coverage weighted by relevance and reliability. Inputs: mutation score on changed lines, coverage of the diff (not the repo), contract test verification status against current consumer versions, flake rate of the suites that gated this change, presence of at least one test that would have caught the last three incidents in this component.
P3 — Automation Health. The trustworthiness of the evidence-producing machinery. Inputs: pipeline success rate excluding legitimate test failures, infrastructure-caused failure rate, median and p95 pipeline duration, retry rate, quarantine population size and age. A pipeline that engineers routinely re-run "because it's flaky" produces no evidence at all — it produces noise that has been laundered into a green checkmark.
P4 — Deployment Readiness. The mechanical capability to limit exposure. Inputs: progressive delivery strategy available and configured, canary analysis with automated abort criteria, flag coverage for the change, traffic-shaping capability, deployment-time blast radius estimate, concurrent-deploy conflict detection.
P5 — Observability. Scored on the changed path specifically, not on the platform generally. Inputs: instrumentation coverage of new/modified code paths, existence of an SLO or alert that would fire on this change's most likely failure mode, trace propagation completeness, log cardinality sufficient to attribute failures to this change, synthetic probe coverage, RUM coverage for user-facing paths, Mean Time To Detect measured, not assumed.
P6 — Rollback Capability. Inputs: rollback rehearsal recency for this service, rollback duration measured (not documented), schema/state forward-and-backward compatibility class, feature flag kill-switch coverage, data migration reversibility, whether rollback has ever been executed successfully in production for this component. A documented rollback procedure that has never been executed scores no higher than 40.
P7 — Documentation. Weighted low but floored, because documentation's value is asymmetric — near zero in steady state, enormous at 03:00. Inputs: runbook existence and recency, dependency map currency, alert-to-runbook linkage rate, decision record for the change's non-obvious choices.
P8 — Ownership. Inputs: single named accountable owner resolvable from the artifact, on-call rotation coverage for the affected service, escalation path validity (tested within 90 days), bus factor of the changed component, ownership record age. An unowned service cannot exceed the Supervised band by construction.
P9 — Operational Readiness. Inputs: headroom against capacity limits, quota and rate-limit posture with the change's projected load, dependency health and error budget status of downstreams, cost delta projection, licensing/compliance state, known concurrent maintenance events.
P10 — Business Readiness. Inputs: pre-registered success metric and guardrail metrics, support enablement status, communication plan for customer-visible change, contractual/regulatory gating, rollout sequencing versus commercial commitments.
3.5 Worked example
A schema migration adding a nullable column plus a backfill, in a service with heavy synchronous fan-in.
| Pillar | Score | Note |
|---|---|---|
| P1 Architecture | 45 | 22 synchronous dependents |
| P2 Testing | 80 | Strong diff coverage, contract tests green |
| P3 Automation | 85 | Stable pipeline, low flake |
| P4 Deployment | 70 | Progressive rollout available; backfill is not gated |
| P5 Observability | 55 | Backfill has no progress metric or saturation alert |
| P6 Rollback | 65 | Migration is backward compatible; backfill is not reversible |
| P7 Documentation | 60 | Runbook exists, migration section stale |
| P8 Ownership | 90 | Clear owner, on-call covered |
| P9 Operational | 50 | DB at 71% IOPS headroom before backfill |
| P10 Business | 70 | No customer-visible change |
RCS_raw = 67.6. Verification age 4h, τ = 12h → decay factor 0.72 → 48.7. P5 below floor (60) → ×0.55 → 26.8. Blocked.
The score is not the interesting output. The diagnosis is: this change is not blocked because it is bad. It is blocked because the backfill is an unobserved, irreversible operation against a database with limited headroom. The remediation is specific and small: add backfill progress and IOPS saturation metrics, add a throttled+resumable backfill with a pause switch, re-verify. Estimated cost: half a day. Estimated cost of the alternative: an unrecoverable production database saturation event during a backfill nobody can see or stop.
This is the framework's real product — not a number, but a targeted, cheap, pre-incident work item.
3.6 Practical recommendations
| # | Recommendation | Measurable outcome |
|---|---|---|
| 1 | Implement pillar scoring as pipeline-emitted evidence, not a questionnaire | 100% of pillar inputs machine-collected within two quarters |
| 2 | Set floors before weights; floors are the safety property | Zero deploys above Supervised band with a floor breach |
| 3 | Publish per-pillar scores, not just RCS | Teams remediate the deficit, not the aggregate |
| 4 | Recalibrate weights quarterly against incident causation data | Weight drift documented; model error tracked |
| 5 | Treat any pillar consistently below floor as a platform roadmap item | Structural deficits leave team backlogs |
3.7 KPIs introduced in this chapter
- Release Confidence Score (RCS) — composite 0–100, gated and decayed
- Pillar Deficit Count (PDC) — number of pillars below floor per release
- Gate Breach Rate (GBR) — % of attempted releases capped by a floor breach
- Confidence Compensation Index — RCS_raw ÷ RCS; how much score is being lost to gates
Chapter 4 — Confidence Begins Long Before Deployment
4.1 The Confidence Accrual Curve
Most release governance is concentrated in the final 5% of a change's lifecycle — the deployment gate. This is where the least confidence can be created and the most cost is incurred to create it.
We formalize the inverse relationship as the Confidence Accrual Curve: the cost of establishing one point of Release Confidence, as a function of lifecycle stage.
| Lifecycle stage | Relative cost per confidence point | Confidence ceiling attainable at this stage |
|---|---|---|
| Requirements & success criteria | 1× | 15 |
| Architecture & design review | 2× | 30 |
| Coding standards & type discipline | 3× | 20 |
| Code review | 5× | 15 |
| Automated verification | 8× | 25 |
| Pre-deploy gate | 40× | 5 |
| Post-deploy remediation | 200× | negative |
The final row is not hyperbole. Post-deploy remediation destroys confidence: it consumes the change budget, increases Verification Age on adjacent work, and adds to the Redeployment Tax.
The operational conclusion: an organization that wants higher release confidence should invest almost nowhere near the release.
4.2 Requirements as a confidence artifact
A requirement that does not specify how success will be observed cannot produce outcome confidence (D5). We recommend a minimal, enforceable structure — the Verifiable Intent Record (VIR) — attached to any change above trivial size:
- Intent — the business outcome, in one sentence, with a directional metric.
- Success signal — the specific metric, its instrumentation status, and the expected magnitude and time window of change.
- Guardrail signals — metrics that must not degrade, with thresholds.
- Failure hypothesis — the most likely way this change breaks production, stated in advance.
- Reversal condition — the observable condition under which this change should be reverted, defined before deploy.
Items 4 and 5 are the highest-value and most commonly absent. A team that cannot state, before deploying, what would make them roll back has no rollback decision procedure — it has a rollback argument, to be conducted live, during an incident, under executive attention.
The failure hypothesis has a second use: it is a test-generation prompt. "The most likely way this breaks" should have a corresponding automated check in the majority of cases.
4.3 Architecture review as risk pricing
Design review in most organizations is a correctness review. It should be a risk-pricing exercise. The reviewer's question is not "is this right?" but "what does this change cost us in confidence terms, and is that price justified?"
Five questions convert a design review into a confidence instrument:
- Blast radius: what is the maximum set of users/services affected by the worst realistic failure of this design?
- Reversibility class: is this Type-R (reversible in minutes), Type-C (compensatable), or Type-I (irreversible — data destruction, external side effects, published contracts)?
- Detection path: what signal changes first when this fails, and does that signal exist today?
- Coupling delta: does this design increase or decrease synchronous coupling?
- State compatibility: can version N and N+1 coexist in production simultaneously? If not, the design has mandated a coordinated deploy, which is a confidence liability.
The Type-I designation deserves special weight. Irreversible operations should be architecturally rare, explicitly enumerated, and separately governed. Most catastrophic release outcomes are not caused by bugs; they are caused by bugs in irreversible operations. The engineering discipline is to convert Type-I to Type-C wherever possible: soft delete instead of delete, dual-write instead of cutover, expand-migrate-contract instead of alter-in-place, staged external notification instead of immediate.
4.4 Coding standards as automated confidence
Standards that require human enforcement do not produce confidence; they produce review latency and inconsistency. The confidence-relevant question for any standard is: is it mechanically checkable?
High-yield, mechanically enforceable standards ranked by confidence contribution:
| Standard | Confidence dimension | Enforcement |
|---|---|---|
| Strict typing / null-safety at boundaries | D1 | Compiler, CI |
| Mandatory timeout + retry policy on all outbound calls | D2 | Lint rule, service mesh policy |
| Structured logging with correlation ID propagation | D3 | Lint rule, framework default |
| Feature-flag wrapping for behaviour-changing code | D4 | Static analysis on diff |
| Backward-compatible schema change patterns only | D4 | Migration linter, CI gate |
| Explicit error taxonomy (retryable/terminal/degraded) | D2, D3 | Type system, lint |
| No unbounded queries or unpaginated collection reads | D2 | Query analyzer in CI |
Each of these is worth more than a style guide chapter. The pattern is consistent: the standards that raise confidence are the ones that constrain runtime behaviour, not source formatting.
4.5 Code review as evidence, not ritual
Review is the most expensive evidence-production mechanism per unit of confidence (5× baseline) and the most variable in quality. Three measurable changes improve its yield:
Route by risk, not by round-robin. A diff touching a Type-I operation, a shared library, or an authentication path should route to reviewers with demonstrated expertise. A copy change should require none. Uniform review policy is a confidence-allocation failure.
Measure review depth, not review count. Approvals per hour, comments per hundred lines changed, and time-to-first-substantive-comment are all computable. A reviewer with a median approval latency of 40 seconds on 400-line diffs is generating an audit artifact, not evidence.
Require the failure hypothesis in the review. The reviewer's most valuable contribution is often "you've stated the failure mode as X; I think it's actually Y, and Y isn't instrumented."
4.6 Documentation and automation as confidence infrastructure
Two asymmetries govern investment here.
Documentation is worthless in steady state and decisive in incident state. Therefore document exactly what is needed under incident conditions — the runbook, the dependency map, the rollback procedure, the decision record — and stop. Comprehensive documentation programs fail because they optimize the wrong state.
Automation is the only confidence source with decreasing marginal cost. Every other source (review, manual QA, approval) costs the same each time. A verification automated once produces evidence for every subsequent change at near-zero marginal cost. This is why P3 (Automation Health) is floored: the moment automation becomes untrustworthy, the organization loses its only cost-decreasing evidence source and reverts to linear-cost human verification.
4.7 Practical recommendations
| # | Recommendation | Measurable outcome |
|---|---|---|
| 1 | Mandate the Verifiable Intent Record for all non-trivial changes | VIR completeness rate > 85% |
| 2 | Classify every design as Type-R / Type-C / Type-I at review | Type-I inventory maintained; count trending down |
| 3 | Convert three manual standards to automated checks per quarter | Manual review comment categories decline measurably |
| 4 | Route reviews by risk class | Median review depth on high-risk diffs > 3× low-risk |
| 5 | Publish the Confidence Accrual Curve to leadership | Investment shifts left; pre-deploy gate spend declines |
4.8 KPIs introduced in this chapter
- Shift-Left Confidence Ratio (SLCR) — % of total RCS earned before the pre-deploy gate; target > 80%
- Type-I Exposure Count — number of irreversible operations in the release
- Review Depth Index (RDI) — substantive comments per 100 changed lines, by risk class
- Failure Hypothesis Coverage — % of changes with a stated and instrumented failure hypothesis
Chapter 5 — Engineering Signals That Build Confidence
5.1 Signal quality: the four-property test
Not all evidence is confidence-bearing. Before a signal is admitted to the scoring model, it must satisfy four properties:
| Property | Test | Failure example |
|---|---|---|
| Relevance | Does it exercise the changed behaviour? | 90% repo coverage, 0% diff coverage |
| Reliability | Does the same input produce the same verdict? | 8% flake rate |
| Timeliness | Was it produced within 0.5τ? | Nightly suite gating a same-day deploy |
| Actionability | Does a failure identify a specific defect? | "Pipeline red" with no attribution |
A signal failing any property should be excluded from the score, not down-weighted. Including unreliable evidence is worse than including none: it manufactures unearned confidence, which is precisely the failure mode the framework exists to prevent.
"A flaky test is not a weak signal. It is a signal generator that has been disconnected from reality and left running."
5.2 Test coverage: the wrong denominator
Repository-level coverage is a legacy metric optimized for reporting rather than risk. Three replacements:
Diff coverage. Coverage of lines changed in this release. This is the only coverage number correlated with this release's risk. Target: > 85%, with exemptions requiring justification recorded in the VIR.
Mutation score on the diff. Coverage proves execution; mutation proves assertion. A test suite that executes a line without any assertion that would fail if the line's behaviour inverted provides zero correctness confidence. Mutation testing on the diff only (rather than the full repo) makes this computationally tractable — typically seconds to a few minutes.
Incident regression coverage. For each of the last N production incidents in this component, does a test now exist that would have caught it? This converts incident history into a measurable, monotonic confidence asset. Target: 100% for Sev1/Sev2 within 30 days of the postmortem.
5.3 Flaky tests as a confidence tax
Flakiness is usually treated as an annoyance. It is a quantifiable degradation of the entire evidence system.
Effective Suite Confidence = (1 − f)^n

f = per-test flake probability
n = number of tests gating the change
At f = 0.001 with n = 5,000 tests, the probability of a clean run from a correct change is ~0.7%. The suite will be red almost always, engineers will develop re-run reflexes, and the suite ceases to gate anything. Flakiness does not degrade the suite proportionally — it degrades it exponentially in suite size. This is why large organizations experience sudden, apparently inexplicable collapses in pipeline trust: they crossed a threshold.
Operating discipline:
- Quarantine automatically on detection (same test, same commit, differing verdicts).
- Quarantine has a TTL — 14 days, after which the test is deleted, not indefinitely disabled. A permanently quarantined test is an unmaintained liability that implies coverage it does not provide.
- Quarantine population is a scored input to P3. If more than 2% of the suite is quarantined, Automation Health cannot exceed 60.
- Never permit blanket retries at the job level. Retry at the test level with explicit flake attribution, so the flake rate remains measurable.
5.4 Static analysis, security, and dependency health
These share a common failure mode: alert volume without prioritization destroys the signal. A dependency scanner reporting 400 vulnerabilities produces less confidence than one reporting the four that are reachable from executed code paths.
The confidence-relevant refinements:
- Reachability analysis over raw CVE counts. A vulnerability in an unreachable transitive dependency is a compliance item, not a risk item. Conflating them exhausts the team's attention budget.
- Delta-based gating. Gate on new findings introduced by the diff, not on the total backlog. Total-backlog gates are unshippable on day one and are therefore universally bypassed, which trains bypass behaviour.
- Dependency freshness distribution, not average. One dependency 900 days stale is a larger risk than fifty dependencies 30 days stale.
- Supply chain provenance: build attestation, signed artifacts, lockfile integrity. This is a binary contributor to P3 — unsigned or non-reproducible artifacts cap Automation Health.
5.5 API contracts and consumer verification
In a distributed system, the highest-frequency cause of change failure is not a bug inside a service — it is a valid change to a service that violates an assumption held by a consumer nobody consulted.
Contract testing addresses this directly and is under-adopted relative to its confidence yield.
| Approach | Confidence yield | Cost | When to use |
|---|---|---|---|
| Consumer-driven contract tests | High | Medium | Internal service-to-service |
| Schema registry with compatibility enforcement | High | Low | Event/message streams |
| Provider-side spec conformance (OpenAPI/protobuf) | Medium | Low | Public APIs |
| Traffic shadowing / replay against production requests | Very high | High | High-risk, high-traffic paths |
| Integration environment | Low | Very high | Rarely justified |
The last row deserves emphasis. Shared integration environments are the most expensive and least reliable confidence source in common use: they are perpetually broken, they never match production, their failures are rarely attributable, and their maintenance cost scales superlinearly with service count. Most organizations would gain confidence by replacing the integration environment with contract testing plus production traffic shadowing, at lower total cost.
5.6 Performance validation and capacity
Performance regressions are the archetypal slow failure — invisible at deploy, catastrophic at peak.
- Gate on p99 and p99.9, not mean. Mean latency is insensitive to exactly the tail behaviour that causes user-visible failure and cascading timeout amplification.
- Test against a load profile derived from production traffic shape, including its burstiness. Synthetic uniform load systematically underestimates queueing effects.
- Measure resource-per-request deltas (CPU-seconds, allocations, DB round-trips, bytes egressed) rather than absolute latency, which is environment-dependent. A change that doubles DB round-trips per request is a regression even if latency looks fine at test load — it is a latent capacity failure that manifests only at peak.
- Soak tests catch what load tests cannot: leaks, unbounded caches, connection pool exhaustion, log volume growth, cursor accumulation.
5.7 Chaos experiments as detection and recovery evidence
Chaos engineering is frequently mis-sold as a resilience improvement practice. Its primary confidence contribution is as an evidence-production practice for D3 and D4: it is the only way to verify that detection and recovery mechanisms function under the conditions where they are needed.
An experiment produces a scored input when it is structured as a hypothesis test:
Steady state:  checkout success rate ≥ 99.5%, p99 ≤ 800ms
Hypothesis:    if the recommendation service returns 100% errors,
               steady state is maintained
Fault:         inject 100% 5xx from recommendations, 5% of traffic, 10 min
Abort:         checkout success rate < 99.0%
Result:        steady state / degraded / violated
Confidence output: dependency isolation verified for this path (P1, P9)
Recommended progression: dependency failure → dependency latency (usually worse than failure, because timeouts are often misconfigured) → instance loss → zone loss → dependency partial failure (the most realistic and least tested) → data-layer degradation.
A note on the highest-value experiment few teams run: deliberately breaking a service without telling the on-call team, then measuring time-to-detect against the alert's design target. This measures D3 directly and typically reveals that measured MTTD is several multiples of assumed MTTD.
5.8 Compliance as a confidence input
In regulated contexts, compliance checks belong in the score rather than in a parallel process, for one reason: parallel processes create batch pressure. If compliance verification is a separate, slow, human workflow, teams batch changes to amortize it — increasing blast radius and reducing confidence. Encoding compliance as automated policy checks (policy-as-code, evidence generation from pipeline artifacts, immutable audit trails) removes the batching incentive and converts a confidence drag into a confidence contributor.
5.9 Practical recommendations
| # | Recommendation | Measurable outcome |
|---|---|---|
| 1 | Replace repo coverage with diff coverage + diff mutation score | Both reported per PR; mutation score > 70% |
| 2 | Auto-quarantine with 14-day TTL and deletion | Quarantine population < 2% and non-aging |
| 3 | Gate on new findings only; reachability-filter dependency alerts | Alert volume down >70%; bypass rate → 0 |
| 4 | Replace shared integration environments with contract tests + shadowing | Integration env cost eliminated; contract verification > 90% of interfaces |
| 5 | Run one unannounced detection experiment per service per quarter | Measured MTTD published per service |
5.10 KPIs introduced in this chapter
- Effective Suite Confidence (ESC) — (1 − f)^n
- Diff Mutation Score (DMS) — % of mutants killed on changed lines
- Incident Regression Coverage (IRC) — % of past Sev1/2 with a covering test
- Reachable Vulnerability Count (RVC) — CVEs reachable from executed paths
- Measured MTTD — detection latency observed under injected fault, per service
Chapter 6 — Deployment Readiness
6.1 Deployment strategy as a confidence multiplier
Pre-deployment evidence establishes a prior. Deployment strategy determines the cost of being wrong. These are separable, and the second is frequently cheaper to improve.
We express this as the Exposure Function:
Expected Loss = P(failure) × Blast Radius × Time to Detect × Time to RecoverEvery deployment strategy is an intervention on one or more terms. Testing reduces P(failure) — and it is the only term testing touches. Progressive delivery reduces Blast Radius. Observability reduces Time to Detect. Rollback automation reduces Time to Recover.
Because the terms multiply, the highest return is always on the largest term, and in most organizations the largest terms are detection and blast radius, not defect probability. An organization that has spent five years improving test coverage while leaving blast radius at 100% and detection at 30 minutes has been optimizing the smallest factor in the product.
6.2 Strategy comparison
| Strategy | Blast radius control | Detection window | Rollback cost | State/schema burden | Best fit |
|---|---|---|---|---|---|
| Recreate | None (100%) | Post-deploy only | Full redeploy | Low | Batch systems, dev |
| Rolling | Partial, uncontrolled | During rollout | Slow drain | Requires N/N+1 coexistence | Stateless services, low risk |
| Blue/Green | Binary (0% or 100%) | Pre-cutover smoke only | Very low (traffic switch) | High (shared data layer) | Fast reversal, regulated cutover |
| Canary | Precise (1%→100%) | Continuous, statistical | Low | Requires coexistence | Default for user-facing services |
| Feature flags | Per-user/segment/attribute | Continuous | Near-zero (flag flip) | Code-level complexity | Behaviour change, experimentation |
| Shadow / dark launch | Zero (no user impact) | Full, pre-exposure | N/A | Requires idempotency | High-risk rewrites, migrations |
| Progressive delivery | Composite, policy-driven | Continuous + automated | Automated | Highest platform investment | Confidence-driven target state |
A structural point often missed: Blue/Green and Canary solve different problems and are not substitutes. Blue/Green optimizes reversal speed; Canary optimizes exposure limitation. Blue/Green with a shared database provides no protection whatsoever against data-layer defects — the most common source of unrecoverable incidents. Organizations that adopted Blue/Green as their "safe deployment" answer often have less protection than they believe.
6.3 Canary analysis that produces evidence
Manual canary observation is a confidence placebo. A human watching a dashboard for ten minutes cannot detect a 0.4% error-rate increase, and that is exactly the regression class that matters at scale.
Automated canary analysis requires:
- Paired baseline. Compare canary against a concurrently running baseline of the old version receiving equivalent traffic — not against historical data, which confounds diurnal, deploy-day, and traffic-mix effects.
- Statistical criteria with power analysis. The rollout duration must be long enough to detect the minimum regression worth detecting at the canary's traffic share. If 1% traffic for 5 minutes yields 200 requests, the canary can only detect catastrophic regressions and provides false assurance for everything else. Canary duration should be derived, not chosen by habit.
- Metric classes: system (error rate, latency percentiles, saturation), business (conversion, transaction success), and guardrail (cost per request, downstream error rate).
- Automated abort with no human in the loop. If abort requires a human decision, the recovery time includes human response latency, which dominates.
- Sticky assignment. Users flipping between versions mid-session produce both corrupted metrics and genuinely broken experiences.
6.4 Feature flags: confidence asset and confidence liability
Feature flags are the highest-leverage deployment control available, and the most commonly mismanaged.
As an asset: flags decouple deploy from release, converting a deployment decision into a runtime decision. Recovery time drops from a redeploy cycle to a propagation interval. Blast radius becomes an addressable segment. Deploys become genuinely boring.
As a liability: every flag is a branch in production behaviour. n flags create up to 2ⁿ possible states, of which the pipeline tests a handful. Untested flag combinations are a well-documented source of severe incidents, particularly where flags interact through shared state.
Governance that preserves the asset:
- Every flag has an owner and a scheduled expiry at creation. No expiry, no flag.
- Flag debt is a scored input. Flags older than 90 days past their intent are counted; a high count reduces P1 and P4.
- Kill-switch flags are a distinct class — they are permanent by design, must be tested on a schedule, and must be independently verified to actually work under load. An untested kill switch is worse than no kill switch, because it produces a recovery plan that fails at the moment of use.
- Test the flag states you will actually run: current production state, target state, and the rollback state. Combinatorial testing of all states is neither possible nor necessary; testing the three states on the rollout path is both.
6.5 Rollback automation
Rollback capability is scored on execution evidence, not documentation. The relevant measurements:
| Measurement | Target | Why |
|---|---|---|
| Rollback rehearsal recency | ≤ 30 days | Procedures rot silently |
| Measured rollback duration (p95) | ≤ 5 min | Constrains Time to Recover term |
| Rollback success rate in rehearsal | 100% | Anything less is a false recovery plan |
| Automated rollback trigger coverage | ≥ 80% of services | Removes human latency |
| State-compatible version window | ≥ 2 versions | Enables rollback after subsequent deploys |
That last row is the most frequently violated. Many organizations can roll back the previous deploy but not the one before it, because schema or state has advanced. Under incident conditions — where the causal deploy is often not the most recent one — this constraint is discovered at the worst possible moment.
6.6 The Change Risk Score
Deployment controls should be selected by risk, not applied uniformly. The Change Risk Score (CRS) provides the routing input:
CRS = (B × C × N × I) / R

B = Blast radius factor       (1 = single tenant … 5 = all users)
C = Coupling factor           (1 = leaf … 5 = shared synchronous dependency)
N = Novelty factor            (1 = routine pattern … 5 = never done before)
I = Irreversibility factor    (1 = Type-R … 5 = Type-I)
R = Recovery capability (1 = manual, hours … 5 = automated, seconds)| CRS | Class | Required deployment controls |
|---|---|---|
| < 3 | Routine | Automated rollout, no gate |
| 3–8 | Standard | Canary with automated analysis |
| 9–20 | Elevated | Canary + flag + owner online + reduced rollout ceiling |
| 21–50 | High | Shadow phase, staged rollout over ≥ 24h, rehearsed rollback within 7 days |
| > 50 | Critical | Dedicated release plan, standing recovery bridge, external comms prepared |
Note that R is a divisor. Improving recovery capability reduces required ceremony across the entire change portfolio. This is the mathematical statement of a cultural claim: investing in reversibility buys speed everywhere.
6.7 Practical recommendations
| # | Recommendation | Measurable outcome |
|---|---|---|
| 1 | Derive canary duration from statistical power, not convention | Documented minimum detectable effect per service |
| 2 | Require concurrent paired baselines for all canary analysis | Zero historical-comparison canaries |
| 3 | Enforce flag expiry at creation; score flag debt | Flags past expiry < 5% of total |
| 4 | Rehearse rollback monthly; publish measured duration | p95 rollback duration reported per service |
| 5 | Route deployment controls by CRS automatically | 100% of releases classified; ceremony correlates with risk |
6.8 KPIs introduced in this chapter
- Change Risk Score (CRS) — computed risk routing value
- Rollback Readiness Index (RRI) — composite of rehearsal recency, measured duration, success rate, version window
- Blast Radius Ceiling (BRC) — maximum % of users exposed before automated abort
- Flag Debt Ratio (FDR) — expired flags ÷ total flags
- Minimum Detectable Effect (MDE) — smallest regression the canary can detect at configured traffic and duration
Chapter 7 — Observability Creates Confidence
7.1 The asymmetry that justifies the weighting
Observability carries the highest pillar weight (0.15) and one of two highest floors (60). The justification is structural.
An undetected failure has unbounded cost. Its duration is limited only by the time until a customer complains, which is a function of customer patience rather than engineering capability. A detected failure has cost bounded by detection plus recovery time — quantities the organization controls.
Cost(undetected) = severity × (time to customer report + escalation + diagnosis + recovery)
Cost(detected)   = severity × (MTTD + MTTR)
For a typical enterprise system, the first expression is commonly 10–50× the second for the same underlying defect. This is why detection investment outperforms prevention investment beyond a moderate quality baseline. It is also why "we have great tests" is not a substitute for instrumentation: tests reduce P(failure), which is one multiplicative term; observability reduces two.
7.2 Observability is not three pillars — it is a question-answering capability
The "three pillars" framing (logs, metrics, traces) describes data types, not capability. A system with all three telemetry types can still be unobservable if it cannot answer the questions that arise during an incident.
The confidence-relevant test is the Question Coverage Test. For the change being deployed, can the system answer, without deploying new code:
- Is this change causing errors? (attribution to version)
- Which users/tenants/segments are affected? (dimensionality)
- Is the failure in this service or a dependency? (trace completeness)
- When did this begin, and does it correlate with the deploy? (deploy annotation)
- Is it degrading or stable? (rate of change)
- What is the business impact? (business metric linkage)
- Would the previous version behave differently? (baseline retention)
An observability stack that cannot answer all seven for a given change scores below the P5 floor regardless of how much telemetry it collects. Volume of telemetry and observability are only weakly correlated; cardinality and correlation are what produce answers.
7.3 The observability stack, by confidence contribution
| Layer | Primary question answered | Confidence dimension | Common deficiency |
|---|---|---|---|
| Structured logs | What exactly happened in this request? | D3 | Unstructured, no correlation ID, sampled away at the tail |
| Metrics / time series | Is aggregate behaviour changing? | D3 | Averages instead of percentiles; no version label |
| Distributed tracing | Where in the call graph is the problem? | D3 | Incomplete propagation; head-based sampling discards errors |
| Synthetic monitoring | Does the critical path work right now? | D3 | Probes the homepage, not the revenue path |
| Real user monitoring | What are users actually experiencing? | D3, D5 | Absent; server-side metrics assumed sufficient |
| Profiling (continuous) | Why is it slow/expensive? | D2 | Only enabled during incidents |
| Business telemetry | Is the outcome being achieved? | D5 | Lives in analytics, latency measured in hours |
| Deploy/change events | What changed just before this? | D3 | Not correlated with telemetry |
Two of these deserve elevation.
Deploy annotation is the highest ratio of confidence-per-engineering-hour in the entire stack. Emitting a structured event on every deploy, config change, and flag flip — and overlaying those events on every dashboard — collapses the diagnosis phase of most incidents from tens of minutes to seconds. Change is the cause of most incidents; correlating telemetry with change is therefore the highest-yield correlation available. It is typically a few days of work.
Real user monitoring closes the gap between "the service is healthy" and "the product works." Server-side metrics cannot see client-side rendering failures, CDN issues, third-party script failures, or regional network degradation. A release can be perfectly healthy by every server metric while being broken for a quarter of users.
7.4 Alerting: from noise to confidence
Alert quality is measurable, and most organizations do not measure it.
| Metric | Definition | Target |
|---|---|---|
| Alert precision | Alerts requiring action ÷ total alerts | > 0.8 |
| Alert recall | Incidents preceded by an alert ÷ total incidents | > 0.9 |
| Runbook linkage | Alerts with a linked, current runbook ÷ total | 1.0 |
| Time to human acknowledgement | p95 | < 5 min |
| Alert-to-service attribution | Alerts resolvable to an owning team without triage | 1.0 |
Recall is the metric that matters for release confidence, and it is almost never measured. It is computable directly from postmortem data: for each incident, was there an alert, and did it fire before the first human report? An organization with recall of 0.5 is discovering half its incidents from customers — meaning half of its production failures have unbounded cost by the model in §7.1.
Alerting should follow symptom-based, SLO-derived design: alert on user-visible symptom violations and error budget burn rate, not on individual resource conditions. Cause-based alerts (CPU high, disk filling) belong in dashboards and capacity workflows, not in pages. Multi-window burn-rate alerting (fast burn for acute, slow burn for chronic) is the mature form.
7.5 Instrumentation as a release gate
The P5 pillar is scored per change, which requires a specific and enforceable rule:
New or modified code paths must be observable before they are deployed, not after they fail.
Mechanically:
- Static analysis identifies new code paths lacking instrumentation.
- Every new endpoint, consumer, or scheduled job requires a success/failure metric and a latency histogram at creation. This is enforceable via framework defaults, which is preferable to enforcement via review.
- Every change with a stated failure hypothesis (§4.2) requires a signal that would reveal that failure mode. If the hypothesis is "the backfill saturates the database," a backfill progress metric and an IOPS saturation alert are release prerequisites, not follow-up tickets.
- Business-critical changes require the outcome metric to be instrumented and verified emitting before the change ships. Discovering after the rollout that the success metric was never wired up is a common and entirely preventable failure of D5.
7.6 Incident dashboards
An incident dashboard has one job: reduce time-to-orientation. It is not an analysis tool. Design constraints that follow:
- One screen, no scrolling. Scrolling during an incident is time lost.
- Top row is user impact, always: request success rate, critical-journey success, active affected users.
- Deploy/flag/config events overlaid on every time series, with the last four hours visible by default.
- Dependency health matrix immediately below impact.
- Explicit "is it us?" indicator: comparison against upstream provider status and adjacent service error rates.
- Links, not embeds, to deeper tools — traces, logs, profiles — pre-filtered to the incident window.
The test: a competent engineer who has never seen this service should be able to determine, in under 60 seconds, whether there is user impact, whether it correlates with a change, and which team owns the failing component.
7.7 Practical recommendations
| # | Recommendation | Measurable outcome |
|---|---|---|
| 1 | Emit structured deploy/config/flag events; overlay on all dashboards | 100% dashboard coverage; diagnosis phase duration ↓ |
| 2 | Measure and publish alert recall from postmortem data | Recall > 0.9 within two quarters |
| 3 | Enforce instrumentation of new code paths via framework defaults | Instrumentation gap on new paths → 0 |
| 4 | Deploy RUM on all customer-facing surfaces | Client-side-only failure class becomes detectable |
| 5 | Adopt SLO burn-rate alerting; retire cause-based pages | Alert volume ↓ >50%; precision > 0.8 |
7.8 KPIs introduced in this chapter
- Observability Coverage Index (OCI) — % of critical paths passing the seven-question test
- Alert Recall — incidents preceded by an alert ÷ total incidents
- Alert Precision — actionable alerts ÷ total alerts
- Change Correlation Latency — time from symptom detection to change attribution
- Customer-Reported Incident Ratio (CRIR) — incidents first reported by customers ÷ total
Chapter 8 — Measuring Release Confidence
8.1 Design principles for confidence metrics
Before defining the KPI set, four constraints. A confidence metric must be:
- Computable without human input. Any metric requiring a survey or a form will be gamed, stale, or absent within two quarters.
- Attributable to a change, a service, and a team. Organization-level aggregates cannot drive action.
- Falsifiable against outcomes. Every predictive metric must have a corresponding realized-outcome metric.
- Resistant to the obvious gaming strategy. For each metric below, we state the gaming vector explicitly, because unstated gaming vectors become organizational strategy.
8.2 The ten core KPIs
1. Release Confidence Score (RCS) — 0–100 Defined in §3.2. The composite decision metric. Gaming vector: inflating pillar inputs (coverage without assertions, alerts that never fire). Countermeasure: calibration (§8.3) and mutation/recall metrics that measure assertion strength rather than presence.
2. Deployment Stability Index (DSI) — 0–1
DSI = (D − (R + H + I)) / D
D = total deploys, R = rollbacks, H = hotfixes within 24h, I = incident-causing deploys
The realized counterpart to RCS. Where change failure rate counts only incidents, DSI counts all forms of "we had to touch it again." Target > 0.90. Gaming vector: reclassifying hotfixes as features. Countermeasure: classify by time-since-parent-deploy and code proximity, automatically.
3. Rollback Probability (RP) — 0–1 A model-estimated probability that this specific change will be rolled back, trained on historical features: CRS inputs, diff size, files touched, author familiarity with the component, time since last deploy of this service, concurrent deploy density, pillar scores. Even a simple logistic model materially outperforms intuition, and its feature weights are themselves a diagnostic of what actually predicts failure in this organization.
4. Automation Reliability (AR) — 0–1
AR = 1 − (infrastructure_failures + flaky_failures) / total_pipeline_runsMeasures whether the evidence machinery is trustworthy. Below 0.95, engineers begin re-running rather than investigating, and all downstream signals degrade.
5. Observability Coverage Index (OCI) — 0–100 % of critical paths passing the seven-question test (§7.2), weighted by traffic and revenue exposure.
6. Production Readiness Score (PRS) — 0–100 A per-service standing score: SLOs defined, error budget policy active, runbooks current, on-call coverage, capacity headroom, dependency map current, DR tested, data retention compliant. Distinct from RCS: PRS is a property of the service, RCS is a property of the change. A high-PRS service raises the confidence floor for every change it receives.
7. Change Risk Score (CRS) — unbounded, banded Defined in §6.6. The routing metric.
8. Operational Readiness Ratio (ORR) — 0–1 % of releases deployed into an environment meeting all operational preconditions: no concurrent maintenance, dependencies within error budget, capacity headroom above threshold, on-call staffed, no active Sev1/2. Deploying into a degraded environment is a well-known and easily prevented incident amplifier.
9. Incident Prediction Index (IPI) — 0–100 Forward-looking composite: RP, PRS, error budget burn trajectory, dependency instability, flag debt, quarantine population, Verification Age distribution, and team on-call load. IPI is intended as a fleet metric — it answers "which services are most likely to hurt us next month," which is a platform-roadmap input, not a release gate.
10. Engineering Trust Score (ETS) — 0–100 The one metric that is deliberately human-sourced, because it measures something no telemetry captures: whether engineers believe the system. Collected as a short, frequent, anonymous instrument:
- Would you deploy this service on a Friday afternoon?
- If this deploy failed, do you know how to roll it back without asking anyone?
- Do you trust a green pipeline?
- Would you be comfortable being on call for this service next week?
ETS is a leading indicator of measured reliability by roughly one to two quarters. A divergence where RCS is high and ETS is low is the most diagnostically valuable signal in the framework: it means the scoring model is measuring the wrong things, and the engineers know it. Investigate the model, not the engineers.
8.3 Calibration: the step that makes the score real
A confidence score that is never validated is astrology with a CI pipeline. Calibration is mandatory.
For each release, record predicted confidence and realized outcome. Bucket predictions and compare:
| Predicted RCS band | Predicted success rate | Observed success rate | Calibration error |
|---|---|---|---|
| 90–100 | 0.97 | 0.94 | −0.03 (slightly overconfident) |
| 75–89 | 0.90 | 0.91 | +0.01 (well calibrated) |
| 60–74 | 0.80 | 0.66 | −0.14 (materially overconfident) |
| 40–59 | 0.65 | 0.62 | −0.03 |
The Calibration Error in the Supervised band above is the actionable finding: the model believes supervision compensates for weak evidence, and it does not. The correct response is to re-weight, tighten the band's controls, or raise the floor — not to exhort teams to be more careful.
Two derived metrics:
- Brier Score — mean squared error of probabilistic predictions; the single-number summary of model quality. Track it monthly.
- Overconfidence Ratio (OCR) — predicted success rate ÷ observed success rate. Values > 1.05 mean the organization is systematically shipping on unearned confidence.
"An uncalibrated confidence score does not reduce risk. It relocates risk from the engineer's judgement to a number nobody validated."
8.4 What to put on the executive dashboard
Executives should see four numbers, not thirty:
- RCS distribution (median and 10th percentile across releases) — are we shipping on evidence?
- DSI — did that evidence hold?
- Overconfidence Ratio — is our measurement honest?
- ETS — do the people closest to the system believe it?
Deployment frequency belongs on this dashboard only when paired with Redeployment Tax.
8.5 Practical recommendations
| # | Recommendation | Measurable outcome |
|---|---|---|
| 1 | Log predicted RCS and realized outcome for every release | Calibration table produced monthly |
| 2 | Publish Brier score and Overconfidence Ratio to engineering leadership | OCR within 0.95–1.05 |
| 3 | Run the ETS instrument quarterly, per service, anonymously | ETS trend per service; divergence investigated |
| 4 | Separate PRS (service) from RCS (change) in tooling | Platform work targets low-PRS services |
| 5 | Document a gaming vector and countermeasure for every metric adopted | Metric-gaming reviews at quarterly recalibration |
Chapter 9 — The Economics of Confidence
9.1 The cost model of a failed release
Most organizations account for incidents in engineering hours. That is a small fraction of the real cost. The full ledger:
| Cost category | Typically measured? | Relative magnitude |
|---|---|---|
| Direct engineering response (detect, diagnose, fix, verify) | Yes | 1× (baseline) |
| Opportunity cost of diverted engineers | Rarely | 1–2× |
| Context-switch recovery for the whole team | No | 0.5–1× |
| Customer support volume and escalation handling | Sometimes | 0.5–3× |
| Revenue loss during degradation | Sometimes | 0–20× |
| SLA credits and contractual penalties | Yes | 0–5× |
| Churn attributable to reliability perception | No | 0–15× (lagging) |
| Sales cycle friction from reliability reputation | No | Unmeasured, material in B2B |
| Trust tax: added process, freezes, approvals | No | Persistent, compounding |
| On-call attrition and rehiring | No | Very high, delayed |
The final three rows are where the real money is, and none of them appear in an incident retro. The Trust Tax is the most insidious: every serious incident tends to produce a permanent process addition, which permanently reduces delivery throughput. A single Sev1 can cost more in permanent added ceremony than in the incident itself.
9.2 Deployment speed vs. Release Confidence: the economic comparison
| Dimension | Optimize for speed only | Optimize for confidence |
|---|---|---|
| Deploy frequency | High initially, degrades | High and sustained |
| Redeployment Tax | Rises toward 0.3–0.5 | Stable below 0.10 |
| Incident cost trajectory | Superlinear with scale | Sublinear with scale |
| Batch size | Grows (freeze-driven) | Shrinks |
| Process weight | Grows after each incident | Stable; controls are automated |
| On-call load | Rises; attrition follows | Falls |
| Innovation capacity | Consumed by remediation | Preserved |
| Time to onboard a new engineer | Long (tribal recovery knowledge) | Short (automated controls) |
| Customer-perceived reliability | Volatile | Predictable |
| Cost per deploy (fully loaded) | Rises | Falls |
The key asymmetry: speed-only optimization has decreasing returns and increasing costs; confidence optimization has increasing returns and decreasing costs. Automated controls, once built, apply to every subsequent change at zero marginal cost. Manual heroics apply to one incident.
9.3 Confidence and developer productivity
The productivity effect operates through three channels, none captured by output metrics:
Cognitive load. An engineer deploying into a system with unclear rollback and weak observability carries the entire risk model in their head. This is expensive attention, and it is drawn from the same budget as design thinking.
Interrupt cost. A team absorbing a high volume of production interrupts loses substantially more than the interrupt duration; deep-work recovery time dominates. Teams that spend a large share of the week in reactive mode do not produce architecture — they produce patches.
Decision latency. Where confidence is low, decisions escalate. Escalation is the most expensive form of decision-making: it costs senior attention, adds days of latency, and produces worse decisions because the decider is furthest from the evidence.
The composite effect is that low-confidence organizations are not merely riskier — they are structurally slower at exactly the work that would make them faster.
9.4 The investment case
A confidence program competes for funding against features. The argument that works is not "reliability matters." It is arithmetic:
Annual value = (ΔDSI × deploys/yr × fully-loaded cost per failure)
             + (ΔTrust Tax: process hours removed × loaded rate)
             + (retained revenue: Δchurn × ARPU × affected accounts)
             + (recovered capacity: interrupt hours × loaded rate)
             − program cost (platform engineering + tooling)
Two practical notes. First, the fully-loaded cost per failure should be computed once, carefully, using the ledger in §9.1, and then reused. Most organizations discover it is 3–8× their assumed figure, and the investment case becomes trivial. Second, the Trust Tax term is the one executives find most persuasive, because it converts reliability investment into throughput recovery — a growth argument rather than a defensive one.
9.5 Confidence and customer trust
Customers do not experience deployment frequency. They experience variance. A product that is reliably good is preferred to one that is occasionally excellent and periodically broken, at equal average availability — the loss is asymmetric and the memory is long.
This is why the correct external reliability target is not maximum uptime but minimum surprise. Progressive delivery, canary abort, and instant rollback are, viewed commercially, mechanisms for reducing the variance of customer experience.
"Release confidence is the KPI users experience, even if executives never measure it."
9.6 Practical recommendations
| # | Recommendation | Measurable outcome |
|---|---|---|
| 1 | Compute fully-loaded cost per failure once, using the full ledger | Single agreed figure used in all prioritization |
| 2 | Track the Trust Tax: hours consumed by process added after incidents | Reported annually; retire ceremony as controls automate |
| 3 | Report interrupt hours per team per week | Reactive load < 20% of capacity |
| 4 | Model confidence investment as throughput recovery, not risk reduction | Program funded from growth budget |
| 5 | Report experience variance alongside availability | Variance becomes a tracked commercial metric |
Chapter 10 — AI Changes Release Confidence
10.1 Why deterministic release validation fails for AI systems
Conventional release validation rests on an assumption so fundamental it is rarely stated: the same input produces the same output, so a passing test is a durable guarantee.
AI-bearing systems violate this assumption in four independent ways:
- Non-determinism. Identical inputs produce varying outputs. A pass/fail assertion becomes a sample from a distribution, and a single passing run carries almost no information.
- Continuous, invisible change. The model, its serving stack, its safety filters, and its context sources can change without any commit in your repository. Your artifact is stable; your system is not. In framework terms, τ for an AI-bearing system is very short and largely outside your control.
- Unbounded input space. Natural language input cannot be enumerated. Coverage, as a concept, does not transfer.
- Graceful-looking failure. A conventional bug throws an exception. An AI failure returns a fluent, well-formatted, confidently wrong answer with a 200 status code. Every conventional health signal reports success during the failure.
The fourth is the decisive one for release confidence. The observability stack described in Chapter 7 — error rates, latency, saturation — is structurally blind to the dominant failure mode of AI systems. An organization can have exemplary observability and zero detection capability for quality regression.
10.2 Probabilistic release validation
The replacement model: validate distributions, not outputs.
| Deterministic validation | Probabilistic validation |
|---|---|
| Test asserts exact output | Eval measures score distribution over a dataset |
| Pass / fail | Score with confidence interval |
| One run is sufficient | n runs; variance is itself a metric |
| Regression = test turns red | Regression = distribution shifts beyond tolerance |
| Coverage of code paths | Coverage of behaviour space and input taxonomy |
| Verify once before ship | Continuously verify in production |
The gating rule changes accordingly:
Ship if:  score(candidate) ≥ score(baseline) − δ    at p < 0.05
          AND no safety-class regression at any level
          AND cost/latency within budget
          AND worst-decile performance not degraded
The final clause is essential and commonly omitted. Mean-score gating permits a change that improves average quality while catastrophically degrading a minority segment — a fairness, safety, and enterprise-account risk simultaneously. Gate on the tail, not the mean.
10.3 The expanded change surface
For a conventional service, the change surface is code and config. For an AI system it includes at minimum:
| Change type | Deployable independently? | Conventionally versioned? | Typical governance |
|---|---|---|---|
| Application code | Yes | Yes | Full pipeline |
| Prompt / system instructions | Yes | Often not | Frequently none |
| Model version | Often vendor-controlled | Partially | Vendor release notes |
| Model parameters (temperature, top-p) | Yes | Rarely | Ad hoc |
| Retrieval corpus content | Continuously | Rarely | Content ops |
| Chunking / embedding strategy | Yes | Sometimes | Engineering |
| Embedding model version | Yes | Sometimes | Engineering |
| Retrieval parameters (k, reranking, thresholds) | Yes | Rarely | Ad hoc |
| Tool/function definitions | Yes | Yes | Full pipeline |
| Guardrail policies | Yes | Sometimes | Safety/legal |
| Evaluation dataset | Yes | Rarely | Ad hoc |
The rows marked in bold are where most AI incidents originate. A prompt is production code. It changes system behaviour, it can break customers, and it is frequently edited in a console by someone with no pipeline, no review, no version history, and no rollback. This is the single most common structural confidence deficit in AI-bearing systems, and the remediation is unglamorous and cheap: put prompts in version control, review them, evaluate them, deploy them through the pipeline, and flag them for instant rollback.
Similarly, an evaluation dataset is a measurement instrument and must be versioned and change-controlled. If the eval set changes at the same time as the system, no comparison is valid. Silent eval-set edits are the AI equivalent of moving the goalposts, and they usually happen with entirely good intentions.
10.4 RAG-specific confidence
Retrieval systems have a failure mode absent from conventional services: the code is correct, the model is correct, and the answer is wrong because the corpus changed. Confidence must therefore be scored on the data plane.
Signals to instrument:
- Retrieval quality: recall@k and nDCG against a labelled query set, tracked over time — this degrades silently as the corpus grows.
- Corpus freshness and drift: document age distribution, ingestion failure rate, embedding coverage of the corpus.
- Groundedness / attribution rate: proportion of response claims supported by retrieved context. This is the RAG-specific analogue of an error rate, and it is the metric most worth building.
- Retrieval null rate: frequency of queries returning nothing relevant — a leading indicator of hallucination, since a model with no context will often generate rather than decline.
- Index/embedding version compatibility: re-embedding with a new model while serving against an old index is a silent, total-quality failure that produces no errors at all.
10.5 Guardrails and continuous production validation
Because pre-release evaluation cannot cover an unbounded input space, AI release confidence must be completed in production. Three layers:
Input guardrails — injection detection, PII detection, out-of-scope classification, rate and cost limits. Output guardrails — safety classification, schema/format validation, groundedness checking, PII leak detection, refusal-appropriateness checks. Continuous evaluation — sampled production traffic scored by automated judges and periodic human review, segmented by user cohort, with drift alerting.
Two engineering cautions. First, guardrails are themselves models and require their own release confidence — a guardrail update is a production behaviour change and must be gated, evaluated, and reversible. Second, automated judges drift and must be calibrated against human labels on a schedule; an uncalibrated judge is an uncalibrated confidence score, which §8.3 already identifies as the core failure.
10.6 Deployment patterns for AI systems
- Shadow evaluation is disproportionately valuable: run the candidate against live traffic without serving its output, and compare distributions. This is the closest AI analogue to a canary with zero user risk, and it is under-used.
- Canary with quality metrics, not just error rates. The canary abort criteria must include groundedness, refusal rate, response-length distribution, tool-call success rate, and cost per interaction — because error rate will remain flat through a total quality collapse.
- Flag every prompt, model version, and retrieval parameter independently. Reversibility here is cheap to build and decisive in incidents.
- Maintain a pinned fallback: a known-good model+prompt combination that can be activated instantly. Given vendor-side model changes, this is not optional.
- Segment rollout by risk tier, exposing internal and low-stakes traffic first — the AI analogue of blast radius control.
10.7 Practical recommendations
| # | Recommendation | Measurable outcome |
|---|---|---|
| 1 | Version-control prompts, eval sets, and retrieval params; ship via pipeline | Zero console-edited production prompts |
| 2 | Gate on worst-decile and safety-class scores, not means | Tail-segment regressions blocked pre-release |
| 3 | Instrument groundedness and retrieval null rate in production | Quality regressions detected without customer reports |
| 4 | Calibrate automated judges against human labels quarterly | Judge–human agreement published |
| 5 | Maintain and regularly exercise a pinned fallback configuration | Fallback activation time < 60s, rehearsed |
10.8 KPIs introduced in this chapter
- Eval Score Delta with CI — candidate vs. baseline, statistically qualified
- Behaviour Space Coverage — % of the input taxonomy represented in the eval set
- Groundedness Rate — supported claims ÷ total claims
- Retrieval Null Rate — queries returning no relevant context
- Silent Change Exposure — count of production-affecting components that can change without a commit
Chapter 11 — Enterprise Case Study
The following is a composite case constructed from common enterprise patterns. All figures are illustrative placeholders intended to demonstrate the framework's application and reporting shape, not empirical findings from any single organization.
11.1 Context
Organization: B2B SaaS platform, ~1,900 employees, ~420 engineers across 38 teams. Architecture: 240 services, one substantial legacy monolith carrying billing and entitlements, shared PostgreSQL cluster for core tenancy data, Kubernetes on a single cloud, three regions. Culture: strong delivery velocity ethos. Deployment frequency was a headline engineering metric reported to the board quarterly.
11.2 Presenting symptoms
Leadership's stated problem was "too many incidents." The diagnostic engagement found a different problem: the organization had no pre-deployment evidence model at all. Deploy decisions were made by individual judgement, and the quality of that judgement varied by an order of magnitude across teams — with no mechanism to detect the variance.
Baseline measurements (illustrative):
| Metric | Baseline |
|---|---|
| Deploys/day | 62 |
| Redeployment Tax | 0.38 |
| Intended Change Throughput | ~38/day |
| Change failure rate | 21% |
| Customer-reported incident ratio | 0.46 |
| Measured MTTD (unannounced test) | 34 min |
| Documented MTTR | 41 min |
| Measured rollback duration (p95) | 26 min |
| Services with rollback rehearsed < 90d | 12% |
| Alert recall | 0.51 |
| Pipeline flake rate | 6.4% |
| Quarantined tests | 11% of suite |
| Flags past intended expiry | 61% |
| Release freezes in trailing 12 months | 9 (61 days total) |
| ETS (baseline survey) | 34 / 100 |
Two findings dominated. Alert recall of 0.51 meant roughly half of production failures were discovered by customers — the unbounded-cost case from §7.1. And ETS of 34 against leadership's belief that delivery was healthy indicated a severe perception gap: engineers had accurate risk models that the organization's metrics could not see.
11.3 Intervention sequence
Deliberately ordered by cost-per-confidence-point (§4.1), cheapest and highest-leverage first.
Phase 1 (weeks 1–6): Make the invisible visible. Deploy event emission and dashboard overlay. Redeployment Tax instrumentation. Unannounced detection tests per service to establish measured MTTD. Alert recall computed from twelve months of postmortems. No process changes. Deliberately, nothing was "improved" in this phase — the organization first had to be able to see itself.
Phase 2 (weeks 4–14): Restore evidence integrity. Automatic flake quarantine with 14-day TTL. Job-level retries banned. Diff coverage and diff mutation scoring introduced. Blanket security gate replaced with new-findings-only, reachability-filtered gating. The purpose was to make a green pipeline mean something again, because every subsequent measurement depended on it.
Phase 3 (weeks 10–26): Reversibility. Rollback rehearsal mandated monthly per service, measured, published. Expand-migrate-contract mandated for all schema changes; alter-in-place blocked by migration linter. Flag expiry enforced; 61% flag debt reduced by scheduled cleanup. Automated rollback triggers wired to SLO burn alerts.
Phase 4 (weeks 18–34): Progressive delivery. Platform team delivered canary-as-default with automated paired-baseline analysis and derived durations. CRS routing implemented so ceremony scaled with risk.
Phase 5 (weeks 26–52): Scoring and calibration. RCS computed per change from pipeline-emitted evidence. Bands enforced. Calibration table produced monthly; weights recalibrated twice.
11.4 Results at twelve months (illustrative)
| Metric | Baseline | 12 months | Change |
|---|---|---|---|
| Deploys/day | 62 | 71 | +15% |
| Redeployment Tax | 0.38 | 0.09 | −76% |
| Intended Change Throughput | ~38/day | ~65/day | +71% |
| Change failure rate | 21% | 7% | −67% |
| Customer-reported incident ratio | 0.46 | 0.11 | −76% |
| Measured MTTD | 34 min | 4 min | −88% |
| Measured rollback duration (p95) | 26 min | 3 min | −88% |
| Alert recall | 0.51 | 0.93 | +82% |
| Pipeline flake rate | 6.4% | 0.7% | −89% |
| Flags past expiry | 61% | 7% | −89% |
| Release freezes | 9 | 1 | −89% |
| Median RCS | n/a | 84 | — |
| Overconfidence Ratio | n/a | 1.02 | calibrated |
| ETS | 34 | 78 | +129% |
11.5 What the numbers mean
The headline is not the incident reduction. It is Intended Change Throughput rising 71% on a deploy-frequency increase of only 15%. Nearly all the delivery gain came from not doing work twice. This is the framework's central economic claim demonstrated: confidence is a throughput intervention, not a safety tax.
Three secondary observations, each generalizable:
The first phase produced no improvement and was the most important. Measurement preceded intervention. Teams that skip to tooling adoption without establishing measured MTTD, alert recall, and Redeployment Tax cannot tell whether anything worked, and typically over-invest in testing (the smallest term in the Exposure Function) because it is the most familiar lever.
ETS moved before DSI. Engineer-reported trust improved roughly a quarter ahead of realized stability — consistent with ETS as a leading indicator. It was also, initially, the only metric leadership found emotionally persuasive.
Release freezes fell to one. This is the Trust Tax being repaid. The nine freezes in the baseline year represented 61 days of suppressed delivery — an invisible, uncounted cost roughly comparable to the entire program's engineering investment.
11.6 What did not work
Two interventions were abandoned, and the reasons are instructive.
An organization-wide RCS leaderboard. Ranking teams by confidence score produced immediate gaming: coverage inflation, alert creation without meaningful thresholds, and reclassification of hotfixes. Removed after eight weeks. Confidence scores must be diagnostic, never comparative-competitive. Publish per-pillar deficits to the owning team; publish distributions, not rankings, to leadership.
A mandatory pre-deploy confidence review meeting. Intended to socialize the framework, it recreated the change advisory board pathology of §1.3 — batching, latency, and signature-substitution. Replaced with automated band enforcement, which is the entire point: the framework's controls must be executed by the pipeline, not by a committee.
Chapter 12 — The Release Confidence Dashboard
12.1 Design principle: three audiences, three surfaces
The most common dashboard failure is building one view for three audiences with incompatible questions. Separate them.
| Surface | Audience | Question | Refresh | Time horizon |
|---|---|---|---|---|
| Release Decision View | Engineer at deploy time | Should I ship this change now? | Real time | This change |
| Service Health View | Team, EM | Is this service safe to change? | Hourly | 30 days |
| Portfolio View | Director, VP, CTO | Where is our confidence deficit? | Daily | Quarter |
12.2 Release Decision View
Rendered in the pull request and in the deploy tool. One screen.
┌─────────────────────────────────────────────────────────────────┐
│  RELEASE CONFIDENCE           RCS 78 / 100      BAND: PROGRESSIVE│
│  ████████████████████░░░░░    CRS 11 (Elevated)  VA 0.8h (τ 14h) │
├─────────────────────────────────────────────────────────────────┤
│  PILLARS                                                        │
│  Architecture   ███████░░░  72    Observability ██████░░░░  64   │
│  Testing        █████████░  88    Rollback      ████████░░  81   │
│  Automation     █████████░  91    Documentation ██████░░░░  60   │
│  Deployment     ████████░░  80    Ownership     █████████░  94   │
│                                   Operational   ███████░░░  70   │
│                                   Business      ██████░░░░  62   │
├─────────────────────────────────────────────────────────────────┤
│  TOP DEFICITS (fix these, gain most)                            │
│  • No alert covers stated failure hypothesis  → +9 RCS  ~2h      │
│  • Runbook migration section stale (74d)      → +4 RCS  ~1h      │
│  • Success metric not yet emitting            → +5 RCS  ~1h      │
├─────────────────────────────────────────────────────────────────┤
│  ROLLBACK READINESS      ● Rehearsed 12d ago  ● p95 2m 40s      │
│  BLAST RADIUS CEILING    5% → 25% → 100%   auto-abort armed      │
│  DEPENDENCIES            2 of 7 outside error budget ⚠            │
│  ROLLBACK PROBABILITY    0.11 (model, 90d window)               │
└─────────────────────────────────────────────────────────────────┘
Three design rules make this view effective:
- Deficits carry a price and an effort estimate. "+9 RCS, ~2h" converts a governance score into a work item with an obvious return. Without this, teams experience the score as an obstacle rather than a plan.
- No approve button. The band determines the control. The engineer's decision is whether to remediate now or ship under the band's constraints.
- The dependency line is non-negotiable. Deploying into a degraded dependency environment is the most preventable incident amplifier in production engineering, and it is invisible without this line.
12.3 Service Health View
Standing properties of the service, not of any change.
| Panel | Contents |
|---|---|
| Production Readiness Score | PRS with component breakdown; trend 90d |
| Deployment Stability Index | DSI trend; rollbacks, hotfixes, incidents stacked |
| Rollback Readiness Index | Rehearsal recency, measured p95 duration, version window |
| Automation Reliability | Pipeline success, flake rate, quarantine population and age |
| Observability Coverage | Seven-question test results per critical path; measured MTTD |
| Alert quality | Precision, recall, runbook linkage, unactioned page rate |
| Error budget | Burn rate, multi-window, remaining budget |
| Debt registers | Flag debt, quarantine debt, Type-I operation inventory |
| Ownership | Owner, on-call coverage, bus factor, escalation test recency |
| ETS | Latest score, trend, free-text themes |
12.4 Portfolio View
Four charts and one table. Resist further additions.
- RCS distribution across all releases in the period — median and p10. The p10 is the more informative number: it shows the worst evidence the organization routinely ships on.
- Calibration chart — predicted vs. observed success by band, with Brier score and Overconfidence Ratio.
- Intended Change Throughput — deploys × (1 − RT), trended. This replaces deployment frequency as the delivery metric.
- Incident Prediction Index heatmap — services × IPI, sorted by traffic exposure. This is the platform roadmap input.
- Confidence deficit table — the top ten pillar deficits across the estate, ranked by (frequency × traffic exposure). This table converts the entire framework into a prioritized platform backlog, and it is the single most valuable artifact for a VP Engineering.
12.5 Anti-patterns in dashboard design
| Anti-pattern | Why it fails |
|---|---|
| Single unified dashboard for all audiences | Optimizes for none; becomes wallpaper |
| Team leaderboards on RCS | Produces gaming, not confidence (see §11.6) |
| Green/amber/red without deficit detail | Communicates status, prevents action |
| Real-time refresh on portfolio views | Encourages reactive management of noise |
| Vanity panels (deploy counts, lines of code) | Crowds out decision-relevant signal |
| Metrics without an owner | Nobody maintains them; they silently break |
Chapter 13 — Common Release Mistakes
Twenty-four documented anti-patterns, each with its confidence-model diagnosis. Grouped by root cause rather than symptom, because the same visible failure often has different causes and therefore different remediations.
13.1 Evidence mistakes
1. Treating a green pipeline as evidence without measuring pipeline reliability. At a 6% flake rate, green means "the dice landed favourably." Fix Automation Health before trusting any downstream signal.
2. Measuring repository coverage instead of diff coverage. The number describes code you are not changing. Risk lives in the diff.
3. Coverage without assertions. Execution is not verification. Mutation score on the diff exposes this immediately, and the first run is usually sobering.
4. Permanent test quarantine. A quarantined test implies coverage that does not exist. Worse than deletion, because it is invisible.
5. Job-level pipeline retries. Retries destroy flake measurability and train re-run reflexes. Retry at test level with attribution, or not at all.
6. Gating on total security backlog rather than new findings. Unshippable gates are universally bypassed, and bypass behaviour generalizes.
7. Shared integration environments as the primary confidence source. Expensive, perpetually broken, non-attributable, and divergent from production. Replace with contract testing and traffic shadowing.
8. Editing the evaluation dataset in the same change as the system under evaluation. No valid comparison exists. Version the instrument separately from the subject.
13.2 Reversibility mistakes
9. Documented but never-executed rollback procedures. A procedure first executed during an incident is a hypothesis, not a plan.
10. Rollback capability limited to one version back. The causal deploy is frequently not the most recent one. Maintain a two-version state-compatible window minimum.
11. Irreversible schema changes deployed with the code that depends on them. Expand-migrate-contract exists precisely to break this coupling. Alter-in-place should be blocked mechanically.
12. Blue/Green over a shared database treated as a safety control. It reverses compute, not state. It provides no protection against the failure class that most commonly becomes unrecoverable.
13. Untested kill switches. A recovery mechanism that fails at the moment of use is worse than a known absence, because it displaced a real plan.
14. Unbounded, unresumable, unobservable data backfills. The most common cause of unrecoverable production database events. Throttle, checkpoint, instrument, and add a pause switch.
13.3 Detection mistakes
15. Assuming MTTD rather than measuring it. Unannounced fault injection typically reveals detection latency several multiples above the assumed figure.
16. Never measuring alert recall. Without recall, an organization cannot know what fraction of failures it learns about from customers. It is computable from existing postmortems in an afternoon.
17. Cause-based paging (CPU, memory, disk) instead of symptom-based SLO alerting. Produces high volume, low precision, and alert fatigue — which is a detection failure with extra steps.
18. Shipping new code paths without instrumentation, planning to add it later. Instrumentation added after an incident is instrumentation that was absent during the incident.
19. No deploy/config/flag event correlation on dashboards. Change causes most incidents; not correlating telemetry with change is the largest available diagnostic loss for the smallest available engineering cost.
20. Relying solely on server-side metrics for user-facing systems. Client-side, CDN, third-party, and regional failures are invisible. RUM is not optional for products with a browser or mobile surface.
13.4 Governance and organizational mistakes
21. Responding to incidents by adding approval steps. Increases batch size, blast radius, and latency; reduces attributability. It is the intervention that most reliably makes things worse while appearing responsible.
22. Release freezes as a standing risk control. A freeze converts many small risks into one large one, deferred to a date chosen for calendar reasons. The post-freeze release is the highest-risk deploy of the year.
23. Friday-deploy prohibitions instead of fixing recovery capability. The prohibition is a symptom report: it states that the organization cannot recover safely with reduced staffing. Treat it as a defect against Rollback Capability and Observability. When ETS reaches maturity, the Friday question answers itself.
24. Unowned services in the deploy path. An unowned change has no recovery path, no escalation target, and no accountable decision-maker at 03:00. Ownership must be resolvable automatically from the artifact, or the change cannot exceed the Supervised band.
13.5 The meta-mistake
Every item above shares one structural property: it substitutes a proxy for evidence. A signature for a measurement. A document for a rehearsal. A count for an assertion. A calendar rule for a capability.
"Ceremony is what organizations produce when they need confidence and have no way to measure it."
Chapter 14 — The Confidence-Driven Delivery Maturity Model
14.1 Levels
L0  Ad Hoc Releases          "We ship when it seems ready."
        │
        ▼
L1  Automated Delivery       "We ship automatically."
        │
        ▼
L2  Reliable Releases        "We ship and it usually works."
        │
        ▼
L3  Predictable Engineering  "We know what will happen when we ship."
        │
        ▼
L4  Confidence-Driven        "The system decides, and it is calibrated."
14.2 Level definitions and exit criteria
Exit criteria are objective and measured, not self-assessed. A level is not achieved until its criteria hold for two consecutive quarters.
L0 — Ad Hoc Releases Characteristics: manual or partially scripted deploys; release decisions by individual judgement; rollback means redeploying an older build, executed rarely; observability is logs and a dashboard someone built once; ownership implicit; incidents discovered by customers. Exit criteria: every deploy is pipeline-executed and version-controlled; every service has a named owner; deploy events are emitted; RT is measured.
L1 — Automated Delivery Characteristics: CI/CD present and used; automated tests gate merges; deploy frequency rises sharply; incidents rise proportionally, because throughput increased without evidence quality increasing. This is the most dangerous level, and the largest population of enterprise organizations sits in it — automation has amplified whatever confidence quality already existed, in both directions. Exit criteria: AR > 0.95; flake rate < 1%; quarantine < 2% with TTL enforcement; diff coverage > 80%; measured (not assumed) MTTD published per service.
L2 — Reliable Releases Characteristics: progressive delivery available and used for user-facing services; rollback rehearsed and measured; SLOs defined with burn-rate alerting; postmortems blameless and producing tracked actions; DSI stable above 0.85. Exit criteria: alert recall > 0.85; rollback p95 < 5 min, rehearsed within 30 days for 90% of services; RT < 0.15; customer-reported incident ratio < 0.20; canary with automated abort on all tier-1 services.
L3 — Predictable Engineering Characteristics: per-change confidence scoring in production use; CRS routing determines controls; deployment ceremony correlates with measured risk rather than with policy; release freezes rare and treated as defects; Type-I operations inventoried and declining. Exit criteria: RCS computed for 100% of changes from machine-collected evidence; median RCS > 80 with p10 > 60; DSI > 0.92; RT < 0.10; ETS > 65; zero unowned services in the deploy path.
L4 — Confidence-Driven Delivery Characteristics: the majority of changes deploy with no human in the loop, gated by calibrated confidence; the model is validated monthly against outcomes and corrected; confidence deficits generate platform roadmap items automatically; the organization can state its residual risk numerically and defend the number. Exit criteria: Overconfidence Ratio within 0.95–1.05 for three consecutive quarters; > 70% of changes deploy autonomously; ETS > 80; Intended Change Throughput growth exceeds deploy-frequency growth (i.e. gains come from quality, not motion).
14.3 The L1 trap
The transition most organizations fail is L1 → L2, and the failure mode is consistent: L1 produces impressive metrics. Deployment frequency and lead time both improve dramatically, and both are the metrics reported upward. The organization is congratulated at precisely the moment its Redeployment Tax begins to climb.
The diagnostic that reveals the trap is the pairing of deploy frequency with RT and ETS. Rising frequency with rising RT and falling ETS is L1 stagnation, regardless of how good the DORA numbers look.
14.4 Progression guidance
| From → To | Highest-leverage investment | Common misallocation |
|---|---|---|
| L0 → L1 | Pipeline, ownership registry, deploy events | Buying tools before establishing ownership |
| L1 → L2 | Flake elimination, rollback rehearsal, alert recall | More test coverage (smallest Exposure Function term) |
| L2 → L3 | Evidence instrumentation, CRS routing, scoring | Building dashboards before instrumenting evidence |
| L3 → L4 | Calibration loop, autonomous gating, platform paving | Automating decisions before validating the model |
The last row is the critical caution. Do not automate a confidence decision before the model is calibrated. An uncalibrated autonomous gate ships unearned confidence at machine speed.
Chapter 15 — Engineering Culture as a Confidence System
15.1 Culture is a measurement problem before it is a values problem
Culture is frequently invoked and rarely instrumented. In the confidence framework it has a precise operational role: culture determines the accuracy of the human-sourced signals in the model.
If engineers cannot report low confidence without consequence, the reported confidence is uniformly high and uniformly worthless. If postmortems assign blame, causal analysis stops at the nearest human and the systemic deficit remains unfixed — and will recur. Culture is not a soft complement to the measurement system; it is the calibration mechanism for its human inputs.
15.2 Psychological safety, measured
Four computable proxies, none requiring a values survey:
| Proxy | Measurement | Interpretation |
|---|---|---|
| Stop-the-line rate | Deploys halted by a non-senior engineer's concern | Near zero indicates suppression, not quality |
| Postmortem authorship distribution | % authored by the engineer closest to the failure | Low share suggests blame avoidance |
| Near-miss reporting rate | Reported incidents with no customer impact | High is healthy; zero means under-reporting |
| ETS free-text response rate | Anonymous instrument participation | Low participation is itself a finding |
Near-miss reporting deserves emphasis. In every mature safety-critical industry, near-miss volume is a leading indicator of health, not of dysfunction. An engineering organization that reports zero near-misses is not experiencing zero near-misses; it is discarding its cheapest source of pre-incident evidence.
15.3 Blameless postmortems that produce confidence
A blameless postmortem is not one that avoids naming people. It is one that treats human error as a starting point for investigation rather than a conclusion. The confidence-relevant discipline:
- Every incident must produce at least one scored-pillar change. If the postmortem's actions do not raise a pillar score for future releases, the analysis stopped too early. "Be more careful" raises nothing.
- Every Sev1/Sev2 must produce a regression test (IRC metric, §5.2) within 30 days.
- Every incident must be checked against the alert recall calculation. If no alert fired, the detection deficit is the primary finding, ahead of the causal defect.
- Every incident should update the Rollback Probability model with its features. Incidents are the training data for prediction.
- Counterfactual discipline: ask what evidence, available before the deploy, would have predicted this — and whether that evidence is now collected. This converts postmortems from narrative into model improvement.
15.4 Shared ownership without diffusion
"You build it, you run it" raises confidence when ownership is specific and lowers it when ownership is collective. Collective ownership of an on-call rotation is functional; collective ownership of a service is an ownership vacuum with better branding.
Practical requirements: exactly one accountable team per service, resolvable programmatically from the artifact; ownership records with an expiry and a review cadence; explicit, tested escalation paths; and a bus-factor metric with a threshold that triggers action rather than commentary.
15.5 Continuous learning as a confidence input
Two mechanisms convert learning into measurable confidence.
Game days. Scheduled, scoped exercises in which a team responds to an injected failure using only their real runbooks, dashboards, and tooling. The output is not a story; it is a set of measured values — time to detect, time to orient, time to mitigate — and a list of every moment someone needed knowledge that existed only in a person's head. Those moments are documentation defects with known priority.
Rotation through operations. Engineers who have not carried a pager for a service systematically underestimate its operational risk, because the failure modes are not represented in their mental model. Rotation is the cheapest way to align design-time judgement with runtime reality — and it shows up in the data as improved CRS estimation accuracy.
15.6 The Friday deployment test
The most useful single cultural diagnostic in release engineering:
Ask engineers whether they would deploy this service on a Friday afternoon. Do not ask them to justify the answer.
A "no" is not caution. It is a precise, well-informed report that recovery capability is insufficient under reduced staffing. It localizes directly to Rollback Capability, Observability, and Ownership.
Organizations respond to this signal in one of two ways. The common response is a policy prohibiting Friday deploys — which suppresses the signal, permanently encodes the deficit, and increases Monday batch size. The correct response is to treat every "no" as a defect ticket against the named pillar, and to re-ask quarterly. The Friday policy is not a safety control; it is a confidence deficit that has been institutionalized.
"A no-deploy-Friday policy is not a safety measure. It is a written confession, ratified as procedure."
Chapter 16 — The Release Confidence Checklist
Forty questions, grouped by pillar. Intended as a diagnostic instrument for a service or a release train, not as a pre-deploy form — anything on this list that is asked repeatedly of humans should be automated into the scoring model.
Scoring: Yes = 1, Partial = 0.5, No = 0. Section scores map directly to pillar inputs.
Architecture Stability (P1)
- Can you enumerate every synchronous downstream dependency in the changed request path?
- Can version N and N+1 of this service run simultaneously in production?
- Does every outbound call have an explicit timeout, retry policy, and circuit breaker?
- Is the blast radius of this service's total failure documented and bounded?
Testing Confidence (P2) 5. Is diff coverage above 85%, with exemptions justified in writing? 6. Has mutation testing been run on the diff, and is the score above 70%? 7. Does a test exist that would have caught each of the last three incidents in this component? 8. Are consumer contracts verified against currently deployed consumer versions? 9. Is the load profile used for performance testing derived from production traffic shape?
Automation Health (P3) 10. Is the pipeline flake rate below 1%? 11. Is the quarantine population below 2%, with every entry younger than its TTL? 12. Are job-level blanket retries disabled? 13. Are build artifacts signed, attested, and reproducible? 14. Is pipeline p95 duration short enough that engineers do not batch changes to avoid it?
Deployment Readiness (P4) 15. Is progressive delivery configured, with automated abort criteria? 16. Was canary duration derived from a power calculation rather than convention? 17. Is the canary compared against a concurrently running baseline? 18. Is every behaviour-changing element of this release independently flag-controlled? 19. Is flag debt (flags past intended expiry) below 5%?
Observability (P5) 20. Can you answer all seven questions of §7.2 for this change without deploying new code? 21. Is measured MTTD for this service published, and was it measured within 90 days? 22. Is alert recall for this service above 0.9? 23. Do deploy, config, and flag events appear as overlays on every relevant dashboard? 24. Does a signal exist that would reveal this change's stated failure hypothesis? 25. Is RUM deployed for every customer-facing surface this change affects?
Rollback Capability (P6) 26. Was rollback rehearsed for this service within the last 30 days? 27. Is the measured p95 rollback duration below five minutes? 28. Can you roll back two versions, not just one, given current state compatibility? 29. Are all schema changes in this release backward compatible (expand-migrate-contract)? 30. Are all data-modifying operations resumable, throttled, observable, and pausable?
Documentation (P7) 31. Is the runbook current, and does it reflect the last two architectural changes? 32. Is every alert linked to a runbook section that resolves it? 33. Is there a decision record for the non-obvious choices in this change?
Ownership (P8) 34. Is the accountable team resolvable programmatically from the deployed artifact? 35. Was the escalation path tested within the last 90 days? 36. Is the bus factor for this component above two?
Operational Readiness (P9) 37. Are all dependencies currently within their error budgets? 38. Is there sufficient capacity headroom for this change's projected load at peak? 39. Are there no concurrent maintenance events or active Sev1/Sev2 incidents?
Business Readiness (P10) 40. Is the success metric instrumented, verified as emitting, and are guardrail thresholds defined?
Chapter 17 — The Release Confidence Lifecycle
17.1 A loop, not a pipeline
Delivery is conventionally drawn as a pipeline — a directed line from commit to production. This shape is the source of a persistent error: it implies that confidence is produced upstream and consumed at the end.
Confidence is produced by a loop, and the highest-value segment is the one most organizations draw as an afterthought: the return path from production back into design.
        ┌──────────────────────────────────────────────────────┐
        │                                                      │
        ▼                                                      │
   1. PLANNING ──► 2. BUILDING ──► 3. TESTING ──► 4. VALIDATION│
   VIR, CRS est.   Standards,      Evidence      Scoring, band │
   failure hypo.   flags, instr.   production    assignment    │
                                                    │          │
                                                    ▼          │
   8. IMPROVEMENT ◄─ 7. LEARNING ◄─ 6. MONITORING ◄─ 5. DEPLOY │
   Model recalib.    Postmortem,    Canary, SLO,    Progressive│
   platform work     calibration    outcome metric  by CRS     │
        │            counterfactual                            │
        └──────────────────────────────────────────────────────┘
17.2 Stage responsibilities
1. Planning. Produce the Verifiable Intent Record: intent, success signal, guardrails, failure hypothesis, reversal condition. Estimate CRS. Classify reversibility (Type-R/C/I). Output: a pre-registered prediction and a risk class.
2. Building. Implement under mechanically enforced standards. Instrument new code paths at creation. Wrap behaviour changes in flags. Choose backward-compatible state changes. Output: a change that is observable and reversible by construction.
3. Testing. Produce evidence meeting the four-property test: relevance, reliability, timeliness, actionability. Diff coverage, diff mutation, contract verification, performance deltas, chaos results where warranted. Output: scored evidence, not a green checkmark.
4. Validation. Compute pillar scores, apply decay for Verification Age, apply gates, assign band. Surface top deficits with price and effort. Output: RCS, band, and a remediation plan.
5. Deployment. Execute the controls the band and CRS prescribe. No approvals; controls. Output: a bounded-exposure rollout with armed abort criteria.
6. Monitoring. Canary analysis against a concurrent baseline; SLO burn tracking; verification of the pre-registered success metric. The last is the step most consistently skipped, and its absence is why organizations accumulate features that shipped successfully and achieved nothing.
7. Learning. For incidents: blameless analysis, regression test, alert-recall check, pillar-score action. For all releases: record predicted vs. realized outcome for calibration. Run the counterfactual — what available evidence would have predicted this?
8. Improvement. Recalibrate model weights against observed causation. Convert recurring pillar deficits into platform roadmap items. Retire ceremony that automated controls have made redundant. Output: a better model and a paved road, not a longer checklist.
17.3 The two feedback loops
The diagram contains two loops operating at different frequencies, and conflating them is a common design error.
The fast loop (5 → 6 → 5): canary analysis and automated abort. Cycle time: seconds to minutes. Fully automated. This loop protects the current release.
The slow loop (7 → 8 → 1): calibration, weighting, platform investment. Cycle time: weeks to quarters. Human-directed. This loop improves all future releases.
Organizations reliably build the fast loop and neglect the slow one. The result is a system that recovers well from individual failures while learning nothing from them — high MTTR performance with a flat incident rate, year over year. The slow loop is where compounding happens.
17.4 Stage entry and exit criteria
| Stage | Entry criterion | Exit criterion |
|---|---|---|
| Planning | Funded intent exists | VIR complete; CRS estimated; reversibility classified |
| Building | VIR approved | Instrumentation present; flags configured; state compatible |
| Testing | Build produced | All four signal properties satisfied on all evidence |
| Validation | Evidence collected | RCS computed; band assigned; VA < 0.5τ |
| Deployment | Band ≥ Supervised; ORR preconditions met | Rollout completed or aborted cleanly |
| Monitoring | Traffic served | Success metric verified; guardrails within threshold |
| Learning | Release concluded | Prediction vs. outcome recorded; actions raise a pillar score |
| Improvement | Calibration data present | Weights updated; deficits converted to roadmap items |
Chapter 18 — The Future of Release Engineering
18.1 Platform engineering as confidence manufacturing
The most useful reframing available to a platform team is this: a platform's product is not developer experience. It is confidence, manufactured at decreasing marginal cost.
Every paved-road capability — the pipeline template, the observability defaults, the canary controller, the migration linter, the flag service, the ownership registry — exists to raise a pillar score for every team simultaneously without each team building it. A platform team should therefore be measured not on adoption or satisfaction, but on confidence delta per unit of platform investment:
Platform yield = Σ (ΔRCS per service) × (traffic-weighted exposure)
                 ─────────────────────────────────────────────────
                              platform engineering cost
This metric has an immediate practical consequence: it ranks platform work by measured risk reduction across the estate, and it usually reorders the roadmap significantly. The §12.4 confidence deficit table is its direct input.
18.2 AI-assisted release engineering
Near-term, high-confidence applications — each already technically feasible:
- Risk classification of diffs. Models trained on organizational incident history estimate Rollback Probability from diff features far more consistently than human intuition, and their feature weights are themselves a diagnostic.
- Automated failure-hypothesis generation. Given a diff and the service's incident history, propose the most likely failure modes and the instrumentation required to detect them. This directly addresses the most common D3 gap.
- Incident triage acceleration. Correlating telemetry anomalies with change events, dependency status, and prior incident patterns to produce a ranked causal hypothesis list within seconds.
- Test and instrumentation gap detection. Identifying changed paths lacking assertions or signals — a mechanical task with high yield.
- Postmortem synthesis. Assembling timelines from telemetry, chat, and deploy events, so human attention goes to causal analysis rather than reconstruction.
The consistent pattern: AI is most valuable where it produces evidence or accelerates orientation, and least trustworthy where it makes the ship decision. The framework's calibration requirement applies with full force to any model in the release path — an uncalibrated AI gate is the §8.3 failure at machine speed.
18.3 Predictive deployment
The trajectory runs from reactive to predictive:
| Generation | Question | Mechanism |
|---|---|---|
| Reactive | What broke? | Alerting, postmortems |
| Preventive | What might break? | Testing, review, chaos |
| Predictive | What is the probability this breaks, and how much will it cost? | RP model, CRS, IPI |
| Prescriptive | What is the cheapest intervention that raises confidence most? | Deficit pricing (§12.2) |
| Autonomous | Should the system ship this without asking? | Calibrated gating (L4) |
Most enterprises operate between reactive and preventive. The framework in this paper is a specification for reaching prescriptive, which is where the economic returns concentrate — because prescriptive systems tell engineers what two hours of work will most reduce their risk, which is a question no dashboard currently answers.
18.4 Continuous verification
The final structural shift is the collapse of the distinction between testing and production monitoring. Given confidence decay (§2.4), verification cannot be a phase — a system verified at T is unverified at T + 3τ regardless of whether anything shipped.
Continuous verification means: synthetic transactions exercising critical paths continuously; chaos experiments running on a schedule in production, not as annual events; contract verification against currently deployed consumers, continuously; SLO evaluation as the definition of correctness; and production as the authoritative test environment, with pre-production reduced to a fast filter for obvious defects rather than a simulacrum that never matches.
18.5 Autonomous delivery and its preconditions
Autonomous delivery — changes flowing to production with no human decision — is achievable and is already the operating mode for the highest-confidence portions of several large estates. Its preconditions are strict, and attempting it without them is the most expensive mistake in this paper:
- A calibrated model. Overconfidence Ratio within 0.95–1.05, sustained. Without calibration, autonomy ships unearned confidence at machine speed.
- Bounded exposure by construction. Automated abort must be capable of limiting damage before any human notices.
- Recovery faster than detection. If recovery is slower than detection, human latency is not the bottleneck and autonomy adds little.
- Ownership resolvable without a human. Escalation must be automatic and correct.
- A stop mechanism. A single, tested, global control to halt autonomous delivery, exercised on a schedule.
Note that autonomy is not all-or-nothing. The correct target state is autonomy for the majority of low-CRS changes, with human attention concentrated on the small minority of high-CRS changes where judgement genuinely adds value. Most organizations currently apply uniform ceremony to both, which starves the risky changes of attention while taxing the safe ones.
Chapter 19 — Final Thoughts
Deployment frequency became the industry's headline metric because it was the first thing that became easy to measure. That is a reasonable origin and a poor destination. Motion is not capability. A pipeline's throughput is not an organization's judgement.
The argument of this paper reduces to four claims.
First, confidence is measurable. Not perfectly, but well enough to change decisions — which is a far lower bar than perfection and a far higher bar than sentiment. Ten pillars, machine-collected evidence, weighted composition, blocking floors, and a decay function are sufficient to produce a number that is better than intuition and, crucially, auditable when it is wrong.
Second, confidence must be calibrated or it is worse than nothing. A score never validated against outcomes relocates risk rather than reducing it — from an engineer's honest uncertainty to a number with unearned authority. The calibration loop is not an enhancement to the framework. It is the framework's license to operate.
Third, confidence is a throughput intervention. The case study's central figure was not the incident reduction; it was Intended Change Throughput rising 71% on a 15% increase in deploys. Organizations that believe they are trading safety for speed are, over any horizon longer than a quarter, usually losing both. Rework, ceremony, freezes, escalation, and attrition are not the price of speed — they are the price of unmeasured speed.
Fourth, the highest-leverage investments are the least fashionable. Deploy event annotation. Flake elimination. Rollback rehearsal. Alert recall measurement. Ownership registries. Expand-migrate-contract discipline. None of these will appear in a keynote. All of them move the largest terms in the Exposure Function, and all of them cost less than the incident they prevent.
The organizational shift is smaller than it appears. It does not require new tooling categories, reorganization, or a transformation program. It requires that one question be asked before every release, in a form that can be answered with evidence rather than sentiment:
How confident are we — and how do we know?
Everything in this paper is machinery for answering that question honestly, repeatedly, and cheaply enough to do it forty times a day.
"The best deployment is the one nobody notices."
Deployment frequency tells us how often we release software. Release Confidence tells us whether we should.



