
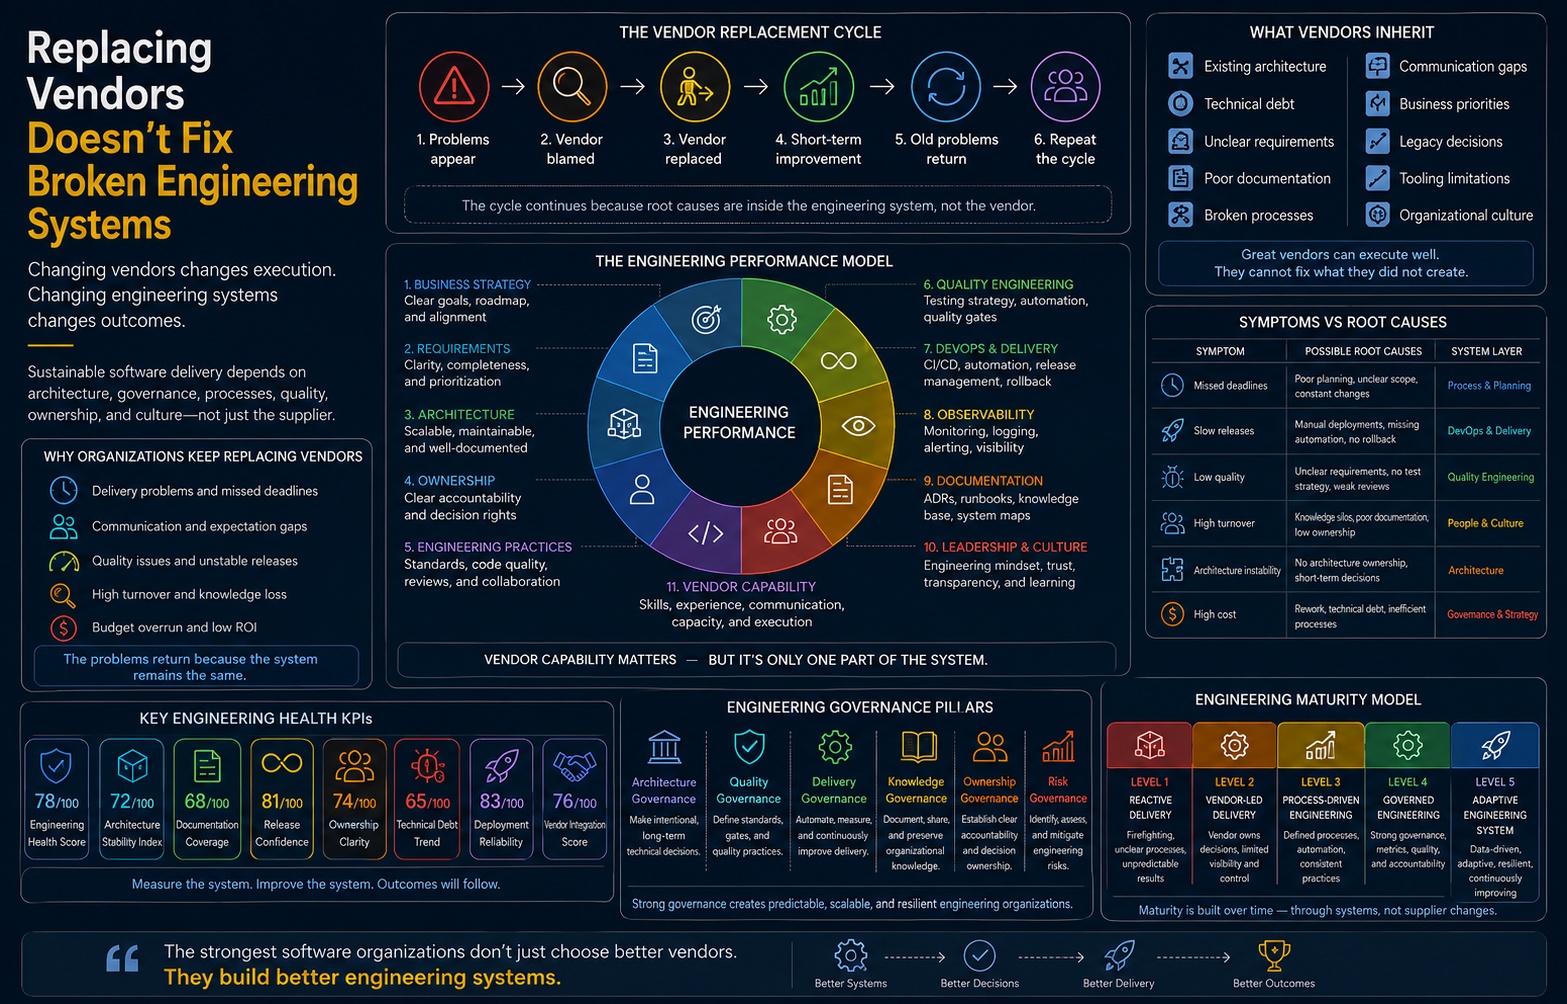
There is a decision that recurs in nearly every enterprise engineering organization with a distributed or outsourced delivery model. Deadlines slip. Defect rates climb. Releases become events rather than routines. Leadership escalates, reviews the relationship, and concludes that the supplier is underperforming. A transition plan is drafted, a new partner is selected, knowledge transfer is scheduled, and the organization braces for a difficult quarter in exchange for a better year.
Then something predictable happens. The first three to six months improve. Communication is sharper, the new team is motivated, fresh engineers ask good questions, and early wins accumulate. And then, somewhere between month seven and month fourteen, the original symptoms return—often in the same subsystems, often with the same root causes, occasionally with the same Jira tickets reopened under new IDs.
This paper examines why.
The argument is not that vendor changes are wrong. They are frequently necessary and occasionally urgent. A supplier can genuinely lack the domain expertise, the seniority, the security posture, the timezone coverage, or the commercial alignment a program requires. When that is true, replacement is the correct decision and delay is expensive.
The argument is narrower and, we believe, more useful: vendor replacement addresses the supply of engineering effort, while most chronic delivery problems originate in the system that effort flows through. Architecture, requirements quality, decision ownership, release mechanics, test strategy, observability, documentation, and governance are properties of the buying organization. They persist across contracts. A new supplier inherits them on day one and is measured against them from day thirty.
We can state this as a working model. If C is the capability of the engineering supplier and S is the coefficient of the surrounding engineering system, then delivered outcome is closer to a product than a sum:
Delivered Outcome ≈ Vendor Capability (C) × System Coefficient (S)When S is high, a competent vendor looks excellent and an average vendor looks competent. When S is low, an excellent vendor looks average within two quarters—because the system converts their capability into rework, coordination overhead, and defensive engineering rather than into shipped value. Replacing the supplier changes C. It does not touch S. And because S is a multiplier, improvements to C alone produce bounded, temporary gains.
This paper develops that model into something operational. Across twenty chapters it introduces:
- The Engineering Performance Model (EPM) — twelve factors organized into four layers (Intent, Structure, Flow, Memory) plus supply, with explicit interaction rules.
- The Replacement Reset Curve — a four-phase description of what actually happens to delivery metrics after a vendor transition, and why the improvement decays.
- The Root Cause Matrix — a diagnostic instrument that maps observable symptoms to their locus of causation and to the party who can actually fix them.
- The Decision Spine and the Four Gates — a governance framework defining which classes of engineering decision may be delegated to a supplier and which may never be.
- The Knowledge Continuity Model (KCM) — a five-tier maturity ladder from tacit knowledge to enforced, executable documentation.
- The Engineering Health Score (EHS) — ten composite indices, including Architecture Stability, Ownership Clarity, Release Confidence, and Vendor Integration Score.
- The Vendor Evaluation Scorecard — a weighted, evidence-based selection instrument that assesses system fit rather than sales capability.
- A five-level Engineering Maturity Model and a phased Transformation Roadmap, with a forty-question executive checklist to run before any replacement decision.
The intended outcome is not that readers keep their current supplier. It is that they can distinguish, with evidence, between a supply problem and a system problem—and act on the correct one. Those are different diseases, and the second one does not respond to the first one's treatment.
Who should read this: CTOs, VPs of Engineering, founders scaling their first outsourced team, engineering managers inheriting a distributed program, software architects responsible for systems built by multiple hands, product leaders frustrated by delivery predictability, procurement leaders writing the next statement of work, and delivery managers who have run at least one transition and would prefer not to run an identical one.
Chapter 1 — The Vendor Replacement Cycle
1.1 The pattern
The cycle is remarkably consistent across industries. It appears in fintech platforms with regulatory deadlines, in healthcare systems with integration burdens, in e-commerce companies with seasonal peaks, and in enterprise SaaS with multi-tenant complexity. The shape does not vary much:
   Delivery problems emerge
              ↓
   Attribution to the supplier
              ↓
   Vendor dissatisfaction formalized
              ↓
   Search, selection, transition
              ↓
   Short-term improvement (the honeymoon)
              ↓
   Original symptoms return
              ↓
   Attribution to the new supplier
              ↓
   Another replacement
Organizations that have completed two or more rotations often describe an eerie familiarity: the same architectural bottleneck, the same integration that nobody wants to touch, the same release weekend, the same senior engineer who is the only person who understands billing.
1.2 The Replacement Reset Curve
To understand why improvement decays, it helps to decompose the post-transition period into four phases. We call this the Replacement Reset Curve.
Phase 1 — Discovery (months 0–3). The incoming team reads code with fresh eyes, asks questions nobody has asked in years, and produces a list of findings that feels like insight. Velocity is low but confidence is high. The buying organization interprets the quality of the questions as evidence of superior capability. Sometimes it is. Often it is simply the natural product of arriving without assumptions.
Phase 2 — Surface Wins (months 3–7). The new team fixes the accessible problems: flaky tests that were never triaged, a build step that could be cached, a queue configuration nobody had tuned, a UI backlog that had stalled. These are real improvements, and they are real value. They are also, almost by definition, the problems that did not require system change. Metrics improve. The replacement is declared successful.
Phase 3 — Contact with Structure (months 7–12). The team reaches work that cannot be completed without touching the architecture, the data model, the deployment pipeline, or a decision that was never written down. Now they encounter what the previous vendor encountered: ambiguous requirements, an approval path with no owner, a service with three consumers and no contract, a test suite that cannot certify a release. Velocity flattens. Estimates begin to inflate as the team prices in uncertainty.
Phase 4 — Regression to System Mean (months 12+). Delivery metrics converge toward the values observed under the previous supplier. The new team has learned the same defensive behaviors: over-estimate, avoid the fragile module, batch releases, add manual verification. Escalations resume. The organization begins, once again, to evaluate the relationship.
The critical observation is that Phase 4 is not a failure of the new vendor. It is the system asserting itself. The honeymoon was never a measurement of vendor capability; it was a measurement of how much accessible, system-independent work had accumulated while the previous team was consumed by system-dependent work.
1.3 Why the cycle is rational at each step
It is tempting to describe this loop as an organizational error. It is more accurate—and more useful—to recognize that each individual step is locally rational.
- Attribution to the supplier is rational because the supplier is the most visible, most measurable, and most contractually adjustable variable in the system. You can change a vendor in one quarter. You cannot change an architecture in one quarter.
- Replacement is rational because it is the only lever that a single executive can pull unilaterally. Architecture change requires product to give up roadmap. Governance change requires leadership to give up autonomy. Documentation requires everyone to give up time. Vendor change requires a signature.
- Declaring success in Phase 2 is rational because the metrics genuinely improved and the organization needs to justify the transition cost.
- Re-evaluating in Phase 4 is rational because the metrics genuinely regressed.
The loop persists not because people are careless but because the accessible lever is the wrong lever, and pulling it produces just enough signal to look like the right one. This is a structural trap, and structural traps are not escaped by working harder inside them.
1.4 What the cycle costs
Each rotation carries costs that rarely appear in a single budget line:
| Cost category | Typical range | Notes |
|---|---|---|
| Transition and onboarding | 2–5 months of blended team cost | Overlap period, knowledge transfer, environment access |
| Velocity loss | 25–60% for 3–4 months | Discovery phase productivity gap |
| Knowledge evaporation | Non-recoverable | Undocumented context leaves with the outgoing team |
| Re-litigation of decisions | 1–3 months of architect time | New team challenges prior choices, often correctly, often without new information |
| Roadmap displacement | 1–2 quarters | Feature work deferred during stabilization |
| Organizational attention | Executive bandwidth | Selection, negotiation, escalation management |
For a program with a twenty-person distributed team, a single rotation frequently represents six to nine months of effective delivery capacity. Two rotations in five years can consume a year and a half. If the underlying system coefficient is unchanged, that is a year and a half purchased for a temporary improvement.
"The honeymoon after a vendor change is not evidence of the new team's strength. It is an inventory of the work your system was not blocking."
1.5 What this chapter does not claim
Three clarifications, stated plainly because the rest of the paper depends on them.
First, some vendor relationships must end. Chronic misrepresentation of seniority, security failures, unwillingness to adopt agreed engineering standards, commercial models that punish quality, or genuine absence of required domain depth are supply problems and require supply solutions. Chapter 4 provides a diagnostic for telling them apart.
Second, this is not a criticism of software outsourcing, staff augmentation, or engineering consulting as models. The evidence is overwhelming that distributed and partner-based delivery works well—when the buying organization operates a strong engineering system. The same models fail when it does not. That asymmetry is the entire subject of this paper.
Third, vendors are not passive. A capable partner can and should improve the system they enter—raise architectural concerns, propose governance, invest in documentation. Chapter 19 discusses what that partnership looks like. But a supplier cannot unilaterally install ownership, decision rights, or product strategy inside a client organization. Those are not deliverables. They are properties of the buyer.
Chapter 2 — What Actually Creates Engineering Performance?
2.1 The Engineering Performance Model
If vendor capability is one variable, what are the others? The Engineering Performance Model (EPM) organizes twelve factors into four layers plus a supply dimension. The layering is not cosmetic: it encodes causality. Upper layers constrain lower ones, and defects introduced in an upper layer cannot be fully corrected below it.
┌───────────────────────────────────────────────────────────┐
│  LAYER 1 — INTENT        Business Strategy · Requirements  │
├───────────────────────────────────────────────────────────┤
│  LAYER 2 — STRUCTURE     Architecture · Ownership          │
├───────────────────────────────────────────────────────────┤
│  LAYER 3 — FLOW          Engineering Practices · Quality   │
│                          Engineering · DevOps ·            │
│                          Observability                     │
├───────────────────────────────────────────────────────────┤
│  LAYER 4 — MEMORY        Documentation · Leadership ·      │
│                          Culture                           │
└───────────────────────────────────────────────────────────┘
                            ×
              SUPPLY — Vendor Capability
2.2 The twelve factors
Layer 1 — Intent
- Business Strategy. Whether engineering knows what the company is optimizing for—growth, margin, compliance, time-to-market, platform leverage—and whether that answer is stable enough to architect against. Strategy volatility is one of the most under-diagnosed causes of technical debt: teams build for a target that moves after the foundation is poured.
- Requirements. Not documents, but the reliability of the translation from business intent to engineering specification. Requirement quality determines the ratio of value-adding work to rework. It is measurable: track the percentage of stories that change materially after development begins.
Layer 2 — Structure
- Architecture. Module boundaries, coupling, data ownership, integration topology, deployment units. Architecture sets the cost of every future change. It is the single most durable determinant of delivery speed and the one least affected by supplier identity.
- Ownership. Which named person or team is accountable for each service, dataset, interface, and decision. Ownership gaps do not announce themselves; they appear as delay, because unowned work waits for consensus.
Layer 3 — Flow
- Engineering Practices. Branching strategy, code review norms, definition of done, refactoring discipline, technical standards. These govern the rate at which correctness is established per unit of effort.
- Quality Engineering. Test strategy, test data, environment fidelity, defect triage, and—critically—where in the lifecycle defects are detected. Quality is a system property, and Chapter 8 argues it cannot be outsourced even when testing execution is.
- DevOps and Delivery Mechanics. CI/CD, deployment automation, rollback capability, environment provisioning, release governance. This layer converts completed work into delivered value; when it is weak, finished code is not shipped value, it is inventory.
- Observability. Logs, metrics, traces, SLOs, alerting quality. Observability determines how quickly the organization learns that something is wrong and how expensively it discovers why.
Layer 4 — Memory
- Documentation. Architecture Decision Records, runbooks, system maps, onboarding paths. Memory determines whether the organization compounds knowledge or re-derives it each cycle. See Chapter 7.
- Leadership. The presence of technical leaders with both authority and context; the speed and quality of decisions; the willingness to make trade-offs explicit rather than deferring them into the code.
- Culture. Psychological safety to report bad news early, incentives that reward durability over apparent speed, and the organizational habit of investigating causes rather than assigning them.
Supply
- Vendor Capability. Technical depth, domain familiarity, engineering maturity, communication quality, staffing stability, and commercial alignment.
2.3 How the factors interact
Three interaction rules make the model predictive rather than descriptive.
Rule 1 — Upper layers bound lower layers. No amount of DevOps excellence compensates for an architecture that forces coordinated releases across six services. No test automation strategy compensates for requirements that are ambiguous about intended behavior. Investment below a defective layer produces diminishing returns and, frequently, sophisticated workarounds that increase long-term cost.
Rule 2 — Supply multiplies; it does not substitute. Vendor capability scales whatever the system produces. This is why the same supplier can be excellent for one client and mediocre for another, and why reference checks are weak predictors: you are observing C × S at another company and attributing all of it to C.
Rule 3 — The binding constraint dominates. Performance is governed by the weakest layer that current work must traverse. If ownership is unclear, improving CI pipeline speed by 40% changes cycle time by almost nothing, because the wait state is approval, not build. This is why organizations sometimes make substantial engineering investments with no visible delivery improvement: the investment was real, but it was not on the constraint.
2.4 A worked illustration
Consider two companies engaging the same software development partner with identical team composition.
| Dimension | Company A | Company B |
|---|---|---|
| Requirements | Acceptance criteria defined with QA before sprint | Requirements arrive as Slack threads |
| Architecture | Clear service boundaries, versioned contracts | Shared database across four teams |
| Ownership | Named owner per service in a catalog | "The platform team, probably" |
| CI/CD | Trunk-based, deploy on merge, automated rollback | Weekly release train, manual verification |
| Observability | SLOs with error budgets | Dashboards, no alerting thresholds |
| Documentation | ADRs required for boundary changes | Tribal, held by two engineers |
The vendor's engineers are equally skilled in both accounts. In Company A they will deliver features. In Company B they will spend an estimated 40–60% of capacity on coordination, environment issues, ambiguity resolution, and defensive verification. Within two quarters, Company B will conclude the vendor underperforms. They will be measuring S, and reporting it as C.
"Engineering performance is built into the system long before a new supplier joins the project."
2.5 Implication for the replacement decision
The EPM converts a binary question ("is this vendor good enough?") into a diagnostic one ("which layer is binding, and who owns it?"). If the binding constraint sits in Intent, Structure, Flow, or Memory, replacement changes the multiplier applied to an unchanged system—and the Replacement Reset Curve follows. If the binding constraint genuinely sits in Supply, replacement is correct and should be executed decisively.
Chapter 4 provides the instrument for making that determination. Chapter 3 first explains why even excellent suppliers cannot escape the constraint.
Chapter 3 — Vendors Deliver Systems They Inherit
3.1 The inheritance ledger
On day one of an engagement, an incoming engineering partner receives a package that no contract enumerates. We call it the Inheritance Ledger, and it typically contains seven items:
| Inherited asset | What the vendor receives | What they cannot change unilaterally |
|---|---|---|
| Architecture | Existing boundaries, coupling, data model | Boundaries owned by client architecture |
| Processes | Sprint cadence, approval chains, release calendar | Cross-functional process design |
| Technical debt | Accumulated shortcuts and deferred decisions | Prioritization of remediation |
| Documentation quality | Whatever exists, at whatever fidelity | The organization's writing culture |
| Communication structure | Who talks to whom, through which channel | Client-side org design |
| Decision history | Why things are the way they are — or the absence of that record | The past |
| Business priorities | The roadmap and its volatility | Product strategy |
Every one of these constrains the vendor's achievable output. Six of the seven are wholly or substantially controlled by the buying organization.
3.2 The context deficit
The most expensive item on that ledger is usually the sixth: decision history. Codebases record what was decided. They rarely record why.
An incoming team encountering an unusual retry configuration, a denormalized table, or a service that seems redundant faces three options: preserve it without understanding (accumulating fear), remove it and discover the reason in production (accumulating incidents), or investigate (accumulating cost). In systems without Architecture Decision Records, teams spend a measurable share of their first two quarters performing software archaeology.
This is not a vendor deficiency. It is a memory deficiency in the client system, and it is charged to the vendor's velocity.
3.3 What a vendor can and cannot do
A useful separation:
| A capable partner CAN | A capable partner CANNOT |
|---|---|
| Raise architectural concerns and propose alternatives | Approve architectural change across client-owned domains |
| Improve their own engineering practices and code quality | Install decision rights inside the client organization |
| Write documentation for what they build | Create the client's documentation culture or enforce it |
| Automate the parts of CI/CD they control | Rebuild a delivery pipeline they do not own |
| Report ambiguity in requirements | Resolve product strategy conflicts |
| Deliver against a stable roadmap | Stabilize a volatile one |
| Transfer knowledge on exit | Force the client to absorb it |
| Improve execution | Improve governance |
The right column is not a list of vendor limitations. It is a list of buyer responsibilities. When those responsibilities are unheld, the resulting symptoms surface inside the vendor's delivery metrics, which is exactly why misattribution is so easy.
3.4 The onboarding illusion
Many organizations evaluate a new partner during the first ninety days, when the team is working almost entirely on Layer 3 concerns (Flow) and has not yet reached Layer 1 and 2 constraints. The evaluation therefore measures the vendor's engineering hygiene—real, but not the variable that determines the next three years.
A more informative evaluation window is months seven through twelve, when the team has hit structural limits. The question at that point is not "are they fast?" but "what did they do when they encountered the constraint?" A strong partner escalates it with evidence and a proposal. A weak one absorbs it silently into estimates. A weak system ignores the escalation. All three outcomes look similar in a burndown chart and are entirely different problems.
3.5 Structural handicap, not excuse
It is important not to over-rotate. Inheritance explains constraint; it does not excuse poor engineering. A partner who inherits a difficult system and responds with weak code review, unstable staffing, or silence about risk is genuinely underperforming, and Chapter 14 provides the instrument to detect that during selection.
The claim is narrower: when the inherited system is weak, vendor capability is compressed toward the system mean, and differences between suppliers become difficult to observe. That compression is the reason replacement yields temporary gains. It is also the reason that improving the system yields gains that persist across suppliers—including the current one.
"You do not hire a vendor into a codebase. You hire them into a decision history, a release process, and a set of unwritten rules."
Chapter 4 — Symptoms vs Root Causes
4.1 Why symptom-level management fails
Delivery organizations are rich in symptoms and poor in diagnoses. Symptoms are visible, quantified, and reported weekly. Causes are structural, distributed, and reported almost never. The result is a management system optimized for reacting to the observable, which systematically produces interventions aimed at the wrong layer.
The Root Cause Matrix below is designed to interrupt that reflex. It maps each common symptom to a locus of causation, the accountable party, a discriminating test that distinguishes a supply cause from a system cause, and the intervention that actually resolves it.
4.2 Locus classes
Every symptom is assigned to one of five loci, corresponding to the EPM layers:
- I — Intent (strategy, requirements)
- S — Structure (architecture, ownership)
- F — Flow (practices, quality, DevOps, observability)
- M — Memory (documentation, leadership, culture)
- V — Supply (vendor capability)
4.3 The Root Cause Matrix
| Symptom | Common misattribution | Likely locus | Discriminating test | Effective intervention |
|---|---|---|---|---|
| Missed deadlines | "The team is slow" | I / S | Measure requirement churn after sprint start. >20% ⇒ Intent, not supply | Requirement definition-of-ready; estimate ranges tied to ambiguity |
| Slow releases | "They can't ship" | F | Time from merge to production for a one-line change | Deployment automation, rollback, release governance |
| High defect escape rate | "Poor testing" | I / F | Classify defects by origin: spec, design, code, environment | Fix the dominant origin class, not the test count |
| Frequent production incidents | "Careless engineering" | S / F | Ratio of incidents caused by change vs. by load/dependency | Contract testing, canary releases, SLOs |
| Estimates always wrong | "Sandbagging" | I / M | Variance in estimates for well-documented vs. undocumented modules | ADRs, system maps, spike budgets |
| Developer turnover on the account | "Vendor staffing problem" | M / V | Exit reasons: growth vs. frustration with system | Distinguish genuine supply issue from knowledge concentration |
| Architecture instability | "Bad technical decisions" | S / M | Count of boundary changes made without an approving owner | Architecture review gate; named domain owners |
| Knowledge lost at handover | "Weak transfer" | M | Percentage of critical services with a current runbook | Knowledge Continuity Model (Ch. 7) |
| Endless clarification cycles | "Communication issues" | I | Median time from question raised to decision received | Named decision owner per domain, response SLA |
| Regression after every release | "Quality problem" | F / S | Coupling analysis: modules changed per feature | Boundary refactoring, contract tests |
| Rising cost per feature | "Vendor is expensive" | S | Trend of story points per feature over 8 quarters | Technical debt remediation programme |
| Nobody will touch module X | "Skill gap" | M / S | Does a current design document exist for X? | Characterization tests, then documentation, then refactor |
| Two teams block each other | "Coordination overhead" | S | Shared database or shared deployment unit? | Service/data ownership split |
| Security findings recur | "Vendor negligence" | F / M | Are standards written, automated, and enforced in CI? | Policy-as-code, automated gates |
| Product dissatisfied with output | "Wrong team" | I | Was acceptance criteria agreed before build? | Three-way definition of ready (product, eng, QA) |
| Onboarding takes 3+ months | "Slow ramp" | M | Time to first meaningful production change for a new joiner | Onboarding path, environment automation, docs |
| Genuine expertise gap | — | V | Can the team articulate trade-offs in the required domain? | Supply intervention: replace or augment |
| Misrepresented seniority | — | V | Interview audit vs. delivered work quality | Supply intervention: escalate or replace |
| Chronic unresponsiveness | — | V | Escalation response time against SLA | Supply intervention: contractual remedy |
The final three rows matter as much as the first sixteen. They are genuine supply problems, and for them, replacement or renegotiation is the correct answer. The purpose of the matrix is not to defend suppliers; it is to route each symptom to the intervention that resolves it.
4.4 The two-question triage
For rapid diagnosis under executive time pressure, two questions eliminate most misattribution:
Question 1: Did this symptom exist under the previous supplier? If yes, the probability that it is supply-caused drops sharply. Symptoms that survive a change of team are properties of the system by definition.
Question 2: Would this symptom disappear if we replaced the team with our best internal engineers? If honest reflection says no—because the architecture, the approvals, the environments, or the ambiguity would slow anyone—then the cause is not supply.
Organizations that adopt these two questions as a standing gate before any escalation report a marked reduction in unnecessary transitions.
4.5 Defect origin classification
One practice deserves specific emphasis because it converts an opinion into data. Rather than counting defects, classify each by origin:
| Origin class | Definition | Owner of remedy |
|---|---|---|
| Specification | Behavior was ambiguous or wrong in the requirement | Product / Intent |
| Design | Requirement correct, design inadequate | Architecture / Structure |
| Implementation | Design correct, code incorrect | Delivery team / Supply |
| Environment | Code correct, environment differed | Platform / Flow |
| Data | Code correct, production data violated assumptions | Data ownership / Structure |
| Integration | Contract between components misunderstood | Interface ownership / Structure |
In most organizations that adopt this classification for the first time, implementation defects—the only class attributable to the delivery team's coding quality—account for a minority of escaped defects. That single measurement frequently ends a replacement debate.
Chapter 5 — Architecture Outlives Vendors
5.1 The durability asymmetry
Contracts run two to three years. Engineering teams turn over in eighteen to thirty-six months. Architecture persists for eight to fifteen years, and its most consequential decisions—the data model, the service boundary, the synchronous-versus-asynchronous choice, the tenancy model—persist longer than the careers of the people who made them.
This asymmetry is the structural reason vendor replacement underdelivers. The variable being changed has a short half-life. The variable determining the cost of change has a long one.
5.2 How architecture sets the cost of every future decision
Architecture is often discussed as a technical aesthetic. It is more usefully understood as a pricing function: it sets the cost of every future change the business will want to make.
- Coupling sets coordination cost. If a feature requires changes in four deployment units owned by three teams, the coordination overhead is architectural, not cultural.
- Data ownership sets change confidence. A shared database is a shared blast radius. Teams respond rationally by slowing down.
- Boundary clarity sets parallelism. Clean boundaries allow independent work; unclear ones serialize it regardless of headcount.
- Deployment granularity sets release risk. If the smallest deployable unit contains six months of accumulated change, every release is an event requiring ceremony.
None of these change when the logo on the invoice changes.
5.3 Architecture patterns and their vendor implications
Monoliths. A well-structured modular monolith is often an excellent choice, particularly for smaller organizations, and is frequently easier for a new partner to onboard into than a poorly bounded distributed system. The problem is rarely the monolith; it is the unmodularized monolith, where the absence of internal boundaries means any change can affect anything. In that state, an incoming team cannot reason about blast radius, so they either move slowly or cause incidents.
Microservices. Distributed architecture shifts complexity from code to operations and contracts. When adopted without contract testing, service ownership, and observability, it produces the worst combination: distributed system failure modes plus monolithic coupling. This is the pattern most likely to be misdiagnosed as a vendor problem, because the symptoms—slow features, cross-team blocking, mysterious incidents—look like execution failures.
Legacy systems. Systems carrying a decade of business logic are often the most valuable and least documented assets in the company. They resist replacement because nobody can enumerate their behavior. Vendors rotate around them; the system does not move. Characterization tests and behavior documentation, not new suppliers, unlock them.
Integration complexity. In enterprise software, healthcare, and fintech especially, a large share of engineering effort is spent on integration with systems the organization does not control. Integration surface area is an architectural property, and it determines a substantial fraction of both defect rate and estimate variance.
Platform evolution. Organizations that build internal platform capability—paved paths, self-service environments, shared observability, golden templates—raise the system coefficient for every team, internal and external. Platform engineering is arguably the highest-leverage response to the problem this paper describes, because it changes S for all current and future suppliers simultaneously.
5.4 The architecture ownership question
The single most diagnostic question about an engineering organization is: who is accountable for architectural coherence, and do they have the authority to say no?
Four common answers, and their consequences:
| Ownership model | Description | Typical outcome |
|---|---|---|
| No owner | Architecture emerges from local decisions | Divergence, duplicated concepts, integration debt |
| Vendor-owned | The supplier makes structural decisions | Architecture optimized for the supplier's context; discontinuity at transition |
| Central architect(s) | A small internal group owns boundaries and standards | Coherence, with bottleneck risk if under-resourced |
| Federated with standards | Domain owners decide within client-owned guardrails, reviewed by an architecture forum | Highest scalability; requires governance maturity (Ch. 6) |
The second row deserves emphasis and care. Delegating architectural decisions to a partner is not a criticism of the partner—capable suppliers make good architectural decisions. It is a structural risk, because architecture is the longest-lived artifact and the vendor relationship is not. When suppliers own structure, every transition becomes an architectural discontinuity, and the organization accumulates layers of differently-reasoned design.
5.5 Architecture as a delivery lever
Practical, sequenced moves that raise the system coefficient without a rewrite:
- Map it. Produce a current-state system map with owners. Most organizations discover their mental model is two years stale.
- Find the coupling hotspots. Analyze which modules change together across the last twelve months of commit history. Co-change is empirical coupling and is more honest than the diagram.
- Establish contracts before refactoring. Versioned interfaces with contract tests allow independent evolution and are cheaper than boundary changes.
- Split by ownership, not by technology. Boundaries should follow the seams of accountability and data, not framework preferences.
- Retire, don't just add. Every architectural addition without a corresponding retirement increases the inheritance burden for the next team.
"Architecture is the only part of your engineering organization that is guaranteed to outlast the people who built it and the contracts that funded it."
Chapter 6 — Engineering Governance
6.1 What governance is, and is not
Governance in engineering is frequently confused with bureaucracy—committees, approval forms, and process weight. That confusion is understandable, because badly implemented governance produces exactly that.
Properly understood, engineering governance is the allocation of decision rights and the definition of evidence required to pass between states. It answers two questions: who decides? and what must be true before this proceeds? Nothing more. When those two questions have clear answers, process weight goes down, not up, because the dominant source of delay in most engineering organizations is not review—it is waiting for someone to decide who decides.
6.2 The Decision Spine
We propose a five-class taxonomy of engineering decisions, with explicit delegation rules. We call it the Decision Spine.
| Class | Decision type | Examples | Delegable to a supplier? |
|---|---|---|---|
| D1 | Strategic Intent | What we build, for whom, at what quality bar; build vs. buy; platform strategy | Never |
| D2 | Architectural | Service boundaries, data ownership, tenancy model, primary technology stack | Never (advise, not decide) |
| D3 | Interface & Contract | API contracts, event schemas, integration patterns, SLAs | Shared — joint decision, client ratifies |
| D4 | Implementation | Internal design, libraries within standards, code structure, test design | Yes — delegate fully |
| D5 | Operational | Task sequencing, branching hygiene, day-to-day execution | Yes — delegate fully |
The delegation rule is compact: delegate D4 and D5 entirely, share D3 with ratification, and retain D1 and D2 permanently.
Two failure modes follow from violating it. Over-delegation occurs when a client, lacking internal capacity, allows a partner to make D1/D2 decisions; the organization then experiences architectural discontinuity at every transition and cannot evaluate the decisions it inherited. Under-delegation occurs when a client approves D4/D5 decisions; this creates the queueing delays commonly misdiagnosed as vendor slowness, and it demoralizes capable engineers.
A healthy engagement has a written Decision Spine allocation, reviewed quarterly, and referenced when escalations occur.
6.3 The Four Gates
Decision rights answer who. Gates answer what must be true. Four gates cover the lifecycle; each defines entry evidence, not a meeting.
Gate 1 — Intent Gate. Work may not enter development until: the business outcome is stated, acceptance criteria exist, non-functional requirements (performance, security, compliance, availability) are explicit, and a named decision owner is assigned for open questions. Evidence: a definition-of-ready checklist agreed by product, engineering, and QA.
Gate 2 — Design Gate. Work that crosses a service boundary, changes a data contract, introduces a dependency, or affects a compliance-relevant path requires design review before implementation. Evidence: a lightweight design note or ADR with the alternatives considered. Work that does not cross those thresholds skips this gate entirely—this exemption is what keeps the gate from becoming bureaucracy.
Gate 3 — Change Gate. Code may not merge without: passing automated tests at the agreed coverage of critical paths, passing security and dependency scans, review by a qualified reviewer, and updated documentation where the change alters documented behavior. Evidence: automated, in CI. A gate enforced by humans is a suggestion; a gate enforced by pipeline is a gate.
Gate 4 — Production Gate. A release may not proceed without: a rollback path, observability for the new behavior, an owner on call, and an SLO impact assessment for changes to critical paths. Evidence: release checklist, automated where possible.
  Intent Gate  →  Design Gate  →  Change Gate  →  Production Gate
   (what/why)      (how)          (correct)       (safe/observable)
       ▲                                                 │
       └──────────── feedback: incidents, defects ────────┘
6.4 The governance components
Beyond decision rights and gates, five supporting mechanisms complete the framework:
Architecture review. A standing forum—typically biweekly, forty-five minutes—where D2 and D3 decisions are presented, challenged, and recorded. Its output is not approval theatre; its output is written decisions with rationale, which become the ADR corpus.
Technical standards. Written and, wherever possible, automated. Standards that live in a wiki are aspirations; standards enforced in CI are guarantees. This distinction matters enormously in multi-vendor environments: automated standards apply identically to every contributor regardless of employer.
Quality gates. Covered in Chapter 8, but governance-relevant because the thresholds are a client decision (D1-adjacent) even when the implementation is delegated.
Risk management. A register of known architectural, operational, security, and knowledge-concentration risks with named owners and review cadence. Knowledge concentration—the "bus factor" per critical service—belongs on this register and is almost never there.
Engineering accountability. Clear, non-punitive accountability: named owners for services, decisions, and incidents; blameless postmortems with tracked actions; and a review cadence that examines whether prior decisions produced their expected outcomes. The last item is rare and disproportionately valuable.
6.5 Governance in multi-vendor and hybrid environments
Organizations running several partners simultaneously, or a mix of internal and external teams, face an additional requirement: governance must be supplier-neutral. If standards, gates, and decision rights differ by contract, the architecture will fragment along commercial lines. Practical rules:
- One set of technical standards, applied to all contributors.
- One CI/CD pipeline with identical gates for all code.
- One architecture forum, with all parties represented.
- One definition of done.
- One incident process and on-call standard.
- Documentation obligations identical across contracts, and enumerated in the statement of work.
This is also the strongest protection against transition risk. When governance is supplier-neutral, replacing a partner is an operational event rather than a structural one.
"Governance is not the process you add to slow engineers down. It is the answer to the question they are already waiting for."
Chapter 7 — Documentation as Organizational Memory
7.1 The compounding problem
Documentation is treated as a hygiene activity and funded accordingly. It is more accurately a continuity mechanism: the means by which an organization retains what it learned after the people who learned it have gone.
In a stable, co-located team, weak documentation is survivable because tacit knowledge persists in the room. In a distributed, multi-vendor, or high-turnover environment, tacit knowledge exits on a contractual schedule. The organization then pays for the same understanding repeatedly, and each purchase is more expensive than the last, because the system has grown in the interim.
Without documentation, every vendor starts from zero—and zero gets further from the present state each year.
7.2 The Knowledge Continuity Model
Documentation maturity is better described as a ladder than a binary. The Knowledge Continuity Model (KCM) defines five tiers.
| Tier | Name | Description | Behavior at transition |
|---|---|---|---|
| T1 | Tacit | Knowledge exists only in individuals' heads | Total loss; full re-derivation |
| T2 | Tribal | Shared verbally within a team; scattered in chat history | Partial loss; archaeology required |
| T3 | Written | Documents exist but drift from reality; trust is low | Documents consulted then verified against code — modest gain |
| T4 | Executable | Documentation is code-adjacent and verified: contract tests, generated API specs, infrastructure-as-code, runnable runbooks | Reliable; new team can trust and act |
| T5 | Enforced | Documentation obligations are gated in CI; drift breaks the build; decisions are recorded as a matter of process | Continuity is structural, not dependent on individuals |
The critical transition is T3 → T4. Written documentation that cannot be verified decays into a liability, because an incorrect document is worse than none: it produces confident errors. The design principle for T4 is make the documentation executable, or make its accuracy machine-checkable, or accept that it will be wrong.
7.3 The four essential artifacts
Organizations attempting comprehensive documentation usually fail. Four artifact types deliver the majority of continuity value.
Architecture Decision Records (ADRs). Short documents—typically under a page—recording context, the decision, alternatives considered, and consequences. ADRs are the highest-leverage documentation artifact in existence for multi-vendor environments, because they preserve why, which is the information code cannot carry. A practical rule: any D2 or D3 decision produces an ADR, and the ADR is a merge requirement.
Runbooks. Operational procedures for known conditions: how to fail over, how to reprocess a queue, how to handle a specific alert, what "normal" looks like. Runbooks should be validated by execution—during game days or real incidents—not by review. An unvalidated runbook is T3.
System maps. Current-state views of services, data stores, integrations, and ownership. Best generated from source (service catalogs, IaC, dependency graphs) rather than drawn, so they cannot drift. A system map with named owners doubles as an ownership register.
Playbooks and onboarding paths. The sequence a new engineer follows to reach first meaningful production change. This artifact is uniquely measurable: time-to-first-production-change is a direct proxy for documentation quality and correlates strongly with transition cost.
7.4 Knowledge transfer as an engineering practice
Knowledge transfer is typically scheduled at the end of a relationship, which is the point of minimum motivation and maximum time pressure. This guarantees the worst possible outcome.
A more effective approach treats continuity as an ongoing obligation:
| Practice | Cadence | Effect |
|---|---|---|
| ADR on every boundary decision | Per decision | Preserves rationale continuously |
| Runbook validation via game day | Quarterly | Converts T3 to T4 |
| Rotating service ownership within the team | Per quarter | Reduces knowledge concentration |
| Documentation obligations in the SOW | Contractual | Makes continuity a deliverable |
| "New joiner" documentation audit | Per onboarding | Uses fresh eyes to detect drift |
| Client-side technical counterpart per domain | Continuous | Retains context on the buyer side |
The last row deserves emphasis. The most reliable protection against knowledge loss is not documentation alone; it is the presence of at least one client-side engineer or architect per critical domain who holds context permanently. Documentation makes that person efficient. It does not replace them.
7.5 Measuring documentation
Three metrics convert documentation from an aspiration to a managed property:
- Documentation Coverage — percentage of critical services with a current system map entry, named owner, and validated runbook.
- Documentation Freshness — median age of documents relative to last material code change in the corresponding area.
- Time to First Production Change — median days for a new engineer to ship a meaningful change safely.
The third is the outcome metric; the first two are its leading indicators.
"Documentation is the interest payment that prevents your knowledge debt from compounding across every team you will ever hire."
Chapter 8 — Quality Engineering Is Independent of Vendors
8.1 The delegation error
Of all engineering functions, quality is the one most often delegated wholesale to a supplier—and the one least capable of being delegated. The reasoning behind the delegation is sound in its premise: testing is labor-intensive, specialized, and scalable, and partners provide it efficiently. The error is in conflating testing execution with quality engineering.
Testing execution is the act of verifying that software behaves as specified. It is genuinely delegable. Quality engineering is the set of system properties that determine how many defects are created, how early they are detected, and how cheaply they are corrected. Those properties live in requirements, architecture, environments, pipelines, and observability—four of which the supplier does not own.
An organization that delegates quality engineering has delegated an outcome it controls the inputs to. When defects escape, the supplier is blamed for a result produced upstream.
8.2 Where defects are actually created
The cost of a defect rises by roughly an order of magnitude at each stage it survives. The distribution of defect origins, introduced in Chapter 4, is therefore the most important quality measurement an organization can take.
| Stage of introduction | Typical share of escaped defects | Detected cheaply by |
|---|---|---|
| Requirements / specification | Substantial in low-Intent organizations | Three-way acceptance criteria review |
| Architecture / design | Concentrated in coupled systems | Design review, ADRs, contract definition |
| Implementation | The only class a delivery team fully owns | Code review, unit tests, static analysis |
| Integration | Rises sharply with service count | Contract tests, consumer-driven testing |
| Environment / configuration | Rises with environment divergence | IaC, ephemeral environments, config validation |
| Data | Chronic in legacy and multi-tenant systems | Production-like data, validation, schema contracts |
The pattern worth internalizing: when a client's Intent and Structure layers are weak, most escaped defects originate before the delivery team writes a line of code. Increasing the test budget in that situation improves detection marginally while leaving creation untouched. Cost rises; quality does not.
8.3 Quality as a system property: the six embedded controls
Quality engineering embedded into the system, rather than appended to it, comprises six controls.
1. Requirements quality. The cheapest defect prevention available. Acceptance criteria written collaboratively by product, engineering, and QA before development starts eliminate an entire defect class. The practice is inexpensive and consistently under-adopted because it costs time in a phase where time feels less urgent.
2. Architecture review for testability. Testability is an architectural property. Systems with clear boundaries, dependency injection, and stable contracts can be tested cheaply; systems without them cannot be tested at any price, which is why organizations with poor architecture end up with expensive, slow, flaky end-to-end suites.
3. Test automation strategy. Not "more tests" but the right distribution: fast unit tests for logic, contract tests at boundaries, a thin layer of end-to-end tests for critical journeys, and explicit non-functional testing for performance and security. The most common anti-pattern in outsourced quality is an inverted pyramid—heavy UI automation because it is easy to scope and bill, brittle because it depends on everything.
4. CI/CD integration. Quality gates that are not automated are advisory. A test suite that runs nightly and is triaged weekly does not prevent defects; it documents them. Quality controls must execute in the path between merge and production, and they must be able to stop it.
5. Production monitoring as the final test. No pre-production strategy achieves complete coverage. Mature organizations accept this and invest in the ability to detect and reverse quickly: SLOs, error budgets, canary releases, feature flags, and automated rollback. This shifts a portion of quality investment from prevention to fast recovery—usually a better return.
6. Continuous learning. Every escaped defect and every incident carries information about which control failed. Blameless postmortems with tracked, verified actions convert incidents into system improvements. Without this loop, an organization experiences the same class of failure indefinitely and interprets it as a staffing problem.
8.4 What to delegate and what to retain
| Quality function | Delegable? | Rationale |
|---|---|---|
| Test case design and execution | Yes | Specialized, scalable, well-suited to partners |
| Automation implementation | Yes | Within a client-owned framework and standard |
| Test data management | Shared | Depends on client data governance and compliance |
| Test strategy | Shared | Client sets risk appetite; partner proposes approach |
| Quality gate thresholds | Retain | A business risk decision (D1-adjacent) |
| Definition of done | Retain | Applies uniformly to all contributors |
| Environment strategy | Retain | Platform-owned; determines environment defect class |
| Acceptance criteria | Retain | Intent layer; cannot be delegated |
| Production SLOs | Retain | Business commitment to users |
| Incident learning loop | Retain | Organizational memory |
8.5 The Quality Maturity ladder
| Level | Characteristics | Defect economics |
|---|---|---|
| Q1 — Detection | Manual testing at the end; quality is a phase | Defects found late, fixed expensively |
| Q2 — Automation | Regression automated; still post-development | Cheaper regression, unchanged creation rate |
| Q3 — Integration | Tests in CI, gates enforced, contract tests at boundaries | Defects caught pre-merge |
| Q4 — Prevention | Acceptance criteria upstream, testability in design review, defect origin tracking | Creation rate falls |
| Q5 — Adaptive | Production feedback drives test investment; error budgets govern release pace | Investment allocated by evidence |
Movement from Q1 to Q3 is largely a supplier-executable programme. Movement from Q3 to Q5 requires the client's Intent and Structure layers, and cannot be purchased.
"You can outsource testing. You cannot outsource the conditions under which defects are created."
Chapter 9 — DevOps and Delivery Systems
9.1 Finished is not delivered
The delivery system converts completed engineering work into value in production. When it is weak, the organization accumulates inventory: work that is done but not shipped, aging, conflicting with other in-flight work, and losing value.
This distinction reframes a common complaint. When leadership says "the team is slow," the measurement is usually lead time from request to production. If the delivery system contributes a two-week release cycle, a manual verification step, and a change advisory board, then a substantial and fixed portion of lead time is unrelated to the team producing the work. Replacing that team changes the smaller component of the equation.
9.2 The five delivery capabilities
Five capabilities determine the throughput and safety of a delivery system. Each is client-owned in most engagements.
Continuous integration. Every change integrates into the mainline frequently, with automated verification. The failure mode is long-lived branches, which convert integration from a continuous, cheap activity into a periodic, expensive, high-risk one. Merge conflicts and integration defects then appear as quality problems.
Deployment automation. Deployment is a script, not a runbook performed by a person at a keyboard. Manual deployment produces three compounding effects: it is error-prone, it is expensive enough that teams batch changes, and batching increases the blast radius of each release, which justifies more ceremony, which increases cost. This loop is self-reinforcing and is very often diagnosed as a vendor discipline problem.
Rollback and recovery. The ability to reverse a change quickly is the single highest-leverage safety property in a delivery system. Organizations that can roll back in minutes can afford to deploy frequently, which reduces batch size, which reduces risk. Organizations that cannot roll back must prevent all failures, which is impossible, so they slow down instead.
Environment management. Environment divergence produces the "works in staging" defect class. Infrastructure-as-code, ephemeral per-branch environments, and production-like data (appropriately masked) eliminate most of it. Where environments are scarce and shared, teams queue, and queueing appears in delivery metrics as slowness.
Release governance and observability. Who approves a release, on what evidence, and how is its effect observed? Mature organizations replace approval-by-authority with approval-by-evidence: automated gates, canary metrics, SLO impact, and automated rollback triggers. Observability is what makes evidence-based release possible.
9.3 Why supplier change cannot compensate
| Delivery deficiency | Consequence | Effect of replacing the vendor |
|---|---|---|
| Broken or slow CI | Long feedback loops, integration defects | None — pipeline is client-owned |
| Manual deployments | Batching, release ceremony, high change risk | None — process is client-owned |
| No rollback path | Risk aversion, slow release cadence | None — architectural and operational |
| Environment scarcity | Queueing, environment-class defects | None — platform-owned |
| Weak observability | Slow detection, expensive diagnosis | None — instrumentation is systemic |
| Approval-heavy release governance | Fixed lead time overhead | None — organizational design |
The right-hand column is the point of the chapter. Six of the most common causes of slow delivery are entirely unaffected by which company employs the engineers.
9.4 A diagnostic: the one-line-change test
A single measurement exposes the state of a delivery system more reliably than any survey. Measure the elapsed time for a one-line, low-risk change to reach production, from commit to serving traffic.
The change contains no engineering complexity. Whatever time it consumes is pure system overhead.
| Result | Interpretation |
|---|---|
| Under 1 hour | Strong delivery system; capacity constraints are elsewhere |
| 1 hour – 1 day | Functional; some manual steps or batching |
| 1 day – 1 week | Significant system overhead; feature lead time is dominated by delivery, not development |
| Over 1 week | The delivery system is the binding constraint; supplier change will not move the metric |
Organizations that run this test before a replacement decision frequently discover that the ceiling on delivery speed is structural, and that the same ceiling would apply to any team, internal or external, at any level of skill.
9.5 Delivery models compared
| Model | Deployment frequency | Change failure recovery | Coordination cost | Fit |
|---|---|---|---|---|
| Manual release train | Weekly to monthly | Hours to days | High | Legacy, regulated environments without automation investment |
| Automated pipeline, scheduled release | Weekly | Under an hour | Medium | Mid-maturity organizations |
| Continuous delivery, manual promotion | Daily | Minutes | Low | Most enterprise SaaS |
| Continuous deployment with progressive rollout | Multiple per day | Automatic | Very low | High-maturity platform organizations |
Movement down this table is available to organizations at any level of vendor quality, and produces improvement that persists across every future supplier.
"Work that is complete but undeployed is not progress. It is inventory, and inventory depreciates."
Chapter 10 — AI Changes Vendor Management
10.1 The amplification effect
AI-assisted development changes the economics of software delivery, and it does so asymmetrically. It substantially increases the rate at which code is produced, and it does not, by itself, increase the rate at which code is reviewed, understood, tested, operated, or reasoned about.
This has a direct consequence for the model in Chapter 2. If AI raises C—the capability and throughput of the supply side—and S remains unchanged, then the product C × S rises only in proportion to S. In systems with a low coefficient, AI amplifies the existing bottleneck rather than relieving it: more code enters an architecture that was already difficult to reason about, guarded by a test suite that was already inadequate, deployed through a pipeline that was already slow, documented by a memory layer that was already thin.
AI increases the return on strong engineering systems and increases the cost of weak ones. It does not flatten the difference between them; it widens it.
10.2 Verification debt
We introduce a term for the specific liability AI creates: verification debt, the gap between code that has been produced and code that has been genuinely understood and validated by an accountable engineer.
Verification debt has three properties that make it more dangerous than conventional technical debt:
- It accrues silently. AI-generated code is typically syntactically clean, idiomatic, and plausible. It does not look like debt.
- It is unevenly distributed. It concentrates in areas where review capacity is scarce—unfamiliar domains, legacy modules, infrastructure code—which are precisely the areas where errors are most expensive.
- It compounds with reuse. Unverified code becomes context for the next generation, and patterns propagate.
The governing constraint in AI-assisted delivery is therefore not generation capacity. It is review capacity: the availability of engineers with sufficient context to validate what was produced. Organizations that scale generation without scaling review are converting a throughput gain into a risk position.
10.3 Implications for vendor management
Several established practices require revision.
Output volume is no longer a proxy for value. Story points, lines of code, commit counts, and PR volume were always imperfect; with AI assistance they are actively misleading. Contract structures and performance reviews built on volume will produce volume.
Code provenance becomes a governance concern. Organizations need a position on which code is AI-generated, at what level of human verification, with what licensing exposure, and with what handling of proprietary context in prompts. This applies to internal teams and partners identically, and it belongs in the statement of work.
Review becomes the scarce, retained resource. If AI expands supplier throughput, the client must expand its capacity to validate. This may mean fewer, more senior client-side engineers rather than more—an inversion of the usual scaling instinct.
Test strategy must shift toward specification. When implementation is cheap, the differentiating asset is a precise statement of intended behavior. Executable specifications, property-based tests, and contract tests become disproportionately valuable, because they verify generated code without requiring line-by-line human reading.
Architecture becomes more valuable, not less. Clear boundaries make AI assistance safer, because the blast radius of a wrong generation is bounded and the context an assistant needs is smaller and more coherent.
10.4 The AI governance ladder
| Level | Practice | Risk posture |
|---|---|---|
| A0 | No policy; individual discretion | Unknown provenance, unmanaged IP and quality exposure |
| A1 | Usage policy exists; approved tools listed | Basic control; no verification requirement |
| A2 | Human accountability required per merge; AI-assisted changes flagged | Verification debt becomes visible |
| A3 | Automated verification scaled to match generation: contract tests, property tests, security scanning, dependency and license checks in CI | Debt bounded by pipeline |
| A4 | AI observability: evaluation of AI-in-product behavior, prompt and model versioning, output monitoring, drift detection | Production AI treated as a governed system |
| A5 | Adaptive: review capacity, test investment, and generation volume balanced by measured defect and incident evidence | Throughput scaled to verified safety |
10.5 AI inside the product
A distinct concern, increasingly common: when AI is a component of the delivered product rather than a development tool, it introduces failure modes traditional engineering governance does not cover—non-determinism, prompt injection, model version drift, evaluation rather than binary testing, and cost as a runtime variable.
This requires extensions to the framework in Chapter 6:
- Evaluation suites replace pass/fail tests for model-dependent behavior, with tracked quality thresholds rather than green/red gates.
- Prompt and model versions are release artifacts, versioned and rolled back like code.
- LLM observability—tracking output quality, latency, cost per request, refusal and error rates, and drift—joins standard telemetry.
- Guardrails are architecture, not features: input validation, output constraints, and human-in-the-loop paths for consequential decisions are structural decisions (D2), and therefore not delegable.
The strategic conclusion for vendor management is consistent with the paper's thesis: AI raises the ceiling on what a capable partner can deliver and simultaneously raises the floor of system maturity required to capture it. Organizations with strong governance will extract disproportionate value from AI-assisted partners. Organizations without it will generate technical debt faster than before—and will, in due course, attribute the result to the supplier.
"AI does not fix a weak engineering system. It fills it faster."
Chapter 11 — Enterprise Case Study
The following composite case is drawn from patterns observed across multiple enterprise engagements. Figures are representative placeholders and should be read as illustrative of relative movement rather than absolute benchmarks.
11.1 Context
A global B2B SaaS company, approximately 900 employees, serving mid-market and enterprise customers across three regions. The core product was a multi-tenant platform originally built as a modular monolith and partially decomposed into services over six years. Engineering comprised roughly 40 internal engineers and 60–80 partner engineers across two to three suppliers at any time.
The company's presenting complaint was consistent for five years: delivery was unpredictable, quality was inconsistent, and the roadmap slipped by 30–50% per quarter.
11.2 The rotation history
Vendor A (Years 1–2). Engaged during a growth phase to add capacity. Initially effective. By month fourteen, release delays and defect escapes became chronic. Root cause attributed to insufficient seniority. Relationship terminated.
Vendor B (Years 2–4). Selected specifically for domain expertise and senior staffing. Strong discovery phase; produced a well-received technical assessment identifying architecture and pipeline concerns. That assessment was not funded. By month eleven, the same delivery symptoms returned. Attributed to communication and timezone friction. Relationship terminated.
Vendor C (Years 4–5). Selected for co-located hours and a strong delivery management practice. Honeymoon period of five months. By month ten, escalations resumed with near-identical content to the Vendor A escalations from three years earlier.
Across all three engagements, the following remained unchanged: the shared database underlying four service teams; the two-week manual release process; the absence of a named architecture owner; the requirement intake process; and the documentation state.
11.3 The diagnostic
Before selecting a fourth supplier, the incoming VP of Engineering ran a system diagnostic rather than a vendor search. Four measurements were decisive:
- One-line-change test: 9 days from commit to production.
- Defect origin classification over one quarter: specification 31%, design/integration 34%, implementation 22%, environment 13%. Only the implementation share was attributable to delivery-team coding quality.
- Requirement churn: 38% of stories changed materially after development began.
- Ownership audit: 11 of 19 production services had no named owner.
The conclusion was that the binding constraint sat in Intent and Structure, with a substantial Flow contribution. Supply was not the constraint. The organization retained Vendor C and redirected the transition budget into system change.
11.4 The intervention
An eighteen-month programme, sequenced to produce early evidence:
| Phase | Duration | Focus |
|---|---|---|
| Stabilize | Months 1–3 | Named owners for all services; definition of ready; incident process; one-line-change baseline |
| Instrument | Months 3–6 | Deployment automation, rollback, ephemeral environments, defect origin tracking, SLOs on top 5 journeys |
| Govern | Months 6–12 | Decision Spine allocation; architecture forum; ADR requirement; automated standards in CI; supplier-neutral gates |
| Decouple | Months 9–18 | Data ownership split for the two highest-coupling domains; contract tests at boundaries |
| Adapt | Months 15–18 | Engineering Health Score reporting; quarterly system review; error-budget-based release pacing |
Notably, the partner delivered a significant share of this work. The client owned the decisions; the supplier owned much of the execution—an allocation consistent with the Decision Spine.
11.5 Results
Representative figures; directionally consistent with observed outcomes in comparable programmes.
| Metric | Before | After 18 months |
|---|---|---|
| Lead time, one-line change | 9 days | 4 hours |
| Deployment frequency | Every 2 weeks | 12–18 per week |
| Change failure rate | 22% | 6% |
| Mean time to recovery | 6.5 hours | 25 minutes |
| Requirement churn after sprint start | 38% | 11% |
| Escaped defects per release | 14 | 3 |
| Roadmap predictability (committed vs. delivered) | 55% | 87% |
| Services with named owner | 8 of 19 | 19 of 19 |
| Documentation coverage (critical services) | 21% | 78% |
| Time to first production change, new engineer | 47 days | 9 days |
| Engineering Health Score (Ch. 12) | 34 / 100 | 76 / 100 |
11.6 What the case demonstrates
Four observations, stated carefully.
First, the same supplier that was under evaluation for replacement delivered materially better results within twelve months. The variable that changed was not C. This is the clearest available evidence for the multiplier model.
Second, Vendor B's technical assessment in Year 2 had correctly identified the architecture and pipeline constraints. The organization possessed the correct diagnosis three years before it acted on it. The failure was not analytical; it was that the recommendations required client-side decisions and funding that no one owned. This is the most common way good vendor advice dies.
Third, the intervention cost roughly what one additional transition would have cost—and produced durable rather than temporary improvement.
Fourth, and importantly for balance: the earlier vendor changes were not irrational. Each was justified by real dissatisfaction and real symptoms. The error was diagnostic, not commercial. Had the constraint genuinely been in supply, the same decisions would have been correct.
"Three suppliers produced the same results because they were running the same system. The fourth result came from changing the system, not the supplier."
Chapter 12 — Measuring Engineering Health
12.1 Why delivery metrics are insufficient
Most organizations measure output—velocity, throughput, tickets closed—and a smaller number measure delivery performance using the four widely adopted flow metrics (lead time, deployment frequency, change failure rate, time to restore). Both are valuable. Neither is sufficient for the decision this paper addresses, because both measure the result of the system without describing its state.
An organization with deteriorating architecture, concentrating knowledge, and eroding ownership can maintain acceptable delivery metrics for several quarters before the decline becomes visible. By the time throughput degrades, the causes are eighteen months old. Leadership then observes a lagging indicator and reaches for the fastest available lever.
The Engineering Health Score (EHS) is proposed as a leading-indicator composite: ten sub-indices describing the state of the system rather than its recent output.
12.2 The ten indices
1. Architecture Stability Index (weight 12). Measures structural volatility and coupling. Inputs: number of service-boundary changes per quarter made without an approving owner; co-change coupling (percentage of features requiring changes in three or more deployment units); count of services sharing a data store. Falling scores predict rising cost per feature 2–4 quarters ahead.
2. Ownership Clarity (weight 12). Percentage of production services, datasets, and critical interfaces with a named, current, accountable owner; plus median time from question raised to decision received. The strongest single predictor of coordination delay.
3. Documentation Coverage (weight 10). Percentage of critical services with a current system map entry, validated runbook, and ADR history for boundary decisions; weighted by freshness relative to last material change.
4. Release Confidence (weight 12). A composite of change failure rate, rollback availability and tested recency, percentage of releases requiring manual verification, and the ratio of automated to human quality gates. Answers: can we ship on a Friday?
5. Deployment Reliability (weight 10). Deployment success rate, mean time to recovery, pipeline stability (percentage of failed builds caused by infrastructure or flakiness rather than genuine defects), and environment provisioning time.
6. Technical Debt Trend (weight 10). Not absolute debt, which is unmeasurable and unhelpful, but direction: trend in cost per comparable feature; percentage of engineering capacity consumed by unplanned work; count of modules under active change-freeze or informal avoidance.
7. Knowledge Distribution Index (weight 10). Bus factor per critical service; percentage of services with two or more contributors able to deploy safely; distribution of context between client and partner personnel. The metric most directly predictive of transition cost.
8. Engineering Predictability (weight 8). Ratio of committed to delivered scope over a rolling four-quarter window, and estimate variance segmented by documented versus undocumented areas. The segmentation is the informative part.
9. Vendor Integration Score (weight 8). How well partners are integrated into the engineering system rather than operating adjacent to it. Inputs: are partners subject to identical gates and standards; is escalation response within SLA; are partner-raised architectural risks logged and dispositioned; is documentation delivered as a contractual artifact; is there a named client counterpart per domain. Note that this measures the client's integration capability as much as the vendor's cooperation.
10. Quality Origin Balance (weight 8). Distribution of escaped defects by origin class (Chapter 4). A healthy system shows most defects originating in implementation, because upstream controls are working. A specification- or design-dominated distribution indicates an Intent or Structure problem being paid for downstream.
12.3 Composition and use
Each index is scored 0–100 against defined thresholds and combined by weight into a single EHS out of 100.
| Band | Range | Interpretation | Implication for vendor decisions |
|---|---|---|---|
| Critical | 0–39 | System is the dominant constraint | Replacement will produce a temporary honeymoon only |
| Fragile | 40–59 | Multiple binding constraints | Address system first; assess supply in parallel |
| Functional | 60–74 | System supports delivery; specific weaknesses | Vendor differences become genuinely observable |
| Strong | 75–89 | High coefficient | Supplier capability is now the leading variable |
| Adaptive | 90+ | Self-improving system | Partner selection is a genuine performance lever |
The band interpretation is the practical payload of the entire measurement exercise. Below 60, supplier quality is largely unobservable, because the system compresses all suppliers toward the same output. Above 75, supplier selection matters a great deal, and investment in partner quality yields high returns.
12.4 Implementation guidance
- Measure quarterly, not continuously. These are structural properties; monthly measurement produces noise and gaming.
- Publish the components, not just the composite. The composite is for executive attention; the components drive action.
- Assign each index an owner. An unowned metric is a report, not a control.
- Never tie individual or team compensation to EHS. It is a system diagnostic; incentivizing it corrupts it.
- Baseline before any transition. An EHS measured before a vendor change is the only way to later distinguish system improvement from honeymoon effect.
Chapter 13 — Procurement vs Engineering
13.1 Two different purchases
Procurement and engineering frequently believe they are buying the same thing. They are not.
Procurement buys capacity: a defined number of qualified engineers, at a defined rate, for a defined period, against a defined scope. This is a legitimate, well-understood purchase with mature commercial instruments.
Engineering needs capability: the durable ability of the organization to conceive, build, operate, and evolve software. Capability is not purchasable, because it resides in architecture, ownership, standards, memory, and governance—assets the buyer holds.
The failure mode is substitution: an organization experiencing a capability deficit purchases capacity, because capacity has a price list and capability has a change programme. The capacity is delivered as promised. The deficit persists. The supplier is then held responsible for a gap the contract never covered.
13.2 Capacity and capability compared
| Dimension | Capacity | Capability |
|---|---|---|
| What is bought | Engineering hours and skills | Organizational ability |
| Time to acquire | Weeks | Quarters |
| Depreciation | Immediate on contract end | Persists |
| Owner | Supplier | Buyer |
| Measured by | Utilization, throughput, cost per FTE | Engineering Health Score, cost per feature over time |
| Effect of adding more | Linear, then negative (coordination cost) | Compounding |
| Contractual instrument | SOW, rate card, SLA | None — requires internal investment |
The row on adding more deserves attention. Capacity exhibits diminishing and eventually negative returns: beyond a threshold determined by architecture and ownership clarity, additional engineers increase coordination cost faster than they add throughput. Organizations that respond to a system constraint by increasing headcount reliably discover this.
13.3 Total Cost of Engineering Ownership
Procurement decisions optimized on blended rate systematically under-price the variables that dominate total cost. A more complete model—Total Cost of Engineering Ownership (TCEO)—includes:
TCEO = Direct cost (rate × capacity × duration)
     + Onboarding and ramp cost
     + Coordination overhead (a function of architecture and ownership)
     + Rework cost (a function of requirement quality)
     + Knowledge retention investment (documentation, client-side counterparts)
     + Transition risk provision (expected cost of the next handover)
     + Debt accrual or remediation delta over the contract period
Two suppliers with a 20% rate difference frequently differ by far more in the last four terms. A partner who documents thoroughly, escalates architectural risk early, and leaves the system in a more maintainable state than they found it may cost more per hour and substantially less per outcome.
The practical recommendation: evaluate the last four terms explicitly in the selection process, and write them into the statement of work as deliverables. Documentation obligations, ADR requirements, knowledge transfer milestones, and standards compliance are contractable. If they are not in the contract, they are optional, and under commercial pressure optional work is the work that does not happen.
13.4 Aligning the commercial model
Certain commercial structures create predictable engineering outcomes:
| Model | Incentive created | Risk |
|---|---|---|
| Time and materials, headcount-based | Maximize billable capacity | Weak incentive for efficiency or automation |
| Fixed price per scope | Minimize cost within scope | Under-investment in quality and documentation; change-order friction |
| Outcome-based | Achieve defined result | Requires the buyer to define outcomes precisely; hard where Intent is weak |
| Capacity plus quality gates | Deliver within agreed standards | Requires client-owned, automated standards to be enforceable |
| Partnership with shared metrics | Improve the system jointly | Requires trust and maturity; highest ceiling |
No model is universally correct. But one observation is robust: commercial models that reward volume in an organization with a low system coefficient will produce volume, and volume in a weak system is technical debt. Aligning the model to system state is a procurement decision with deep engineering consequences.
Chapter 14 — Vendor Evaluation Framework
14.1 What conventional evaluation misses
Standard vendor selection assesses technical skill, references, rates, and cultural fit. These are necessary. They are also, in practice, weakly predictive, for three reasons.
First, references measure C × S at another client and attribute all of it to C. A partner who excelled in a high-maturity organization may struggle in a low-maturity one, and vice versa. Second, evaluation is conducted by the sales and pre-sales organization, which is not the delivery organization. Third, selection criteria rarely include the behaviors that determine long-run value: how the partner handles ambiguity, whether they escalate structural risk, and what state they leave the system in.
The scorecard below is designed to assess system fit and long-term value, not presentation quality. Each category carries a weight and, critically, an evidence test—something to observe rather than something to be told.
14.2 The Vendor Evaluation Scorecard
| # | Category | Weight | What it assesses | Evidence test |
|---|---|---|---|---|
| 1 | Technical capability | 20 | Depth in the required stack and domain; architectural reasoning | Present a real, messy problem from your system; assess the questions asked, not the answer given |
| 2 | Communication | 12 | Clarity, escalation behavior, written quality | Review actual artifacts: a past design note, an incident write-up, an estimate with assumptions stated |
| 3 | Quality engineering | 14 | Test strategy sophistication; defect prevention orientation | Ask how they distribute test investment and how they classify defect origin |
| 4 | Delivery discipline | 12 | Predictability, estimation practice, handling of change | Ask for an example where they missed a commitment and what changed afterward |
| 5 | Security and compliance | 10 | Practices, certifications, secure SDLC, data handling | Evidence of automated security gates in their own pipelines |
| 6 | Scalability of the relationship | 8 | Ability to staff, retain, and grow the team; attrition history | Named-team attrition data for comparable accounts |
| 7 | Knowledge transfer | 12 | Documentation as habit; behavior at exit | Ask what they left behind at the end of their last three engagements |
| 8 | Long-term value orientation | 12 | Willingness to raise uncomfortable structural issues | Ask what they would tell you about your system that you would not want to hear |
Scoring: each category rated 1–5 against defined descriptors, multiplied by weight, normalized to 100.
14.3 The two categories that predict the most
Categories 7 and 8 receive weight disproportionate to their prominence in typical evaluations, deliberately.
Knowledge transfer behavior is the most reliable available proxy for whether the engagement will end well and whether the next one will start well. A partner whose documentation practice is habitual rather than contractual reduces the buyer's transition risk permanently.
Long-term value orientation is assessed by a single question that produces remarkably discriminating answers: "Having reviewed our system, what would you tell us that we would rather not hear?" Partners who answer substantively—identifying architecture, ownership, or process constraints and proposing sequencing—are demonstrating exactly the behavior that raises the buyer's system coefficient. Partners who answer only with reassurance are optimizing for the sale.
This question also inverts the evaluation usefully: it tests whether the buyer can hear structural criticism, which is itself diagnostic.
14.4 Assessing system fit
Two additional considerations belong in any serious selection:
Maturity alignment. A partner accustomed to operating within mature platform environments may struggle in an organization at EHS 35, not through incapability but through mismatched expectations. Conversely, a partner experienced in remediation work may be over-specified for a high-maturity organization needing pure feature capacity. Ask directly which of these the partner is optimized for.
Governance compatibility. Will the partner accept client-owned standards, gates, and decision rights? Will they work inside the client's pipeline rather than their own? Will they participate in a shared architecture forum? A partner unwilling to be governed will, in a multi-vendor environment, fragment the system regardless of individual quality.
14.5 Structuring the engagement
Selection is only half the instrument. The statement of work should encode:
- Decision Spine allocation (which classes the partner decides, advises on, or executes).
- Documentation deliverables with acceptance criteria—ADRs for boundary decisions, runbooks for operated services, current system map entries.
- Standards compliance as a gate, enforced in the client's pipeline.
- Escalation obligations for structural risk, with a defined disposition process on the client side.
- Knowledge distribution requirements—minimum contributors per critical service, named client counterparts.
- Transition terms specified at contract signature, not at contract end.
Item 4 requires a client-side commitment that is frequently absent: escalated risks must be dispositioned, not merely received. A partner who raises an architectural constraint three times and sees no decision will stop raising it. The Vendor B outcome in Chapter 11 is the standard result.
"The best question in vendor selection is not what they can do for you. It is what they will tell you about yourself."
Chapter 15 — Common Mistakes
Twenty-four recurring errors, grouped by the layer in which they originate. Each is stated with its consequence.
Diagnosis and decision-making
1. Replacing a vendor before classifying root causes. The transition cost is incurred; the constraint remains. Remedy: Root Cause Matrix and the two-question triage (Ch. 4).
2. Interpreting the honeymoon as capability. Phase 2 improvement is measured and declared structural. Remedy: evaluate at months 7–12, not 0–3.
3. Attributing all delivery symptoms to the most adjustable variable. The supplier is measurable and contractually changeable, so it absorbs attribution for upstream causes.
4. Never asking whether the symptom predates the current vendor. A symptom that survived a transition is a system property by definition.
5. Failing to baseline before a transition. Without a pre-transition EHS, post-transition improvement cannot be distinguished from honeymoon effect.
6. Treating one bad project as evidence of a bad partner. Single-project failure has many causes; pattern analysis across engagements is the appropriate evidence standard.
Intent
7. Allowing requirement churn to be treated as normal. Above roughly 20% material change after sprint start, the delivery team is being measured on an unstable target.
8. Omitting non-functional requirements. Performance, security, availability, and compliance requirements discovered late are architecture changes, not bugs.
9. Roadmap volatility without architectural acknowledgment. Strategy that changes faster than the architecture can absorb produces debt that is then attributed to engineering quality.
10. Escalating without a decision owner. Escalation to an unowned decision produces meetings, not resolution.
Structure
11. No named architecture ownership. Architecture becomes the emergent sum of local decisions, and coherence degrades continuously.
12. Delegating D1/D2 decisions to a supplier. Not a criticism of the supplier — a structural risk, because architecture outlives the contract.
13. Under-delegating D4/D5 decisions. Client approval of implementation details creates queueing delay that is subsequently reported as vendor slowness.
14. Leaving services unowned. Unowned work waits for consensus; the wait appears in cycle time.
15. Adding headcount to a coupling problem. Beyond the threshold set by architecture, additional engineers increase coordination cost faster than throughput.
Flow
16. Delegating quality engineering rather than testing execution. The supplier is held accountable for an outcome whose upstream inputs the client owns.
17. Measuring test count instead of defect origin. Detection improves marginally; creation is untouched; cost rises.
18. Tolerating a delivery pipeline that no supplier can outrun. When a one-line change takes a week, the ceiling is structural.
19. Building an inverted test pyramid. Heavy UI automation is easy to scope and bill, brittle to maintain, and slow to give feedback.
20. Treating rollback as optional. Without fast reversal, the organization must attempt to prevent all failure, so it slows down instead.
Memory and governance
21. Scheduling knowledge transfer at the end of the relationship. Minimum motivation, maximum time pressure, guaranteed loss.
22. Documentation that is written but not verifiable. T3 documentation produces confident errors and is often worse than none.
23. Receiving vendor-raised structural risk without dispositioning it. The partner stops raising it; the organization loses its early warning system.
24. Governing suppliers differently from each other. Divergent standards fragment the architecture along commercial lines and make every transition structural.
Chapter 16 — Engineering Maturity Model
16.1 The five levels
Maturity here describes the system, not the people. High-quality engineers exist at every level; what differs is how much of their capability the system converts into delivered value.
Level 1 — Reactive Delivery. Work is driven by escalation. Requirements arrive informally. Architecture is emergent. Releases are events. Documentation is tacit. Quality is a phase performed at the end. Vendor experience: any supplier regresses to the same output within two quarters; replacement produces honeymoons. Typical EHS: below 40.
Level 2 — Vendor-Led Delivery. The organization has outsourced not only execution but structure: the supplier defines architecture, process, and standards. Delivery may be genuinely good. The exposure is discontinuity—every transition is an architectural reset, and the client cannot evaluate what it inherited. Vendor experience: high dependency; transition risk is severe. Typical EHS: 35–55, with high variance.
Level 3 — Process-Driven Engineering. Standards, CI/CD, code review, and sprint discipline are established and applied. Delivery is more predictable. The remaining gap is decision architecture: ownership is partial, structural decisions are still slow or unowned, and documentation is written but not verified. Vendor experience: supplier differences become partially observable. Typical EHS: 55–70.
Level 4 — Governed Engineering Organization. Decision rights are explicit; gates are automated; architecture has named ownership and a review forum; documentation is executable; quality is preventive; delivery is continuous. Suppliers operate inside a client-owned system on identical terms. Vendor experience: transitions are operational, not structural; supplier quality is a genuine performance lever. Typical EHS: 70–85.
Level 5 — Adaptive Engineering System. The organization measures its own system state, detects constraints before they surface as delivery failures, and reallocates investment accordingly. Governance is lightweight because decisions are fast and evidence-based. Partners contribute to system improvement, not only to output. Vendor experience: long-term strategic partnerships; selection focuses on system fit and shared improvement capacity. Typical EHS: 85+.
L1 Reactive → L2 Vendor-Led → L3 Process-Driven → L4 Governed → L5 Adaptive
   ▲                                                                  │
   └──── organizations skipping governance regress toward L1/L2 ──────┘
An important dynamic: Level 2 is not a step toward Level 3. It is a parallel branch. Organizations that scale delivery through supplier-led structure can reach substantial output without building internal capability, and the transition from L2 to L4 is harder than from L1 to L3 because it requires reclaiming decision rights that have been comfortably delegated for years.
16.2 Domain maturity ladders
Overall maturity is the minimum, not the average, of five domains. An organization at L4 in delivery and L1 in documentation behaves as an L2 organization at every transition.
| Level | Governance | Documentation | Vendor Management | Quality Engineering | Organizational Engineering |
|---|---|---|---|---|---|
| 1 | Ad hoc; decisions by escalation | Tacit (KCM T1) | Transactional; rate-driven | Detection; manual, end-phase | Roles undefined; heroics |
| 2 | Informal norms; unclear rights | Tribal (T2) | Managed by contract only | Regression automated | Teams exist; ownership unclear |
| 3 | Written standards; manual review | Written but drifting (T3) | SLA-managed; scorecards | Gates in CI; contract tests | Named teams; partial ownership |
| 4 | Decision Spine + automated gates | Executable (T4) | Integrated into one system | Preventive; origin-tracked | Domain ownership; clear interfaces |
| 5 | Evidence-based, self-adjusting | Enforced (T5) | Strategic partnership | Adaptive; error-budget-driven | Team topology matched to architecture |
16.3 Using the model
The model has one operational use: locate the lowest domain and address it before optimizing others. This follows directly from the binding-constraint rule in Chapter 2. Organizations commonly invest in the domain where they are already strongest, because that is where competence and enthusiasm reside, and observe no delivery improvement.
Chapter 17 — Engineering Transformation Roadmap
The roadmap below assumes an organization at Level 1–2 with an EHS below 55. Higher-maturity organizations should enter at the appropriate phase. The sequencing matters: each phase produces the evidence and capability the next one requires.
Phase 0 — Diagnose (Weeks 1–6)
Objective: replace opinion with measurement before any structural or commercial decision.
- Run the one-line-change test and record the result.
- Classify one quarter of escaped defects by origin.
- Measure requirement churn after sprint start.
- Audit ownership: services, datasets, critical interfaces.
- Measure time to first production change for the last three joiners.
- Baseline the Engineering Health Score.
- Run the two-question triage on the three loudest current symptoms.
Exit criterion: a written statement of the binding constraint, its locus, and its owner. No vendor decision is made before this exists.
Phase 1 — Stabilize (Months 1–3)
Objective: stop the bleeding and create the conditions for change.
- Assign a named owner to every production service, dataset, and critical interface.
- Establish a definition of ready gated at the Intent Gate.
- Establish a blameless incident process with tracked actions.
- Name a decision owner per domain with a published response SLA.
- Create the risk register, including knowledge-concentration risk.
Exit criterion: ownership clarity above 90%; median decision latency measured and falling.
Phase 2 — Instrument (Months 3–6)
Objective: make the system observable and reversible.
- Automate deployment; eliminate manual production steps.
- Implement and test rollback for all critical services.
- Move to infrastructure-as-code and ephemeral environments.
- Instrument SLOs for the top five user journeys.
- Enforce the Change Gate in CI: tests, security scanning, dependency checks.
- Begin continuous defect-origin classification.
Exit criterion: one-line-change time under one day; rollback tested in the last 30 days.
Phase 3 — Govern (Months 6–12)
Objective: make good decisions repeatable and supplier-neutral.
- Publish the Decision Spine allocation for every engagement.
- Establish the architecture forum with ADR output.
- Convert written standards to automated standards in the pipeline.
- Apply identical gates and standards to all contributors.
- Introduce documentation obligations into statements of work.
- Establish the escalation disposition process for partner-raised risk.
Exit criterion: every D2/D3 decision in the last quarter has an ADR; standards enforced identically across all suppliers.
Phase 4 — Decouple (Months 9–18, overlapping)
Objective: reduce the structural cost of change.
- Identify coupling hotspots from co-change analysis.
- Introduce versioned contracts and contract tests at the two highest-traffic boundaries.
- Split data ownership for the highest-coupling domain.
- Add characterization tests to legacy modules under change-freeze before touching them.
- Retire one system or integration for each significant addition.
Exit criterion: features requiring changes in three or more deployment units reduced by half.
Phase 5 — Adapt (Months 15+)
Objective: make the system self-correcting.
- Report the EHS quarterly with component-level owners.
- Introduce error-budget-based release pacing.
- Run quarterly system reviews examining whether prior decisions produced expected outcomes.
- Extend governance to AI-assisted delivery (Chapter 10, levels A2–A4).
- Re-evaluate supplier strategy — now that supplier differences are observable.
Exit criterion: constraints identified from leading indicators rather than from delivery failure.
Sequencing principles
- Diagnose before deciding. Phase 0 is short and non-negotiable.
- Ownership before automation. Automating an unowned process encodes ambiguity.
- Reversibility before speed. Rollback capability is what makes frequent deployment safe rather than reckless.
- Governance before decoupling. Architectural change without decision rights produces divergence.
- Deliver features throughout. A transformation that stops the roadmap will be cancelled in month four. Target 15–25% of capacity, sustained, rather than a dedicated programme that competes with delivery.
- Let the partner execute. Most of this work is delegable under the Decision Spine. The client owns the decisions; the supplier can own much of the implementation.
Chapter 18 — Executive Checklist
Forty questions to answer before authorizing a vendor replacement. The instruction is deliberately strict: if more than twelve answers are unknown, the organization does not yet have grounds to conclude the constraint is in supply.
Diagnosis (1–8)
- Did this symptom exist under the previous supplier?
- Would our best internal engineers eliminate this symptom in this system?
- What is our defect distribution by origin class?
- What percentage of escaped defects originate in implementation?
- What is our requirement churn rate after sprint start?
- What is the elapsed time for a one-line change to reach production?
- What is our current Engineering Health Score, and when was it last measured?
- Have we written down the binding constraint, its locus, and its owner?
Intent (9–14) 9. Are acceptance criteria agreed by product, engineering, and QA before development? 10. Are non-functional requirements specified before design? 11. How often does the roadmap change materially within a quarter? 12. Who decides scope trade-offs when estimates exceed capacity? 13. Is there a definition of ready, and is it enforced? 14. Is our strategy stable enough to architect against?
Structure (15–21) 15. Who is accountable for architectural coherence, and can they say no? 16. What percentage of production services have a named owner? 17. How many services share a data store? 18. What percentage of features require changes in three or more deployment units? 19. Which structural decisions have we delegated to a supplier? 20. Is there an architecture review forum, and does it produce written decisions? 21. What is our trend in cost per comparable feature over eight quarters?
Flow (22–29) 22. Can we roll back a production change in under fifteen minutes, and when did we last test it? 23. What percentage of releases require manual verification? 24. Are quality gates automated in the pipeline or enforced by people? 25. Do we have SLOs on our critical user journeys? 26. How long does it take to provision a new environment? 27. What proportion of build failures are caused by flakiness rather than defects? 28. What is our change failure rate, and our time to restore? 29. What percentage of engineering capacity goes to unplanned work?
Memory (30–35) 30. What percentage of critical services have a validated runbook? 31. Do we record ADRs for boundary decisions, and are they current? 32. What is our bus factor for each critical service? 33. How long does a new engineer take to make their first production change? 34. Do we have a client-side technical counterpart for every critical domain? 35. What would we lose, specifically, if the current team left in thirty days?
Supply and governance (36–40) 36. Have we written down which decision classes the supplier owns, advises on, and executes? 37. Are all suppliers subject to identical standards, gates, and definition of done? 38. What structural risks has the supplier raised, and how did we disposition them? 39. Are documentation and knowledge transfer contractual deliverables with acceptance criteria? 40. If we replace the supplier, which of questions 9–35 will have a different answer in twelve months?
Question 40 is the one that matters. If the honest answer is none, the replacement will produce the Replacement Reset Curve. If the answer identifies specific, supply-caused items, the replacement is justified and should proceed with conviction.
Chapter 19 — Future of Engineering Partnerships
19.1 From capacity to system contribution
The trajectory of engineering partnerships is toward relationships evaluated on their contribution to the buyer's system rather than on the volume of their output. Three forces drive this.
AI compresses the value of raw capacity. When generation is inexpensive, the differentiating contribution shifts to judgment, verification, architecture, and domain understanding. Partnerships priced and measured on headcount are being repriced on outcomes.
Platform engineering changes the unit of collaboration. Organizations that invest in paved paths, self-service infrastructure, golden templates, and shared observability create an environment where partners plug into a defined system rather than assembling one. This raises the system coefficient uniformly and reduces onboarding cost for every future engagement. It is the clearest structural answer to the problem this paper describes.
Transition cost is becoming visible. As organizations begin measuring knowledge distribution and time-to-first-production-change, the true cost of rotation appears in the numbers. Longer, deeper relationships become commercially rational once their alternative is properly priced.
19.2 What long-term partnership requires
Durable partnerships are not simply extended contracts. They require specific conditions on both sides.
From the buyer: retained D1/D2 decision rights, a named counterpart per domain, dispositioning of escalated risk, funding for system improvement rather than only for features, and a commercial model that does not reward volume.
From the partner: documentation as habit rather than obligation, willingness to be governed by client-owned standards, escalation of structural risk even when uncomfortable, investment in client-side knowledge distribution, and honest assessment of when the buyer's constraint is not something the partner can solve.
The last item is the mark of a mature supplier. A partner who says "more of our engineers will not fix this; your release process is the ceiling" is protecting the relationship's long-term value at the cost of short-term revenue. That behavior is rare, and it is worth paying for.
19.3 Emerging models
| Model | Description | Best fit |
|---|---|---|
| Embedded capability partner | Partner engineers integrated into client teams under client governance | Organizations at L3+ needing scale with coherence |
| Platform co-development | Partner builds and operates internal platform capability, client owns direction | Organizations raising system coefficient deliberately |
| Outcome-aligned delivery | Commercial terms tied to defined product or reliability outcomes | Organizations with strong Intent layer |
| Remediation engagement | Time-boxed engagement to raise specific EHS components | L1–L2 organizations preparing for scale |
| Multi-partner federation | Several partners under one supplier-neutral governance model | Large enterprises with domain-aligned teams |
19.4 The strategic reframe
The most consequential change is in the question leadership asks. The historical question was "who can build this for us most efficiently?" The more useful question is "what does our engineering system need to be, and who can help us get there while we deliver?"
Under the first question, suppliers are interchangeable units of capacity, and replacement is the natural response to dissatisfaction. Under the second, suppliers are participants in a system the buyer owns—and the buyer's job is to make that system one in which good partners can do good work.
Chapter 20 — Final Thoughts
The argument of this paper can be compressed into three sentences.
Changing vendors changes execution. When the constraint is genuinely in supply—expertise, seniority, communication, capacity, security posture, commercial alignment—replacement is the correct and often urgent decision, and this paper has tried to make that case as clearly as the opposite one.
Changing engineering systems changes outcomes. Architecture, requirement quality, decision rights, delivery mechanics, quality controls, and organizational memory are properties of the buying organization. They persist across contracts, they multiply or divide whatever capability a supplier brings, and they are the reason that three suppliers can produce the same result in the same system.
The strongest engineering organizations improve both. They select partners carefully, using evidence rather than presentation. They also build systems in which a competent partner can produce excellent work and an excellent partner can produce exceptional work. Neither investment substitutes for the other.
What follows practically is a change in sequence rather than a change in conviction. Before authorizing a transition, measure. Classify the defects by origin. Time a one-line change. Audit ownership. Ask whether the symptom predates the current supplier, and whether the best engineers in the company would escape it. These measurements take weeks and cost almost nothing relative to a rotation.
Sometimes the measurements will confirm that the supplier is the constraint. That is a real and common finding, and when it is true, decisive action is warranted—along with the recognition that the same diagnostic discipline should shape the selection of the replacement.
More often, the measurements will show something less comfortable and more valuable: that the ceiling on delivery is structural, that it applies equally to every team the organization has employed and every team it will employ, and that it is entirely within the organization's power to raise.
That is the better finding, because it points at a lever that compounds. A vendor change buys a honeymoon. A system change buys a higher ceiling for every supplier, every internal team, and every engineer who joins after the decision is made.
"The strongest software organizations optimize systems—not just suppliers."



