
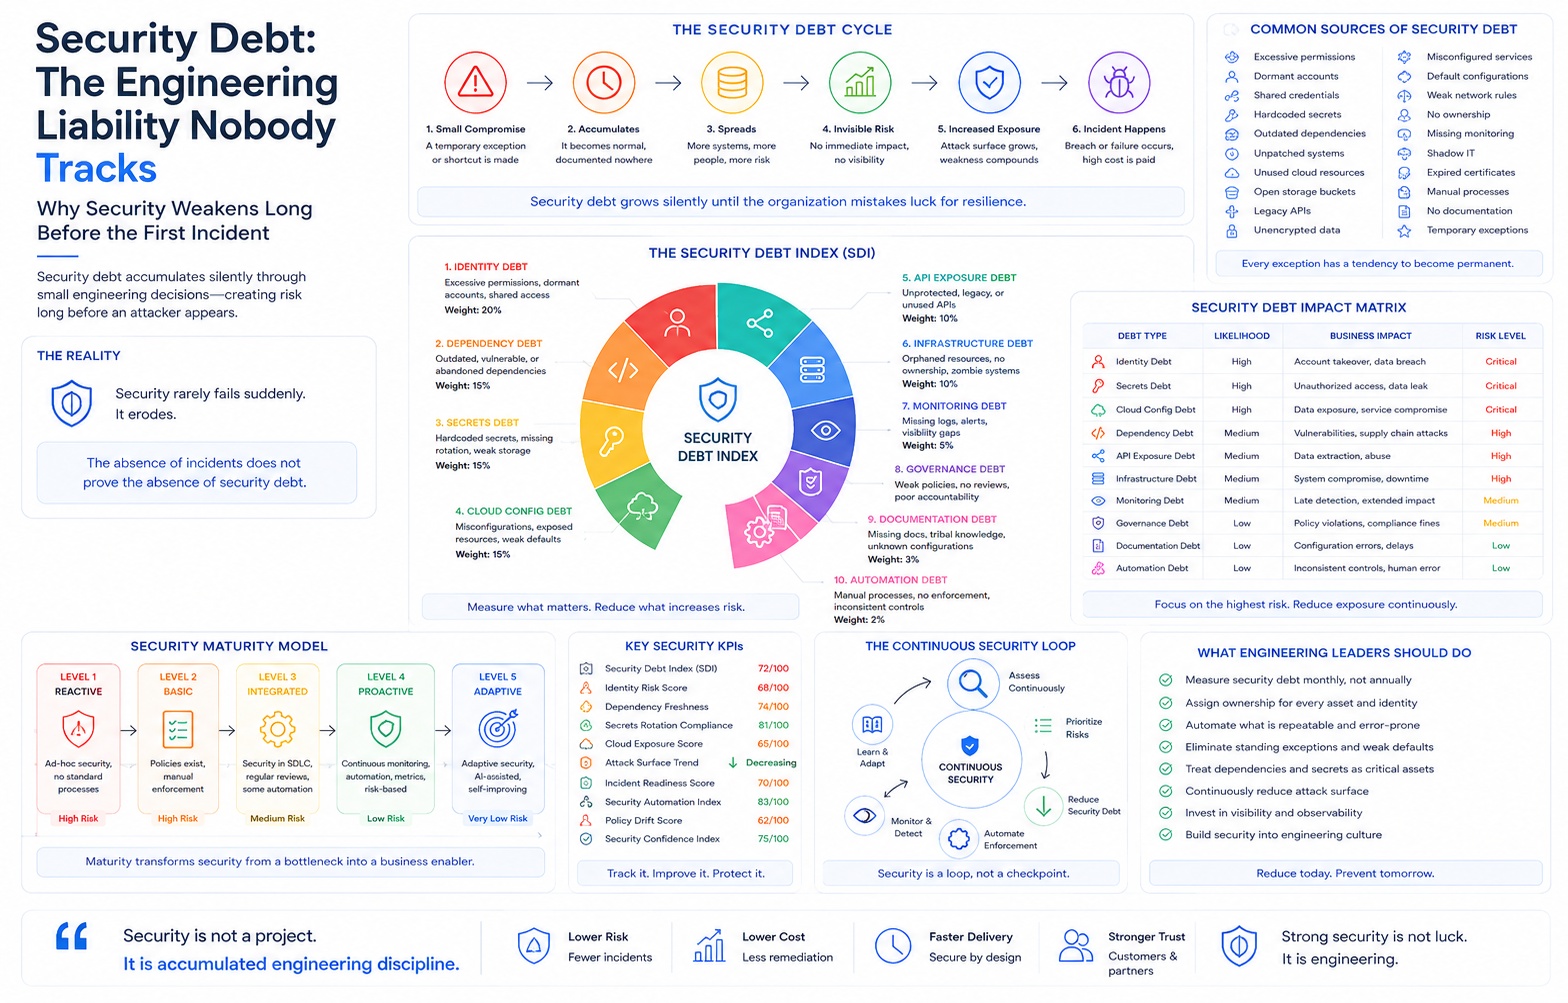
Every engineering organization maintains a balance sheet it never prints.
On one side sit the assets: services that ship, platforms that scale, teams that deliver. On the other sit the liabilities — not the ones finance tracks, but the ones engineering creates. A permission granted during an incident and never revoked. A dependency pinned three major versions back because upgrading broke a test nobody understood. A staging cluster that quietly became production-adjacent. A service account whose owner left the company eighteen months ago.
Individually, none of these is a vulnerability in the conventional sense. No scanner flags them. No penetration test reports them. No compliance auditor fails the organization for them. Collectively, they are the single most reliable predictor of how badly the next incident will go.
This is Security Debt: the accumulated security liability created by engineering decisions that increase future operational or business risk.
The analogy to financial debt is not decorative — it is structurally precise. Debt is taken on deliberately, usually for good reasons (velocity, deadlines, incident recovery). It carries interest, and that interest compounds. It can be serviced, refinanced, or defaulted on. And critically: an organization can be profitable and solvent right up until the moment it isn't, because debt does not announce itself. It simply constrains the options available when conditions change.
Security debt behaves the same way. The organization looks secure. Audits pass. Scanners are green. No incidents have occurred. And then a single credential leak becomes a full lateral movement event — not because the attacker was sophisticated, but because eleven years of accumulated permissions meant that one credential was equivalent to fifty.
Security debt grows silently until the organization mistakes luck for resilience.
The central argument of this paper is that security has been systematically mis-measured. It is treated as a state to be verified periodically — a pass/fail audit, a quarterly test, an annual certification — when it is in fact a rate: the balance between the speed at which an organization creates security liabilities and the speed at which it retires them.
A quarterly audit measures posture at a point in time. It tells you nothing about trajectory. Two organizations can produce identical audit results while one is systematically improving and the other is systematically decaying — and the audit is structurally incapable of distinguishing them. This is not a criticism of auditing. It is a category error in what auditing is for.
What follows is an engineering treatment of that problem. This paper introduces:
- The Security Debt Index (SDI) — a weighted, ten-component model for quantifying accumulated security liability as a single tracked number with visible sub-components.
- Component frameworks for the largest debt categories: Identity Health Score, Dependency Freshness Model, Secrets Hygiene Framework, Cloud Exposure Model, API Surface Evolution, and the Infrastructure Ownership Matrix.
- AI Security Debt — a new and rapidly compounding category created by agentic systems, retrieval pipelines, and non-human identities that current models do not account for.
- Ten measurable KPIs with formulas, target thresholds, and measurement cadence.
- An economic model for comparing preventive engineering against reactive incident response, including the debt remediation cost curve.
- A five-level Security Maturity Model, a governance framework, and a staged 24-month reduction roadmap.
The intended outcome is narrow and specific. Readers should finish this paper able to answer a question their organization almost certainly cannot answer today: is our security debt increasing or decreasing this quarter, and by how much?
Not whether the last test passed. Whether the balance is moving in the right direction.
Chapter 1 — Security Doesn't Break Overnight
The incident narrative is misleading by construction.
Post-incident reports begin at the moment of compromise because that is the moment that is legible — there is a timestamp, an entry point, an alert that fired or didn't. The story reads as a discrete event: the system was secure, then an attacker arrived, then the system was not secure.
The engineering reality is almost never a step function. It is a decay curve, and the compromise is simply the point at which the curve crosses a threshold that someone finally notices.
Consider the most common shape this takes in practice — a chain that unfolds across three to five years, in which every individual step is defensible:
   A temporary exception is granted during an incident
                    │
                    ▼
   The exception outlives the incident (no expiry set)
                    │
                    ▼
   The account holding it becomes dormant (owner changes team)
                    │
                    ▼
   The permission set is cloned into a role template
                    │
                    ▼
   The role is attached to a service running an unpatched dependency
                    │
                    ▼
   The service is deployed into a subnet whose firewall rule drifted
                    │
                    ▼
   The path becomes reachable, unmonitored, and unowned
                    │
                    ▼
                 Incident
No step in that chain is negligence. Each was a reasonable local decision made under real constraints. The failure is not in any decision — it is in the absence of a mechanism that observes the accumulation.
This produces three properties that make security debt structurally different from most engineering problems:
1. Accrual is silent, discovery is sudden. Technical debt announces itself continuously: builds slow down, changes take longer, engineers complain. Security debt produces no operational friction at all. A system carrying enormous security debt performs identically to one carrying none — until it doesn't. There is no daily signal, which means there is no natural feedback loop, which means it accumulates faster than any other debt class.
2. The interest is paid in a lump sum. Technical debt is serviced continuously in small increments of lost velocity. Security debt is serviced all at once, at a time chosen by someone else, in a currency the organization does not control.
3. Absence of evidence is systematically misread as evidence of absence. Three years without an incident is interpreted as three years of effective security. It is equally consistent with three years of undetected exposure and favorable odds.
The absence of incidents does not prove the absence of security debt.
The practical consequence is a measurement gap. Organizations instrument what generates friction — latency, error rates, build times, deployment frequency — because friction is self-reporting. Security debt generates no friction. It must therefore be deliberately instrumented, or it will not be observed at all.
The rest of this paper is concerned with what that instrumentation looks like.
Chapter 2 — Defining Security Debt
A definition worth adopting must be operational: it must tell an engineer what to count.
Security Debt is the accumulated security liability created by engineering decisions that increase future operational or business risk, where that liability is not currently exploited, not currently tracked as a defect, and not currently owned by a named party.
Three qualifiers do the work.
"Not currently exploited" distinguishes debt from an incident. Debt is a latent condition — it is the gap between the security posture the architecture assumes and the security posture actually deployed.
"Not currently tracked as a defect" distinguishes debt from a vulnerability. A CVE in your dependency graph is a vulnerability: it has an identifier, a severity, and a workflow. The fact that your dependency graph contains 340 packages whose median age is 4.1 years is debt. Vulnerability management is a queue; debt management is a balance.
"Not currently owned" is the compounding factor. An unowned liability has no natural remediation path — it will not be retired by ordinary operational work, because no ordinary operational work touches it.
Distinguishing Security Debt from adjacent debt classes
The categories overlap in practice, but they behave differently and require different instrumentation. Conflating them is the most common reason security debt programs fail — the work gets filed into a backlog optimized for something else.
| Dimension | Technical Debt | Compliance Debt | Operational Debt | Infrastructure Debt | Security Debt |
|---|---|---|---|---|---|
| Primary symptom | Reduced change velocity | Audit findings | Toil, on-call load | Cost, scaling limits | None until exploited |
| Detection | Continuous, self-reporting | Periodic, external | Continuous, on-call pain | Continuous, billing | Requires deliberate instrumentation |
| Interest form | Slower delivery | Fines, sales blockers | Headcount, burnout | Cloud spend | Blast radius amplification |
| Payment timing | Incremental, continuous | Scheduled (audit dates) | Incremental | Incremental | Lump sum, adversary-scheduled |
| Who notices first | Engineers | Auditors / GRC | SRE / on-call | Finance | Attackers |
| Typical owner | Engineering manager | GRC / Legal | SRE | Platform | Frequently nobody |
| Correlates with | Code age, coupling | Control coverage | Alert volume | Resource sprawl | Entitlement + reachability |
The critical row is the last one in the detection column. Every other debt class has an organic discovery mechanism. Security debt has exactly one organic discovery mechanism, and it is the adversary.
The four properties of security debt
Silent accrual. Debt is created by ordinary, well-intentioned engineering work. The rate of creation is roughly proportional to development velocity — which means the organizations creating debt fastest are the ones performing best on every other engineering metric.
Non-linear interest. Two independent debts do not sum; they multiply. An over-privileged role is a moderate liability. An unmonitored network path is a moderate liability. An over-privileged role reachable through an unmonitored path is not twice as bad — it is a different class of event. Debt compounds through composition, and composition is invisible to any tool that assesses components in isolation.
Ownership decay. Debt outlives the people who created it. Median engineer tenure in most technology organizations runs between two and four years; the median lifetime of an IAM role, a DNS record, or a Terraform module comfortably exceeds that. Every reorganization silently converts owned liabilities into unowned ones.
Discovery asymmetry. The organization discovers its debt through audit — a sampling process constrained by scope, time, and access. An adversary discovers it through enumeration — an exhaustive process constrained only by patience. The adversary's map is more complete than yours, and it is more complete by design.
Every temporary security exception has a tendency to become permanent.
Chapter 3 — The Security Debt Index
If security debt is a balance, it needs a balance sheet. The Security Debt Index (SDI) is the instrument proposed here.
Design constraints
Before the model, the constraints it must satisfy — these are what make an index survive contact with an engineering organization rather than becoming a compliance artifact:
- Decomposable. A single number that cannot be decomposed into owned sub-numbers is a dashboard ornament. Every point of SDI must trace to a team.
- Computable from existing telemetry. If measurement requires a new data collection program, it will not happen. SDI is built from cloud APIs, IAM exports, SBOMs, secret managers, and CMDBs — sources that already exist.
- Directional over absolute. The exact value is less important than the first derivative. An SDI of 42 means little; an SDI that moved from 38 to 42 in one quarter means a great deal.
- Resistant to gaming. Every component is defined so that the cheapest way to improve the score is to actually reduce the liability.
The ten components
SDI is a weighted composite. Each component is scored 0–100, where 0 is no debt and 100 is maximum debt. Weights are expressed out of 100 and reflect observed contribution to incident blast radius rather than incident frequency — because debt determines severity, not probability.
| # | Component | Weight | What it measures | Primary data source |
|---|---|---|---|---|
| 1 | Identity Debt | 15 | Excess entitlement, dormancy, privilege accumulation | IAM / IdP exports, CloudTrail |
| 2 | Secrets Debt | 12 | Credential sprawl, rotation failure, unbounded lifetime | Vault, CI config, secret scanners |
| 3 | Cloud Configuration Debt | 12 | Exposure, drift, default-state resources | CSPM, cloud APIs, IaC state |
| 4 | Dependency Debt | 11 | Age, support status, transitive opacity | SBOM, package manifests |
| 5 | API Exposure Debt | 10 | Undocumented, unversioned, unauthenticated surface | Gateway logs, traffic mirrors |
| 6 | Infrastructure Debt | 10 | Unowned, undecommissioned, unreconciled assets | CMDB, cloud inventory, DNS |
| 7 | Monitoring Debt | 9 | Coverage gaps, alert decay, log retention gaps | SIEM coverage maps |
| 8 | Governance Debt | 8 | Exception backlog, review lapse, policy drift | Ticketing, policy engines |
| 9 | Automation Debt | 7 | Manual controls, human-gated enforcement | CI/CD config, runbooks |
| 10 | Documentation Debt | 6 | Missing architecture, undocumented data flows | Architecture repos, DFDs |
| Total | 100 |
The formula
The base index is a straightforward weighted mean:
SDI = Σ (wᵢ × dᵢ) / 100

where  wᵢ = component weight
       dᵢ = component debt score (0–100)
This alone is insufficient, because it treats debts as independent — and Chapter 2 established that they are not. Two corrections are required.
Composition amplification. Debt that is reachable is worth more than debt that is not. Define a composition factor C as the proportion of high-scoring debt items that sit on a path from an internet-facing entry point to a sensitive data store:
SDI_effective = SDI × (1 + C) where C ∈ [0, 1]An organization with SDI 40 and C = 0.15 carries an effective index of 46. An organization with the same raw SDI but C = 0.6 carries 64. Same debt, different architecture, materially different exposure. This single correction is what separates a debt index from a checklist score.
Debt velocity (the interest rate). The most actionable number in the model is not the level but the rate:
r = (D_created − D_retired) / D_total per quarterWhere D_created is newly introduced debt items and D_retired is remediated or decommissioned items. Positive r means the organization is accruing faster than it services. Sustained positive r guarantees eventual incident severity growth regardless of current SDI level.
This is the number to put in front of an executive. Level is a legacy question — much of it predates current leadership. Velocity is a this-quarter question, and it is entirely within current leadership's control.
Scoring bands
| SDI (effective) | Band | Interpretation | Typical characteristic |
|---|---|---|---|
| 0–20 | Managed | Debt is tracked, owned, and retired on schedule | Automated enforcement; exceptions expire |
| 21–40 | Controlled | Debt is visible; retirement lags creation modestly | Good tooling, uneven adoption |
| 41–60 | Accruing | Debt exceeds remediation capacity; blast radius growing | Common in post-growth SaaS |
| 61–80 | Compounding | Composition effects dominate; incidents will be severe | Multiple unowned critical paths |
| 81–100 | Structural | Remediation requires architectural change, not cleanup | Re-platforming is cheaper than repair |
The band that matters most is Accruing. It is where the majority of successful, fast-growing engineering organizations sit, and it is the band with the least self-awareness — because everything is working, revenue is growing, and no incident has occurred.
Worked example
A mid-size SaaS platform scores its components:
| Component | Weight | Score | Weighted |
|---|---|---|---|
| Identity Debt | 15 | 68 | 10.20 |
| Secrets Debt | 12 | 55 | 6.60 |
| Cloud Config Debt | 12 | 47 | 5.64 |
| Dependency Debt | 11 | 62 | 6.82 |
| API Exposure Debt | 10 | 71 | 7.10 |
| Infrastructure Debt | 10 | 58 | 5.80 |
| Monitoring Debt | 9 | 34 | 3.06 |
| Governance Debt | 8 | 44 | 3.52 |
| Automation Debt | 7 | 51 | 3.57 |
| Documentation Debt | 6 | 66 | 3.96 |
| SDI (raw) | 56.3 |
With C = 0.22 (22% of high-severity items sit on internet-to-data paths):
SDI_effective = 56.3 × 1.22 = 68.7 → CompoundingThe organization's own view of itself before this exercise: "clean audit, no incidents, strong security team." Both statements were true. Neither was informative.
Chapter 4 — Identity Debt
Identity is the highest-weighted component of SDI for a structural reason: identity is the only control plane that touches every other one. A misconfigured bucket is a bucket. An over-privileged role is a bucket, a database, a queue, a secret store, and a deployment pipeline.
The accumulation mechanism
Identity debt is not created by bad permission decisions. It is created by good permission decisions that are never reversed. The asymmetry is built into the workflow:
- Granting access has a requester, a business justification, a ticket, and an approver.
- Revoking access has none of these. Nobody files a ticket asking to have their access removed.
The result is a ratchet. Permissions only move in one direction, and the aggregate entitlement of an organization grows monotonically with headcount, tenure, and incident count.
Five distinct sub-populations drive this:
Privilege accumulation (the tenure ratchet). An engineer joins the payments team, moves to platform, then to data. At each transition they receive the new team's entitlements. The old ones are rarely removed, because removing them risks breaking something and nobody can prove they are unused. After six years the engineer holds the union of three teams' access.
Dormant identities. Accounts belonging to departed staff, completed contractors, or deprecated automation. Offboarding usually terminates the IdP account cleanly; it frequently misses cloud-native identities, database-local users, SSH keys, and third-party SaaS accounts provisioned outside SSO.
Orphaned service accounts. A non-human identity created for a specific job, with the creator as the only person who understood its scope. Non-human identities now outnumber human ones in most cloud estates by an order of magnitude, and they have no offboarding process at all — nobody resigns on their behalf.
Legacy administrators. Roles created in the organization's first eighteen months, when the team was small and granularity was overhead. These roles are usually load-bearing: something critical still uses them, nobody knows what, and so they persist.
Shared credentials. Break-glass accounts, vendor logins, and legacy systems without individual identity support. Their defining property is not weak authentication but non-attributable action — they convert an auditable event into an unauditable one.
The Identity Health Score (IHS)
IHS is a 0–100 score where higher is healthier. It inverts into the SDI Identity Debt component as d₁ = 100 − IHS.
| Factor | Weight | Metric | Healthy target |
|---|---|---|---|
| Entitlement precision | 25 | % of granted permissions actually invoked in 90 days | ≥ 70% |
| Dormancy control | 20 | % of identities with authentication in last 60 days | ≥ 95% |
| Privilege containment | 20 | % of identities with standing privileged access | ≤ 3% |
| Attribution integrity | 15 | % of privileged actions traceable to a human | ≥ 99% |
| Lifecycle binding | 12 | % of non-human identities with a named owner and expiry | ≥ 90% |
| Elevation discipline | 8 | % of privileged sessions that are time-bound (JIT) | ≥ 80% |
IHS = Σ (weightᵢ × min(actualᵢ / targetᵢ, 1) × 100) / 100Capping each factor at its target prevents over-performance in one dimension from masking failure in another — a common and dangerous property of naive composite scores.
Entitlement precision is the single most valuable metric here and the one most organizations do not compute, despite having the data. Every major cloud provider records which permissions an identity actually used. The ratio of used to granted is the cleanest available proxy for the gap between intended and actual blast radius. Organizations computing it for the first time routinely find values between 5% and 15%.
The entitlement half-life model
A useful mental model: treat every grant as having a half-life — the period after which the business need that justified it has a 50% chance of no longer existing.
| Grant type | Estimated half-life | Implied control |
|---|---|---|
| Incident break-glass | 4 hours | Auto-revoke on incident close |
| Project-scoped access | 90 days | Expiry at project milestone |
| Team-role membership | 18 months | Revalidate on org change |
| Service account scope | 12 months | Owner attestation + usage proof |
| Vendor / third-party | 6 months | Contract-bound expiry |
The engineering implication is that expiry should be the default construction of a permission, not an administrative afterthought. A grant without an expiry date is a grant with an infinite half-life, which is a claim no business justification can actually support.
Practical sequence
- Compute entitlement precision across the estate. Do not remediate yet — establish the baseline.
- Eliminate dormancy first. It is the lowest-risk, highest-volume reduction available and it requires no architectural change.
- Convert standing privileged access to just-in-time elevation for the top decile of privileged roles.
- Assign named owners to every non-human identity; delete any that cannot be claimed within 30 days.
- Only then attack entitlement precision on live roles, using observed-usage data to right-size rather than guessing.
The ordering matters. Right-sizing live permissions before establishing usage telemetry produces outages, and outages produce permanent organizational resistance to identity work.
Chapter 5 — Dependency Debt
The conventional metric for dependency risk is vulnerability count. It is the wrong primary metric, and the reason is worth stating precisely.
Vulnerability count measures known, disclosed, currently published problems. It is a lagging indicator of a leading condition. The leading condition is age.
Why age dominates
An old dependency is not merely a dependency with more known CVEs. It carries four compounding properties:
- Upgrade cost grows superlinearly with version distance. Upgrading across one major version is a task. Upgrading across four is a project — and projects require planning cycles, which means they don't happen during a zero-day.
- Remediation optionality collapses. When a critical vulnerability lands in a package you are two minor versions behind, you patch in an afternoon. Six major versions behind, your only options are backporting or an emergency migration, both under adversarial time pressure.
- Maintenance signal degrades. Old versions attract less scrutiny. The security researchers auditing the package are auditing
main, not the branch you froze in 2021. - Transitive opacity increases. Older packages tend to have older, looser dependency constraints, which widens the tree beneath them.
The operational conclusion: dependency age is a measure of your future response capability, and response capability is what determines whether a disclosure is a routine patch or an incident.
You do not choose when to patch. You only choose, in advance, how expensive patching will be.
The Dependency Freshness Model
Three metrics, computed from an SBOM:
Dependency Age Index (DAI) — the mean version-lag across direct dependencies, weighted by the criticality of the consuming service:
DAI = Σ (cⱼ × ageⱼ) / Σ cⱼ

where ageⱼ = time elapsed since the currently-installed version was superseded
      cⱼ  = service criticality weight (1–3)
Support Horizon Ratio (SHR) — the proportion of the dependency graph still within an active support window:
SHR = (packages receiving security fixes) / (total packages)SHR is more decision-relevant than any CVE count, because it measures whether a fix will exist at all when needed. A package outside its support window has an infinite mean-time-to-patch.
Transitive Depth Exposure (TDE) — the proportion of the graph reachable only through transitive links, weighted by depth. High TDE means the organization's effective supply chain is largely composed of packages it never chose, from maintainers it never evaluated.
Dependency risk levels
| Level | Condition | Age band | Response posture | Action |
|---|---|---|---|---|
| D0 — Current | Latest minor, active support | < 6 mo | Patch in hours | Automate |
| D1 — Trailing | 1 minor behind | 6–12 mo | Patch in days | Scheduled upgrade |
| D2 — Lagging | 1 major behind | 1–2 yr | Patch in weeks | Quarterly plan |
| D3 — Stranded | 2+ majors behind, supported | 2–4 yr | Patch in months | Funded migration |
| D4 — Unsupported | No upstream security fixes | Any | No patch exists | Replace or vendor |
| D5 — Abandoned | No maintainer activity ≥ 24 mo | Any | No patch, no owner | Fork, replace, or accept with compensating control |
D4 and D5 are qualitatively different from D0–D3 and must be tracked separately. D0–D3 are scheduling problems. D4 and D5 are architectural problems, and treating them as backlog items guarantees they are never addressed.
Supply chain trust as a separate axis
Freshness measures how current a package is. It does not measure whether it should be trusted at all. A minimal trust rubric, applied at introduction rather than at audit:
| Signal | Low risk | Elevated risk |
|---|---|---|
| Maintainer count | ≥ 3 active | 1, or anonymous |
| Release cadence | Regular, ≥ 24 mo history | Sporadic or dormant |
| Ownership stability | No recent transfer | Recently transferred |
| Build provenance | Signed, reproducible, attested | Unsigned artifact |
| Necessity | Non-trivial functionality | Wrapper around stdlib |
The last row is underrated. A meaningful share of supply chain exposure comes from micro-packages that provide near-zero functional value and are adopted purely by transitive inheritance. Removing them is one of the few security actions that also reduces build time.
Chapter 6 — Secrets Debt
Secrets debt is distinctive because it is the only debt category where a single item can be catastrophic in isolation. Identity debt requires composition to become severe. A leaked long-lived production credential does not.
The lifecycle framing
Most organizations think about secrets in terms of storage: are they in a vault or not? Storage is one of five lifecycle stages, and it is not the stage where most debt lives.
   CREATION ──▶ DISTRIBUTION ──▶ STORAGE ──▶ USAGE ──▶ RETIREMENT
       │             │              │           │           │
   scope too     copied into    vaulted but   no usage   never revoked
   broad at      CI logs,       cached in     telemetry  after rotation
   birth         tickets,       env vars                 (old value
                 laptops                                  still valid)
The two ends of this pipeline carry the most debt and receive the least attention.
Creation determines the ceiling on damage. A credential scoped to one bucket cannot become a lateral movement event no matter how badly it leaks. Scope decisions made in the first five minutes of a secret's life dominate every control applied afterwards.
Retirement is where the most common and most invisible failure occurs: rotation without revocation. A new secret is issued, applications are updated, the rotation is marked complete — and the previous value remains valid because revoking it risked breaking an unknown consumer. The organization reports 100% rotation compliance while maintaining a growing population of live, unmanaged, unmonitored credentials. This single pattern accounts for a large share of the gap between reported and actual secrets posture.
The Secrets Hygiene Framework
Five dimensions, each scored 0–100 (higher = healthier).
| Dimension | Question it answers | Key metric | Target |
|---|---|---|---|
| Containment | Do secrets exist outside managed storage? | % of secrets in a managed store (vs. env vars, config, code) | ≥ 98% |
| Scope | How much does one secret unlock? | Median resources accessible per credential | ≤ 3 |
| Lifetime | How long is a compromised secret useful? | Median credential TTL | ≤ 24 h (workload) |
| Rotation integrity | Is the old value actually dead? | % of rotations with verified revocation | 100% |
| Observability | Would anomalous use be detected? | % of secrets with per-use telemetry | ≥ 90% |
Secrets Hygiene Score = mean(Containment, Scope, Lifetime, Rotation, Observability)
d₂ (Secrets Debt) = 100 − Secrets Hygiene Score
Using an unweighted mean here is deliberate. Unlike identity, secrets failures are not additive — a perfect score on four dimensions and zero on one is a fully compromised position. The mean is a communication device; the operating rule is that any dimension below 60 is treated as the effective score.
The lifetime hierarchy
The most leveraged intervention in secrets management is not better storage. It is shorter lifetime — because lifetime determines the value of a leaked secret to an adversary, and it is the only property that degrades an adversary's position automatically, without detection.
| Approach | Effective lifetime | Compromise window | Operational cost |
|---|---|---|---|
| Static credential in config | Indefinite | Indefinite | Low (initially) |
| Vault-stored static credential | Until manual rotation | Months | Moderate |
| Vault-stored, scheduled rotation | Rotation interval | Weeks | Moderate |
| Short-lived token (OIDC / STS) | Minutes to hours | Hours | Moderate (setup-heavy) |
| Workload identity federation | Per-request | Near zero | High initially, low ongoing |
| Hardware-bound / attested identity | Per-request, non-exportable | None (non-exfiltrable) | High |
The progression down this table is the single highest-return investment in the secrets domain, and it is fundamentally a platform engineering project rather than a security project. Security teams cannot deliver it; they can only specify it.
Certificates as a special case
Certificates are secrets with a scheduled failure mode, which makes them uniquely useful as a debt indicator. An organization that experiences certificate expiry outages does not have a certificate problem — it has an inventory and ownership problem that happens to have surfaced through certificates. The certificate outage is a free diagnostic: it reveals exactly which assets are unowned and unmonitored, at low cost, on a predictable schedule.
Track two metrics: certificate inventory coverage (% of TLS endpoints in an inventory) and automated issuance ratio (% issued via automated protocol). Manual issuance is a reliable predictor of an eventual expiry event.
Chapter 7 — Cloud Configuration Debt
Cloud configuration debt is the most heavily tooled category and, paradoxically, one of the least reduced. Cloud security posture management platforms are widely deployed. Their findings are widely un-actioned. Understanding why is more useful than adding another scanner.
Why findings don't convert to fixes
Three structural reasons:
- Volume without prioritization. A CSPM against a mature estate produces thousands of findings. Without reachability context, severity ratings are generic, and generic severity cannot survive contact with a prioritized engineering backlog.
- Findings are addressed to the wrong artifact. The scanner reports on the deployed resource. The fix belongs in the IaC module. Remediating in the console produces a configuration that reverts on the next apply — and teaches engineers that remediation doesn't stick.
- No owner. A finding on a resource with no owning team enters a queue nobody drains.
The exposure path model
The useful reframing: a cloud misconfiguration is not a property of a resource. It is a property of a path.
   Exposure = Reachability × Privilege × Sensitivity

   Reachability : can an unauthenticated or low-privilege actor reach it?
   Privilege    : what does reaching it grant?
   Sensitivity  : what data or capability is behind it?
Any factor at zero makes the finding low-priority regardless of its CVSS-style rating. A publicly readable bucket containing generated static assets scores near zero on sensitivity. A private bucket containing customer PII, reachable via a role attached to an internet-facing compute instance, scores high on all three despite being "correctly configured" by every rule in the scanner.
This is why exposure path analysis outperforms rule-based scanning: it evaluates composition, and composition is where severity lives.
The four cloud debt populations
Drift. Deployed state diverges from declared state. The metric is IaC Reconciliation Rate: the percentage of production resources whose live configuration matches their declaration. Below roughly 85%, the IaC repository stops being a source of truth and becomes documentation — at which point every downstream control that assumes it is authoritative is silently unreliable.
Default-state resources. Resources deployed with provider defaults and never hardened. Defaults are chosen by the provider to optimize for successful first deployment, not for least privilege. Every default is a decision the organization delegated to a vendor.
Cloud sprawl. Resources that exist but serve nothing. Sprawl is dual-purpose debt: it is both a security liability and a cost liability, which makes it the easiest category to fund. Finance will pay for what security cannot justify alone.
Shadow infrastructure. Resources created outside the sanctioned pipeline — a personal account, an unmanaged subscription, a proof-of-concept that acquired production traffic. Shadow infrastructure is the highest-severity population because it is absent from every control plane simultaneously: no scanning, no logging, no patching, no inventory.
Cloud configuration strategies compared
| Strategy | Drift resistance | Time to remediate | Coverage | Failure mode |
|---|---|---|---|---|
| Manual console + periodic review | None | Weeks | Sampled | Reverts silently |
| CSPM detect-and-ticket | Low | Days–weeks | Broad | Backlog accumulation |
| IaC with drift detection | Moderate | Days | Declared resources only | Shadow resources invisible |
| Policy-as-code at admission | High | Prevented at source | Pipeline-deployed only | Bypass via console access |
| Immutable + auto-remediation | Very high | Minutes | Pipeline-deployed only | Requires mature platform |
| Deny-by-default account guardrails | Highest | N/A (prevented) | Account-wide | High initial friction |
The progression is not linear in cost. The step from detect-and-ticket to policy-as-code at admission is the largest single reduction in cloud configuration debt available, because it converts an unbounded backlog into a bounded exception list. A backlog grows without limit; an exception list has an owner and an expiry.
The exception discipline
Any organization enforcing policy at admission will need exceptions. The exception mechanism determines whether policy-as-code reduces debt or merely relocates it:
- Every exception has a named owner, not a team.
- Every exception has a mandatory expiry — maximum 90 days, no indefinite option in the schema.
- Every exception carries a compensating control.
- Exception count and median age are first-class dashboard metrics, reported alongside SDI.
An exception system without expiry is a policy system that has been disabled through paperwork.
Chapter 8 — API Exposure Debt
APIs are the only architectural artifact that is simultaneously a product surface, an integration contract, and an attack surface. This triple role is why API debt accumulates faster than any other category: the incentives to add are strong and continuous, while the incentives to remove are weak and episodic.
The API surface evolution model
APIs follow a predictable lifecycle. The debt is concentrated in the final two stages, which most organizations do not instrument.
  DESIGNED ──▶ PUBLISHED ──▶ INTEGRATED ──▶ SUPERSEDED ──▶ ORPHANED ──▶ FORGOTTEN
     │             │              │              │              │             │
  reviewed,    documented,    consumers      v2 ships,      last known    still routing,
  authz        gateway-       depend on it   v1 stays       consumer      no owner,
  specified    registered                    "for now"      gone          no docs
     └─────────── governed ────────────┘     └───────── debt ──────────────────┘
The transition from superseded to orphaned is where the security profile changes fundamentally. A superseded API is still maintained. An orphaned one receives no dependency updates, no authentication modernization, and no security review — but continues to serve traffic against live data with the authorization model of the year it was written.
The four populations
Zombie APIs. Deprecated, announced as removed, still routing. The gap between deprecation announcement and actual route removal is the debt window, and in most organizations it is measured in years because nobody can prove the last consumer is gone.
Shadow APIs. Endpoints in production that are absent from the API catalog: debug routes, internal admin interfaces, endpoints added directly to a service without gateway registration. These are undocumented by definition, which means they are unreviewed by definition.
Authorization-inconsistent APIs. Endpoints that authenticate correctly but authorize differently from their peers. This is the highest-value population and the hardest to detect with scanning, because every individual endpoint appears correct. The defect exists only in the comparison between endpoints — one route checks tenant scope, its sibling checks only session validity.
Third-party integration surfaces. Webhook receivers, OAuth callbacks, partner endpoints. Their defining property is that the security posture is jointly determined with an external party whose posture you cannot measure and whose changes you do not see.
Measuring API Exposure Debt
| Metric | Definition | Healthy target |
|---|---|---|
| Catalog coverage | Observed endpoints present in the API catalog | ≥ 98% |
| Authentication uniformity | Endpoints using the standard auth path | ≥ 99% |
| Authorization test coverage | Endpoints with automated cross-tenant authorization tests | ≥ 90% |
| Deprecation closure time | Median days from deprecation notice to route removal | ≤ 180 |
| Version concurrency | Simultaneously served major versions per service | ≤ 2 |
| Consumer attribution | Endpoints with an identified consumer in last 30 days | ≥ 95% |
Consumer attribution is the metric that unlocks removal. The reason zombie endpoints survive is epistemic: nobody can prove nothing is calling them. Per-endpoint, per-consumer traffic telemetry converts an unfalsifiable claim into a measurable one, and removal becomes routine rather than risky.
The practical technique is the staged dark period: rate-limit the endpoint to near-zero, then return errors for a defined window, then remove. Each stage is reversible; the sequence produces evidence rather than requiring courage.
Comparison of exposure control approaches
| Approach | Shadow API detection | Authorization consistency | Removal confidence |
|---|---|---|---|
| Documentation-driven catalog | None | Manual | Low |
| Gateway-enforced registration | High (bypass-dependent) | Centralized | Moderate |
| Traffic-derived inventory | High | Observational only | High |
| Contract testing in CI | None | Strong for tested paths | Moderate |
| Runtime authorization service | Moderate | Strongest | High |
Traffic-derived inventory combined with gateway enforcement is the pragmatic combination: the gateway constrains what should exist, traffic analysis reveals what does, and the delta between the two is a directly measurable debt figure.
Chapter 9 — Infrastructure That Nobody Owns
Every category discussed so far has an amplifier, and the amplifier is ownership. An owned liability is a scheduling problem. An unowned liability is a permanent one.
How ownership evaporates
Ownership is rarely revoked; it dissolves. Four mechanisms account for nearly all of it:
- Reorganization. Team boundaries redraw; assets are reassigned by team name, and assets belonging to dissolved teams are assigned to nobody.
- Attrition. The individual who understood the system leaves. Formal ownership may transfer; operational knowledge does not.
- Acquisition. Inherited estates arrive with inventories that are incomplete on day one and never reconciled.
- Success drift. A prototype acquires production traffic without ever acquiring production ownership. The most dangerous variant, because the asset is business-critical and unowned.
The Infrastructure Ownership Matrix
Assets sort into four quadrants along two axes: whether the organization knows the asset exists (inventory) and whether a named party is accountable for it (ownership).
                        OWNED                    UNOWNED
                ┌──────────────────────┬──────────────────────┐
                │   Q1  MANAGED        │   Q2  ABANDONED      │
     KNOWN      │                      │                      │
                │  In inventory,       │  In inventory,       │
                │  named owner,        │  no owner.           │
                │  patched, monitored  │  Patching stalled.   │
                │                      │                      │
                │  → Maintain          │  → Assign or         │
                │                      │    decommission      │
                ├──────────────────────┼──────────────────────┤
                │   Q3  INFORMAL       │   Q4  DARK           │
    UNKNOWN     │                      │                      │
                │  Someone maintains   │  Nobody knows it     │
                │  it; org has no      │  exists. Not         │
                │  record. Bus-factor  │  patched, logged,    │
                │  of one.             │  or scanned.         │
                │                      │                      │
                │  → Formalize         │  → Discover          │
                └──────────────────────┴──────────────────────┘
Q1 — Managed. The target state. The only quadrant where ordinary operational processes actually apply.
Q2 — Abandoned. Visible in the CMDB, no accountable party. These assets fail silently: they appear in every report and are acted on in none. Q2 is the largest quadrant in most mature organizations, and it is entirely addressable with existing data.
Q3 — Informal. Maintained by an individual through personal diligence rather than organizational process. Appears healthy until that person changes teams, at which point Q3 becomes Q4 instantly.
Q4 — Dark. Outside every control plane. Q4 cannot be managed, only discovered. External attack surface discovery, DNS reconciliation, cloud billing analysis, and certificate transparency logs are the four highest-yield discovery methods — and the last two are effectively free.
The key operating metric is Ownership Coverage: |Q1| / (|Q1| + |Q2| + |Q3|), tracked with an explicit acknowledgement that Q4 is unmeasurable and therefore that the true denominator is unknown.
Zombie infrastructure inventory
| Asset type | Typical dormancy signal | Discovery method | Decommission risk |
|---|---|---|---|
| Compute instances | No inbound traffic 30 d | Flow logs | Low–moderate |
| Kubernetes clusters | No deployments 90 d | Control plane audit | Moderate |
| DNS records | No resolution 60 d | Resolver telemetry | High (subdomain takeover) |
| Registered domains | No traffic, auto-renewing | Registrar + billing | Moderate |
| TLS certificates | Issued, unbound to a service | CT logs + endpoint scan | Low |
| Container images | Not pulled in 180 d | Registry telemetry | Low |
| Storage buckets | No access 180 d | Access logs | Moderate (data retention) |
| Databases | No connections 90 d | Connection telemetry | High (data loss) |
DNS deserves specific attention. A dangling DNS record pointing at a deallocated cloud resource is one of the few debt items that converts directly into an exploitable condition without any adversary sophistication — the resource can simply be re-registered by someone else. DNS reconciliation is the highest return-per-hour activity in the infrastructure debt category.
The decommissioning discipline
Decommissioning fails for a predictable reason: it is the only engineering activity with no upside on completion. Nobody is promoted for deleting a cluster. The fix is structural, not motivational:
- Creation-time expiry. Every non-production environment is provisioned with a TTL. Extension requires an owner action; the default is deletion.
- Quarterly ownership attestation. Owners confirm assets in a single batch action. Unclaimed assets enter a 30-day decommission queue with automatic notification.
- Staged teardown. Isolate network access → stop → snapshot → wait 30 days → delete. Reversible at every stage, which removes the fear that blocks the decision.
- Decommission as a tracked KPI. Report assets retired per quarter with the same visibility as features shipped.
Chapter 10 — AI Increases Security Debt
AI systems do not add a component to the existing model. They change the model's structure, because they introduce the first widely deployed architecture in which the control flow of a privileged process is determined by untrusted data at runtime.
That sentence is the entire security story, and everything below is a consequence of it.
Why existing frameworks under-measure it
Traditional security debt assumes a stable relationship between code and behavior. A service does what it was written to do; debt accumulates in the surrounding configuration. An LLM-based agent does what its context tells it to do, and its context is assembled at request time from sources of varying trust: user input, retrieved documents, tool outputs, prior conversation, and other agents' output.
This inverts a foundational assumption. In conventional architecture, data flows into code. In agentic architecture, data flows into the instruction stream. Controls designed for the former do not measure the latter.
The six components of AI Security Debt
1. Agent Identity Debt. Agents typically operate under a single service identity with the union of all permissions any workflow might require. This is privilege accumulation, but compressed from years into a sprint — and without the tenure history that makes conventional privilege accumulation at least auditable. The metric: entitlement precision per agent, computed exactly as in Chapter 4, and typically far worse.
2. Tool Permission Debt. Each tool granted to an agent extends its capability envelope. Tools are added incrementally and removed never. The critical measure is not tool count but tool composition: an agent with read access to a document store and write access to an external channel possesses an exfiltration primitive that neither tool implies alone. Tool grants must be evaluated as sets, not individually.
3. Context and Retrieval Debt. RAG pipelines create an indirect, persistent, and usually unaudited path from document ingestion to model instruction. Debt accumulates as: documents indexed without provenance; access control applied at query time but not at index time; and permission changes in the source system that never propagate to the vector store. The dominant failure is permission desynchronization — the index reflects entitlements as they were at ingestion, not as they are now.
4. Memory Debt. Persistent agent memory turns a transient injection into a durable one. A single successful manipulation written to memory affects all subsequent sessions. Memory requires the same lifecycle controls as any other data store — retention limits, provenance, and the ability to audit and expire entries — and almost never has them.
5. Model Version Debt. Behavior changes across model versions in ways that are not captured by test suites written for functional correctness. A guardrail validated against one version is not validated against its successor. Without behavioral regression testing on the safety path specifically, every model upgrade silently invalidates prior assurance.
6. Policy Drift Debt. The gap between what the organization's AI policy states and what deployed systems actually do. This grows fastest of all, because AI capability deployment currently outpaces AI governance in nearly every organization.
Extending SDI for AI
Rather than adding an eleventh component, apply an AI multiplier to the four components AI most directly inflates. This preserves the model's structure and keeps the AI contribution explicit and attributable.
| SDI component | AI inflation mechanism | Suggested multiplier |
|---|---|---|
| Identity Debt | Non-human agent identities with union permissions | × 1.3 |
| API Exposure Debt | Tool endpoints as a new machine-driven surface | × 1.2 |
| Monitoring Debt | Prompt/response/tool-call telemetry usually absent | × 1.4 |
| Governance Debt | Policy drift, unreviewed deployments | × 1.3 |
Multipliers apply only to the AI-attributable portion of each component, scaled by the share of the estate that is agentic.
Practical controls that reduce AI security debt
- Per-workflow agent identity. One agent, one purpose, one minimal permission set. Resist the general-purpose agent with universal credentials — it is a shared admin account with a natural language interface.
- Trust-tiered context. Tag every context element with its provenance and enforce that lower-trust content cannot trigger higher-privilege tool calls. This is the single most important architectural control in the domain.
- Human confirmation on irreversible actions. Distinguish read from write, and reversible from irreversible. Irreversible external actions require confirmation regardless of model confidence.
- Index-time and query-time authorization. Enforce access control at both ends of the retrieval pipeline, with a reconciliation job that detects desynchronization.
- Full interaction telemetry. Prompts, retrieved context, tool calls, and outputs, retained and queryable. Without this, AI incidents are not investigable — and an uninvestigable system cannot be improved.
An agent's permissions are its blast radius. Everything else is mitigation.
Chapter 11 — Measuring Security Health
A measurement program that produces numbers nobody acts on is itself a form of debt. The ten KPIs below are selected against three criteria: computable from existing telemetry, attributable to a named team, and responsive to engineering action within a quarter.
| # | KPI | Formula | Target | Cadence | Owner |
|---|---|---|---|---|---|
| 1 | Security Debt Index | Σ(wᵢdᵢ)/100 × (1+C) |
≤ 35 | Monthly | CISO / Platform |
| 2 | Identity Risk Score | 100 − IHS |
≤ 25 | Monthly | IAM |
| 3 | Dependency Freshness | % of graph at D0–D1 |
≥ 80% | Weekly | Eng teams |
| 4 | Secrets Rotation Compliance | verified-revoked rotations / due rotations |
100% | Monthly | Platform |
| 5 | Cloud Exposure Score | Σ(reach × priv × sens) / assets |
≤ 15 | Weekly | Cloud Platform |
| 6 | Infrastructure Ownership Coverage | Q1 / (Q1+Q2+Q3) |
≥ 95% | Quarterly | Platform / SRE |
| 7 | Attack Surface Trend | Δ(externally reachable endpoints) per quarter |
≤ growth in services | Monthly | Security Eng |
| 8 | Security Automation Index | automated controls / total controls |
≥ 70% | Quarterly | DevSecOps |
| 9 | Policy Drift Score | resources violating policy / total in scope |
≤ 5% | Weekly | Governance |
| 10 | Security Confidence Index | survey-derived, see below | ≥ 70 | Quarterly | Engineering |
Notes on the less obvious metrics
Attack Surface Trend (7) is deliberately a relative measure. Absolute attack surface growth is expected in a growing business; the meaningful signal is whether surface is growing faster than the business. Surface growth outpacing service growth means new capability is being exposed without corresponding decommissioning — the signature of accrual.
Security Automation Index (8) measures the proportion of controls enforced without human action. Its importance is that manual controls degrade under load. A control that requires a human review step has an effective coverage equal to the review team's capacity, which is fixed while deployment frequency is not. Automation Index is therefore a leading indicator for every other metric.
Policy Drift Score (9) should be measured against policy as it exists today, including newly added policies. Organizations frequently game this by excluding legacy scope from new policies, which produces an improving score alongside constant real-world debt. Report legacy exclusions explicitly as a separate line.
Security Confidence Index (10) is the one qualitative metric, and it earns its place. Four questions to engineers, quarterly, scored 1–5:
- If a critical vulnerability were disclosed today in a core dependency, could your team patch production within 24 hours?
- Can you enumerate every external entry point into the systems your team owns?
- Do you know who owns every service yours depends on?
- If a credential your service uses leaked today, would anyone detect it?
Aggregate confidence tracks actual posture more closely than most automated scans, because engineers possess accurate models of their own systems' weaknesses and are rarely asked for them systematically. Divergence between Confidence Index and SDI is itself diagnostic: high confidence with high SDI indicates a visibility problem; low confidence with low SDI indicates a communication problem.
Metric anti-patterns
- Counting findings. Finding count measures scanner configuration, not posture. It rises when tooling improves, which punishes exactly the behavior you want.
- Mean time to remediate, unqualified. MTTR improves when trivial findings are auto-closed. Segment by severity band and by whether the item sits on a reachable path.
- Coverage without depth. "100% of services scanned" says nothing about what the scan examined.
- Point-in-time compliance percentages. These measure the date of the audit, not the state of the system.
Every metric in the table above is defined so that the cheapest path to improvement is the desired engineering action. This is the only durable defense against measurement gaming, and it must be designed in rather than policed afterwards.
Chapter 12 — Engineering Economics of Security Debt
Security investment arguments usually fail for a specific reason: they compare a certain cost against an uncertain loss. Engineering leaders are correctly skeptical of expected-loss arguments built on industry-average breach costs, because those averages describe a distribution their organization may not belong to.
The debt framing permits a stronger argument, one that does not require predicting an incident at all.
The remediation cost curve
The cost of remediating a security debt item is a function of its age, and the function is not linear:
   C(t) = C₀ × e^(kt)

   C₀ = cost to remediate at creation
   t  = age of the debt item
   k  = coupling coefficient — how strongly the item becomes
        entangled with other systems over time
The mechanism is entanglement rather than decay. An over-permissive role created today can be corrected in minutes. The same role after three years has been cloned into templates, referenced in automation, depended upon by systems whose owners have left, and embedded in workflows nobody has documented. Nothing about the role changed. Everything about the cost of changing it did.
Illustrative magnitudes, drawn from typical remediation efforts:
| Debt item | At creation | At 1 year | At 3 years | Cost driver at 3 years |
|---|---|---|---|---|
| Over-permissive IAM role | ~15 min | ~2 days | ~3 weeks | Unknown dependents; requires usage analysis + staged rollback |
| Hardcoded credential | ~1 hour | ~1 week | ~2 months | Value propagated to logs, backups, forks, third parties |
| Undocumented API endpoint | ~2 hours | ~1 week | ~6 weeks | External consumers; contractual removal constraints |
| Dependency one major behind | ~4 hours | ~3 days | ~2 months | Compounded breaking changes across four majors |
| Unowned service | ~1 day | ~2 weeks | ~4 months | Knowledge fully lost; requires reverse-engineering |
The argument this enables does not depend on breach probability. It is: this item will cost roughly 15 minutes today and roughly 3 weeks in three years, and we will remediate it eventually either way. The only question is the exchange rate, and the exchange rate is unfavorable and worsening.
Preventive versus reactive engineering
| Dimension | Preventive engineering | Reactive incident response |
|---|---|---|
| Scheduling | Chosen by the organization | Chosen by the adversary |
| Staffing | Planned allocation | Full diversion of senior engineering |
| Duration | Bounded, estimable | Open-ended |
| Scope | Narrow, isolated | Broad — forensics assumes nothing is trusted |
| Quality | Normal review, normal testing | Emergency changes, deferred review |
| Secondary debt | Reduces debt | Creates debt (emergency exceptions, temporary access) |
| Organizational cost | Opportunity cost only | Legal, regulatory, customer, insurance, attrition |
| Learning value | Compounding | High but expensive |
The row deserving emphasis is secondary debt. Incident response is a debt-generating activity. Break-glass access is granted, monitoring is disabled to reduce noise, changes bypass review, and exceptions are filed with the intention of revisiting them. In the six months following a significant incident, most organizations' SDI rises — even as their perceived security posture improves. Incident response should be explicitly instrumented to close its own debt: every emergency grant, exception, and bypass entered into a tracked queue with a hard expiry, closed as an explicit exit criterion of the incident.
The Debt Service Ratio
A single ratio captures the sustainability of a security program:
   DSR = (engineering hours on reactive security work)
         ────────────────────────────────────────────
(total engineering hours on security work)| DSR | Interpretation |
|---|---|
| < 0.20 | Healthy. Capacity exists for structural work. |
| 0.20–0.40 | Sustainable but tightening. |
| 0.40–0.60 | Debt trap forming. Preventive work is being displaced. |
| > 0.60 | Debt trap. Reactive work consumes the capacity needed to reduce the debt causing the reactive work. |
Above 0.60 the system is self-reinforcing and cannot be escaped by working harder. Escape requires either temporary capacity injection or deliberate acceptance of some risk categories to free capacity for structural fixes. This is the most useful diagnostic a CISO can present to a board, because it reframes the ask from "more security" to "breaking a documented feedback loop."
The productivity dimension
Security debt has a cost that appears in the engineering budget rather than the security budget, and it is usually larger:
- Change hesitancy. Engineers avoid modifying systems whose security implications they cannot reason about. Unowned, undocumented services become permanently frozen, and their debt becomes permanent with them.
- Review overhead. Low automation forces manual review, which becomes a queue, which becomes a delivery bottleneck.
- Environment friction. Poor secrets management makes local development difficult, which drives credential copying, which creates more secrets debt. This loop is self-amplifying.
- Onboarding drag. New engineers in high-debt environments take substantially longer to reach productive output, because system behavior cannot be inferred from system documentation.
An organization at SDI 65 is paying for its debt continuously in engineering velocity. It simply attributes the cost to other causes.
Chapter 13 — Enterprise Case Study
The following is a composite drawn from typical patterns in mid-to-large SaaS organizations. Metrics are representative placeholders illustrating the shape of a debt reduction program, not measurements of a specific company.
Context
A B2B SaaS platform, twelve years old, approximately 900 engineers across 140 teams. Multi-region cloud deployment, roughly 600 microservices, strong compliance record: SOC 2 Type II maintained continuously for seven years, ISO 27001 certified, annual penetration tests with no critical findings in three years.
No material security incident in the company's history.
The assessment was commissioned not because of a concern but because of an acquisition due-diligence process that asked a question leadership could not answer: how has your security posture changed over the last three years?
Assessment findings
The initial SDI computation took six weeks, most of it spent building the data pipeline rather than analyzing.
| Component | Score | Principal driver |
|---|---|---|
| Identity Debt | 71 | Entitlement precision at 9%; 3,400 non-human identities, 61% unowned |
| Secrets Debt | 58 | 94% vaulted, but only 22% of rotations verified revocation |
| Cloud Config Debt | 49 | IaC reconciliation 74%; two unmanaged accounts discovered |
| Dependency Debt | 64 | 31% of graph at D3 or worse; 40 packages at D5 |
| API Exposure Debt | 73 | 1,200 endpoints observed, 780 catalogued |
| Infrastructure Debt | 66 | Ownership coverage 51% |
| Monitoring Debt | 38 | Strong coverage on tier-1; near-zero on legacy estate |
| Governance Debt | 52 | 340 open exceptions, median age 490 days |
| Automation Debt | 55 | Policy enforced in CI for 6 of 14 pipeline types |
| Documentation Debt | 69 | Architecture records current for 23% of services |
| SDI (raw) | 59.8 | |
| Composition factor C | 0.31 | Nine internet-to-PII paths through unowned components |
| SDI (effective) | 78.3 | Band: Compounding |
Three findings reframed the discussion more than the number itself:
- The clean audit record was accurate and uninformative. Every control tested by the audit scope was functioning. The debt sat almost entirely outside audit scope — in the legacy estate, in non-human identities, and in undocumented endpoints.
- Debt velocity was positive and accelerating.
r = +0.08per quarter. The organization was creating debt roughly 30% faster than it retired it, and the gap widened with each hiring wave. - The largest single contributor was ownership, not configuration. 66% of high-severity items sat on assets in Q2 or Q4 of the Ownership Matrix. This meant the problem was organizational before it was technical — and therefore not solvable by purchasing tooling.
Intervention
An 18-month program, deliberately sequenced to establish measurement before remediation:
Phase 1 (months 1–3): Visibility. SDI pipeline automated. Ownership attestation across the estate. External attack surface discovery. No remediation targets set — deliberately, to avoid incentivizing measurement suppression.
Phase 2 (months 4–9): Ownership and reduction. Every asset assigned or queued for decommission. 190 assets retired. Dormant identities eliminated. Exception backlog forced through expiry: 340 exceptions reduced to 61, of which 44 were re-approved with 90-day expiries.
Phase 3 (months 10–15): Automation. Policy-as-code at admission across all pipelines. Workload identity federation for the four largest service groups. Automated dependency upgrade pipeline with staged rollout.
Phase 4 (months 16–18): Institutionalization. SDI in quarterly business review. Debt budget per team. Exception expiry enforced in tooling rather than process.
Results
| Metric | Before | After 18 months | Change |
|---|---|---|---|
| SDI (effective) | 78.3 | 34.1 | −56% |
Debt velocity r |
+0.08 /qtr | −0.04 /qtr | Net retirement |
| Identity Health Score | 29 | 74 | +45 pts |
| Entitlement precision | 9% | 58% | +49 pts |
| Non-human identities | 3,400 | 1,900 | −44% |
| Ownership coverage | 51% | 93% | +42 pts |
| API catalog coverage | 65% | 97% | +32 pts |
| Dependencies at D3+ | 31% | 8% | −23 pts |
| Verified-revocation rotations | 22% | 96% | +74 pts |
| Open exceptions (median age) | 340 (490 d) | 58 (41 d) | −83% count |
| Internet-to-PII paths (C factor) | 0.31 | 0.07 | −77% |
| Debt Service Ratio | 0.58 | 0.24 | −0.34 |
| Median dependency patch time | 34 d | 3 d | −91% |
The most consequential outcome was not in the table. Eleven months into the program, a critical vulnerability was disclosed in a widely used library present in 40% of the organization's services. Remediation completed in 31 hours across the entire estate. The same disclosure two years earlier would have required an estimated three to four weeks, because the affected services were at D3, unowned, and lacked automated deployment paths.
No incident occurred. No incident was prevented in any measurable sense. What changed was the cost of responding, and that is what security debt reduction actually purchases.
Chapter 14 — The Security Debt Dashboard
Executive dashboards fail in two directions: too abstract to act on, or too detailed to read. The design below resolves this by separating three questions across three tiers — where are we, which direction, and what specifically.
Tier 1 — Position and direction (executive view)
Four elements only. This tier should be legible in under fifteen seconds.
┌────────────────────────────────────────────────────────────────┐
│  SECURITY DEBT INDEX          34.1  ▼ 4.2 QoQ    [CONTROLLED]  │
│  ───────────────────────────────────────────────────────────── │
│  DEBT VELOCITY (r)           −0.04  ▼           Net retirement │
│  DEBT SERVICE RATIO           0.24  ▼ 0.06      Sustainable    │
│  CRITICAL EXPOSURE PATHS         2  ▼ 7         Internet→PII   │
└────────────────────────────────────────────────────────────────┘
Debt velocity is the primary executive metric. SDI level is largely inherited; velocity is current management performance and is the only figure over which this quarter's decisions have direct influence.
Critical exposure paths is a deliberately small integer. Small integers create accountability in a way percentages do not. "We have two paths from the internet to customer data through unowned components" produces action; "cloud exposure score 14.2" produces a follow-up meeting.
Tier 2 — Component decomposition (engineering leadership)
Ten components with current score, quarterly delta, and owning function. Each cell links to the underlying item list. The delta column is the useful one — a component at 40 and falling is in better health than one at 30 and rising.
| Component | Score | Δ QoQ | Owner | Trend |
|---|---|---|---|---|
| Identity | 26 | ▼ 45 | IAM Platform | ▁▃▅▇▅▃▁ |
| Secrets | 19 | ▼ 39 | Platform Eng | ▁▂▄▆▄▂▁ |
| Cloud Config | 31 | ▼ 18 | Cloud Platform | ▃▄▅▄▃▂▂ |
| Dependency | 28 | ▼ 36 | Eng (federated) | ▅▆▇▅▃▂▂ |
| API Exposure | 22 | ▼ 51 | API Platform | ▇▇▆▄▃▂▁ |
| Infrastructure | 33 | ▼ 33 | SRE | ▆▆▅▄▃▃▂ |
| Monitoring | 24 | ▼ 14 | Detection Eng | ▃▃▃▂▂▂▂ |
| Governance | 29 | ▼ 23 | Security GRC | ▅▅▄▄▃▃▂ |
| Automation | 35 | ▼ 16 | DevSecOps | ▅▅▄▄▄▃▃ |
| Documentation | 44 | ▼ 25 | Eng (federated) | ▆▆▅▅▄▄▃ |
Tier 3 — Operational panels (team view)
Nine panels, each answering one question and each drillable to a list of items with owners:
| Panel | Question answered | Alert condition |
|---|---|---|
| Critical asset register | What must never be compromised, and is it covered? | Any tier-0 asset without full control coverage |
| IAM health | Where is entitlement concentrated? | Standing privileged access > 3% |
| Dependency freshness | What can't we patch quickly? | Any D4/D5 in a tier-1 service |
| Secrets status | What credentials are long-lived or unrevoked? | Any secret with TTL > 90 d in production |
| Cloud exposure | What is reachable that shouldn't be? | New internet-facing resource without review |
| Attack surface | Is surface growing faster than the business? | Surface growth > service growth |
| Incident readiness | Can we respond? | Runbook untested in 90 d |
| Compliance trend | Are controls drifting between audits? | Control effectiveness declining 2 periods |
| Ownership coverage | What has no owner? | Any Q2/Q4 asset in a critical path |
Design principles
- Every number has an owner. A metric without an accountable name is a report, not a control.
- Trend beats snapshot. Every tile shows direction. A green tile trending red is more urgent than a stable amber one.
- Absolute counts for critical items. Percentages hide small numbers of severe problems.
- Instrumentation gaps are shown, not hidden. A component with poor data coverage displays as "insufficient data," never as a good score. Silence must never render as success.
- No composite that cannot be decomposed in one click. Aggregates that cannot be traced to items are decorative.
Chapter 15 — Twenty Common Sources of Security Debt
Each entry lists the mechanism by which the debt forms, the detection signal available today, and the structural fix. The structural fix column matters most: these items recur, and a remediation that does not change the generating mechanism guarantees the item returns.
| # | Source | How it forms | Detection signal | Structural fix |
|---|---|---|---|---|
| 1 | Shared administrative accounts | Legacy systems without individual identity; convenience during scaling | Multiple source IPs / sessions on one credential | Individual identities + break-glass with session recording |
| 2 | Permanent access tokens | Created for automation; no expiry field required at creation | Tokens with no expiry or > 90 d age | Max-TTL enforced at issuance; short-lived by default |
| 3 | Manual firewall rules | Emergency connectivity fix during an incident | Rules absent from IaC declarations | All network rules through IaC; console changes rejected |
| 4 | Forgotten API endpoints | Superseded but never removed for fear of breaking consumers | Endpoints with zero attributed consumers | Consumer telemetry + staged dark-period removal |
| 5 | Unused storage buckets | Created for a migration, project, or test; never cleaned up | No access events in 180 d | Creation-time TTL; lifecycle policy mandatory |
| 6 | Disabled monitoring | Turned off to reduce alert noise during an incident | Log source silent > 24 h | Alert on absence of telemetry, not just on events |
| 7 | Outdated TLS configurations | Set at deployment; never revisited as standards moved | TLS version / cipher scan | Centralized termination; config as code |
| 8 | Expired ownership | Team dissolved or reorganized; assets not reassigned | Owner field references inactive group | Quarterly attestation; unclaimed → decommission queue |
| 9 | Temporary exceptions | Granted with intent to revisit; no expiry in the schema | Exception age > 90 d | Mandatory expiry field; no indefinite option |
| 10 | Dormant user accounts | Offboarding covers IdP but not cloud-native or local identities | No authentication in 60 d | Automated deprovisioning across all identity stores |
| 11 | Orphaned service accounts | Created for one job; creator left | No named owner; low or no recent usage | Owner + expiry required at creation |
| 12 | Unpatched internal services | Assumed safe because not internet-facing | Version drift vs. baseline | Patch SLA independent of network position |
| 13 | Dangling DNS records | Resource deallocated; record remains | Record resolving to unallocated address | DNS reconciliation job tied to resource lifecycle |
| 14 | Hardcoded credentials in CI | Fastest path to a working pipeline | Secret scanning across config and history | OIDC federation; pipeline secrets from vault only |
| 15 | Unmanaged cloud accounts | Team creates account outside central organization | Billing records without organizational linkage | Procurement gate + billing reconciliation |
| 16 | Legacy admin roles | Created pre-granularity; still load-bearing | High-privilege role with unknown consumers | Usage analysis → decompose → staged removal |
| 17 | Abandoned dependencies | Maintainer stopped; nobody noticed | No upstream release in 24 mo | Maintainer health in dependency policy |
| 18 | Undocumented data flows | Integration built quickly; diagram never produced | Service in data path absent from DFD | Data flow declaration in service manifest |
| 19 | Unreviewed third-party integrations | Vendor onboarded by a business unit | SaaS discovery via SSO and network telemetry | Integration registry; periodic re-review |
| 20 | Stale IaC modules | Module forked for a project; drifted from source | Version lag vs. upstream module registry | Module versioning policy + automated bumps |
Two patterns run through this table.
First, most debt is created during incidents and migrations — precisely the moments when normal controls are relaxed by design. These are not failures of discipline; they are the intended behavior of a system that permits emergency action. The correction is not stricter emergency process but mandatory post-emergency reconciliation.
Second, almost every structural fix is a default change rather than a new control. Requiring an expiry field, rejecting console changes, alerting on telemetry absence: these do not add work to the common path. They change what happens when someone does nothing, which is the only reliable lever against debt, because doing nothing is the most common engineering action.
Chapter 16 — The Security Maturity Model
Maturity models are frequently criticized as aspirational theater, and the criticism is fair when levels are defined by intent rather than by observable properties. The model below defines each level by what the organization can measure and what it does automatically — both externally verifiable.
The five levels
Level 1 — Reactive Security. Security work is triggered by events: an incident, an audit, a customer questionnaire, a disclosure. Between triggers, posture drifts unobserved. Controls exist but are enforced by human review. Observable marker: the organization cannot state its security posture without commissioning an assessment.
Level 2 — Policy-Based Security. Written standards exist and reviews are scheduled. Enforcement remains manual and lagging — policy describes the intended state, and drift from it is discovered at review time. Observable marker: policy exists; compliance with it is measured periodically, not continuously.
Level 3 — Integrated DevSecOps. Controls move into the delivery pipeline. Scanning, policy checks, and dependency validation run automatically on change. Debt creation slows substantially, but existing debt is largely untouched because it predates the pipeline. Observable marker: new debt is prevented at commit; legacy debt is not measured.
Level 4 — Continuous Security Engineering. Posture is measured continuously and expressed as tracked metrics with owners. Debt is quantified, budgeted, and retired on a schedule. Exceptions expire automatically. Observable marker: the organization can state its debt trajectory for the current quarter without commissioning work.
Level 5 — Adaptive Security Organization. Controls adjust to observed conditions. Ownership is enforced structurally — assets cannot be created without an accountable owner and a lifecycle. Architectural decisions are evaluated for their debt-generation rate before approval. Observable marker: the debt generation rate is itself a design constraint on new systems.
Domain maturity across five disciplines
| Level | Identity Management | Cloud Security | DevSecOps | Security Governance | Enterprise Security Engineering |
|---|---|---|---|---|---|
| 1 | Manual provisioning; shared accounts | Console-managed; ad-hoc review | Security testing post-release | Ad-hoc policy; incident-driven | Security as a gate before release |
| 2 | Centralized IdP; periodic access review | CSPM detect-and-ticket | Scanners in CI, advisory only | Written standards; scheduled audit | Security consulted at design review |
| 3 | RBAC; automated joiner/mover/leaver | IaC with drift detection | Blocking gates; SBOM per build | Policy-as-code partially enforced | Security requirements in definition of done |
| 4 | JIT elevation; usage-based right-sizing | Admission-time policy; auto-remediation | Continuous verification in production | Exceptions expire automatically; SDI tracked | Platform provides secure defaults; opt-out is exceptional |
| 5 | Workload identity federation; zero standing privilege | Deny-by-default guardrails; provable reachability | Behavioral regression on control paths | Debt budgets per team; governance measured by outcome | Debt generation rate constrains architecture decisions |
Using the model honestly
Three observations from applying this in practice:
Levels are not uniform across domains. Most organizations sit at Level 3 in DevSecOps and Level 1–2 in identity and infrastructure ownership, because pipeline controls are purchasable and ownership discipline is not. The composite level is the minimum across domains, not the mean, because debt flows to the weakest domain.
Level 3 is a local maximum. It is the most comfortable level: tooling is visible, metrics look good, new code is well-controlled. It is also where debt reduction most often stalls, because the pipeline addresses only what flows through it, and legacy estate does not.
The Level 3 → 4 transition is organizational, not technical. It requires accepting measurement that will initially look bad, assigning owners to things nobody wants to own, and budgeting capacity for work that produces no features. No tool delivers this transition.
Security is not a project. It is accumulated engineering discipline.
Chapter 17 — Security Governance Framework
Governance is the mechanism that converts measurement into action. Without it, SDI is a number that circulates in a monthly deck. The framework below is deliberately minimal — governance debt is itself an SDI component, and elaborate governance is a reliable source of it.
Ten governance domains
| Domain | Core question | Primary artifact | Cadence |
|---|---|---|---|
| Ownership | Does every asset have an accountable name? | Ownership register | Quarterly attestation |
| Reviews | Are design decisions evaluated for debt creation? | Architecture review record | Per significant change |
| Automation | Which controls run without humans? | Automation Index | Quarterly |
| Identity | Who can do what, and is it still needed? | Entitlement report | Monthly |
| Cloud | What is exposed, and was it intended? | Exposure path report | Weekly |
| Secrets | What credentials exist, where, and for how long? | Secret inventory | Monthly |
| Monitoring | What would we fail to detect? | Coverage map | Quarterly |
| Incident learning | Did we close the debt the incident created? | Post-incident debt closure | Per incident |
| Risk review | What are we deliberately accepting? | Exception register | Monthly |
| Architecture | Are we building systems that generate debt? | Debt impact assessment | Per new system |
The three forums
More than three governance bodies produces coordination overhead that exceeds the value of the coordination.
1. Security Debt Council — monthly, engineering leadership. Reviews SDI components and velocity, allocates debt budget, arbitrates ownership disputes for unclaimed assets. Decision-making, not informational. The critical authority this body needs: the power to assign an unowned asset to a team that does not want it, or to authorize its decommissioning over objection.
2. Architecture Review — per significant change. Evaluates new systems for debt generation rate, not just for control presence. Three questions: what identities does this create and who owns them; what surface does this expose and how is it catalogued; what is the decommissioning path.
3. Risk Acceptance Board — monthly, executive. Owns the exception register. Every accepted risk has a named executive owner, an expiry date, and a compensating control. The board's real function is preventing risk acceptance from becoming a silent default.
Accountability model
| Activity | Engineering team | Platform | Security | Executive |
|---|---|---|---|---|
| Asset ownership | Accountable | Consulted | Informed | Informed |
| Debt remediation | Accountable | Supports | Advises | Funds |
| Secure defaults | Consumes | Accountable | Specifies | Funds |
| Debt measurement | Provides data | Provides pipeline | Accountable | Reviews |
| Policy definition | Consulted | Consulted | Accountable | Approves |
| Risk acceptance | Requests | Consulted | Advises | Accountable |
| Exception expiry | Actions | Enforces | Monitors | Accountable |
The load-bearing row is secure defaults. When the platform owns them, security scales with platform adoption rather than with security headcount. When security owns them directly, security becomes a bottleneck and teams route around it — which converts a control into a debt generator.
Governance anti-patterns
- Governance without authority. A body that reports but cannot assign ownership or block deployment is an information channel.
- Exception processes without expiry. Discussed in Chapter 7; it is the single most common governance failure.
- Security as approver rather than enabler. Approval-based governance scales linearly with headcount; default-based governance scales with platform adoption.
- Metrics without budget. Measuring debt while allocating no capacity to retire it produces a well-documented decline.
Chapter 18 — Roadmap for Reducing Security Debt
The sequencing below reflects a hard-won ordering constraint: measurement precedes targets, ownership precedes remediation, and automation precedes scale. Programs that invert this ordering fail predictably — remediation without ownership produces work that is never sustained, and targets without measurement produce suppressed measurement.
90 days — Establish the balance sheet
Objective: know the number. Set no remediation targets.
- Instrument the ten SDI components using existing telemetry; accept partial coverage and report gaps explicitly.
- Run external attack surface discovery and reconcile against internal inventory. The delta is Q4 of the Ownership Matrix.
- Execute one ownership attestation cycle across all assets. Record unclaimed assets; do not act yet.
- Inventory all exceptions; add expiry dates to the schema even if not yet enforced.
- Compute the Debt Service Ratio and baseline debt velocity.
Exit criteria: SDI computed with documented confidence intervals; unclaimed asset list produced; DSR baselined.
The discipline of setting no targets in this phase is essential. Targets during baselining incentivize measuring less rather than remediating more, and a corrupted baseline invalidates every subsequent quarter of trend data.
6 months — Ownership and the highest-leverage reductions
Objective: eliminate unowned assets and reduce composition factor C.
- Assign or decommission every Q2 asset. Unclaimed after 30 days enters staged teardown.
- Eliminate dormant identities across all identity stores, including cloud-native and database-local.
- Force the exception backlog through expiry; re-approve deliberately with 90-day terms.
- Remediate the internet-to-sensitive-data paths identified by exposure path analysis. These drive C, which is the highest-multiplier term in the model.
- Deploy per-endpoint consumer telemetry to enable API removal.
Exit criteria: ownership coverage ≥ 85%; C reduced by half; exception median age < 90 days.
12 months — Automate the generating mechanism
Objective: make debt creation harder than debt avoidance.
- Policy-as-code at admission across all deployment pipelines, with the exception discipline from Chapter 7.
- Workload identity federation for the largest service groups; retire long-lived static credentials in those paths.
- Automated dependency upgrade pipeline with staged rollout; target ≥ 80% of graph at D0–D1.
- Creation-time TTL mandatory for non-production environments and non-human identities.
- Reverse debt velocity: sustained negative
r.
Exit criteria: r < 0; Automation Index ≥ 60%; zero D4/D5 dependencies in tier-1 services.
This phase contains the program's most important transition. Everything before it reduces existing debt; this phase reduces the rate of creation. Without it, the earlier gains decay within two years.
24 months — Institutionalize
Objective: make debt management an ordinary engineering practice rather than a program.
- SDI in quarterly business review alongside reliability and delivery metrics.
- Debt budget per team, allocated like error budget: teams exceeding their allocation pause feature work.
- Debt impact assessment mandatory in architecture review for new systems.
- Zero standing privileged access; JIT elevation universal.
- Post-incident debt closure as a formal incident exit criterion.
Exit criteria: SDI ≤ 35 effective; DSR ≤ 0.25; ownership coverage ≥ 95%; program dissolved into normal operating rhythm.
Sequencing failures to avoid
| Anti-pattern | Consequence |
|---|---|
| Remediate before measuring | No baseline; improvement unprovable; funding withdrawn |
| Set targets during baselining | Measurement suppression; corrupted trend data |
| Automate before assigning ownership | Automation produces findings nobody actions |
| Attack the largest component first | Identity is largest and hardest; early failure kills the program |
| Treat it as a security program | Remediation capacity sits in engineering; security cannot deliver it alone |
The last row is the most common cause of failure. Security teams can measure debt, specify targets, and design controls. They cannot retire debt at scale, because the work lives in engineering backlogs. A debt reduction program owned solely by security produces excellent reports and minimal change.
Chapter 19 — Executive Checklist
Forty questions. The diagnostic value is not in the answers but in the time required to produce them. A question that takes three weeks to answer identifies an instrumentation gap regardless of what the answer turns out to be. Record answer latency alongside each answer.
Ownership and inventory
- Which production assets currently have no named owner?
- What percentage of our estate was discovered externally but is absent from our inventory?
- When did we last reconcile DNS records against live resources?
- How many cloud accounts or subscriptions exist outside our central organization?
- Which business-critical services are maintained by exactly one person?
- How many assets were decommissioned last quarter?
- What is the median age of an asset with no recorded owner?
- Which of our critical data stores cannot be traced to a documented data flow?
Identity
- What proportion of granted permissions were actually used in the last 90 days?
- How many inactive identities still hold privileged access?
- How many non-human identities exist, and what share have named owners?
- What percentage of privileged actions are attributable to an individual human?
- How many identities hold standing — as opposed to just-in-time — privileged access?
- What is our median time to fully deprovision a departing engineer across all identity stores?
- Which roles were created more than five years ago and are still attached to production?
Dependencies and supply chain
- What percentage of our dependency graph is outside its upstream support window?
- How old is the oldest dependency in a tier-1 service?
- If a critical vulnerability were disclosed today in our most widely used library, what is our realistic time to full remediation?
- How many packages in our graph have had no maintainer activity in two years?
- Do we verify build provenance for artifacts entering production?
Secrets
- What percentage of secrets were rotated last quarter — and what percentage of those rotations verified that the old value was revoked?
- What is the median lifetime of a production credential?
- How many secrets exist outside managed storage?
- Would we detect a leaked credential being used from an unexpected location?
- How many TLS certificates are issued manually?
Cloud and infrastructure
- What proportion of production resources match their infrastructure-as-code declaration?
- How many distinct paths exist today from an unauthenticated internet position to sensitive data?
- How many resources were created outside the sanctioned deployment pipeline last quarter?
- What percentage of our cloud spend is attributable to resources with no identified consumer?
APIs and attack surface
- How many production endpoints are absent from our API catalog?
- How many deprecated endpoints are still serving traffic, and for how long have they been deprecated?
- Which endpoints have no identified consumer in the last 30 days?
- Is our external attack surface growing faster than our service count?
AI systems
- What permissions do our AI agents hold, and what proportion do they actually use?
- Can an agent take an irreversible external action without human confirmation?
- Are access controls in our retrieval systems synchronized with the source systems?
- Do we retain queryable telemetry of prompts, retrieved context, and tool calls?
Governance and readiness
- How many security exceptions are open, and what is their median age?
- What proportion of our engineering security effort is reactive rather than preventive?
- Is our Security Debt Index rising or falling this quarter, and by how much?
Question 40 is the one that matters. If the organization cannot answer it in under a day, the program described in this paper has not begun.
Chapter 20 — Final Thoughts
The argument of this paper is narrow, and it is worth restating without ornament.
Security is not a state that is verified. It is a balance that is managed. Every engineering organization creates security liabilities continuously as an ordinary byproduct of building software, and the question that determines outcomes is not whether those liabilities exist — they always do — but whether the organization retires them faster than it creates them.
That question has an answer. It is computable from data most organizations already have. It is attributable to teams. It moves in response to engineering decisions within a single quarter. And in the overwhelming majority of organizations, nobody has ever calculated it.
The result is a discipline gap that has no parallel elsewhere in engineering. No competent organization would run a production system without latency metrics, error budgets, or capacity forecasts. Yet the same organizations manage security through periodic assessment — the equivalent of measuring latency once a year and assuming the intervening months resembled the sample.
What debt reduction actually purchases is worth being precise about, because overstating it is how these programs lose credibility. It does not prevent incidents; no engineering practice does. It changes what an incident costs. It is the difference between a disclosed vulnerability remediated in thirty-one hours and the same vulnerability remediated in three weeks. It is the difference between one leaked credential granting access to one bucket and one leaked credential granting access to an estate. Nothing about the adversary changes. Everything about the organization's position when the adversary arrives does.
None of this requires new technology. The measurements described here are computed from IAM exports, SBOMs, cloud APIs, gateway logs, and secret stores — data that already exists in every organization discussed. What is missing is not capability. It is the decision to look, the willingness to see a number that will initially be unflattering, and the discipline to track it with the same seriousness applied to uptime.
The organizations that manage this well are not the ones with the largest security budgets. They are the ones that made ownership structural, made expiry the default, and made the debt number visible to the people who create it.
The question to carry out of this paper is not whether your organization is secure. That question has no measurable answer.
The question is: we regularly measure technical debt — why aren't we measuring security debt with the same discipline?



