
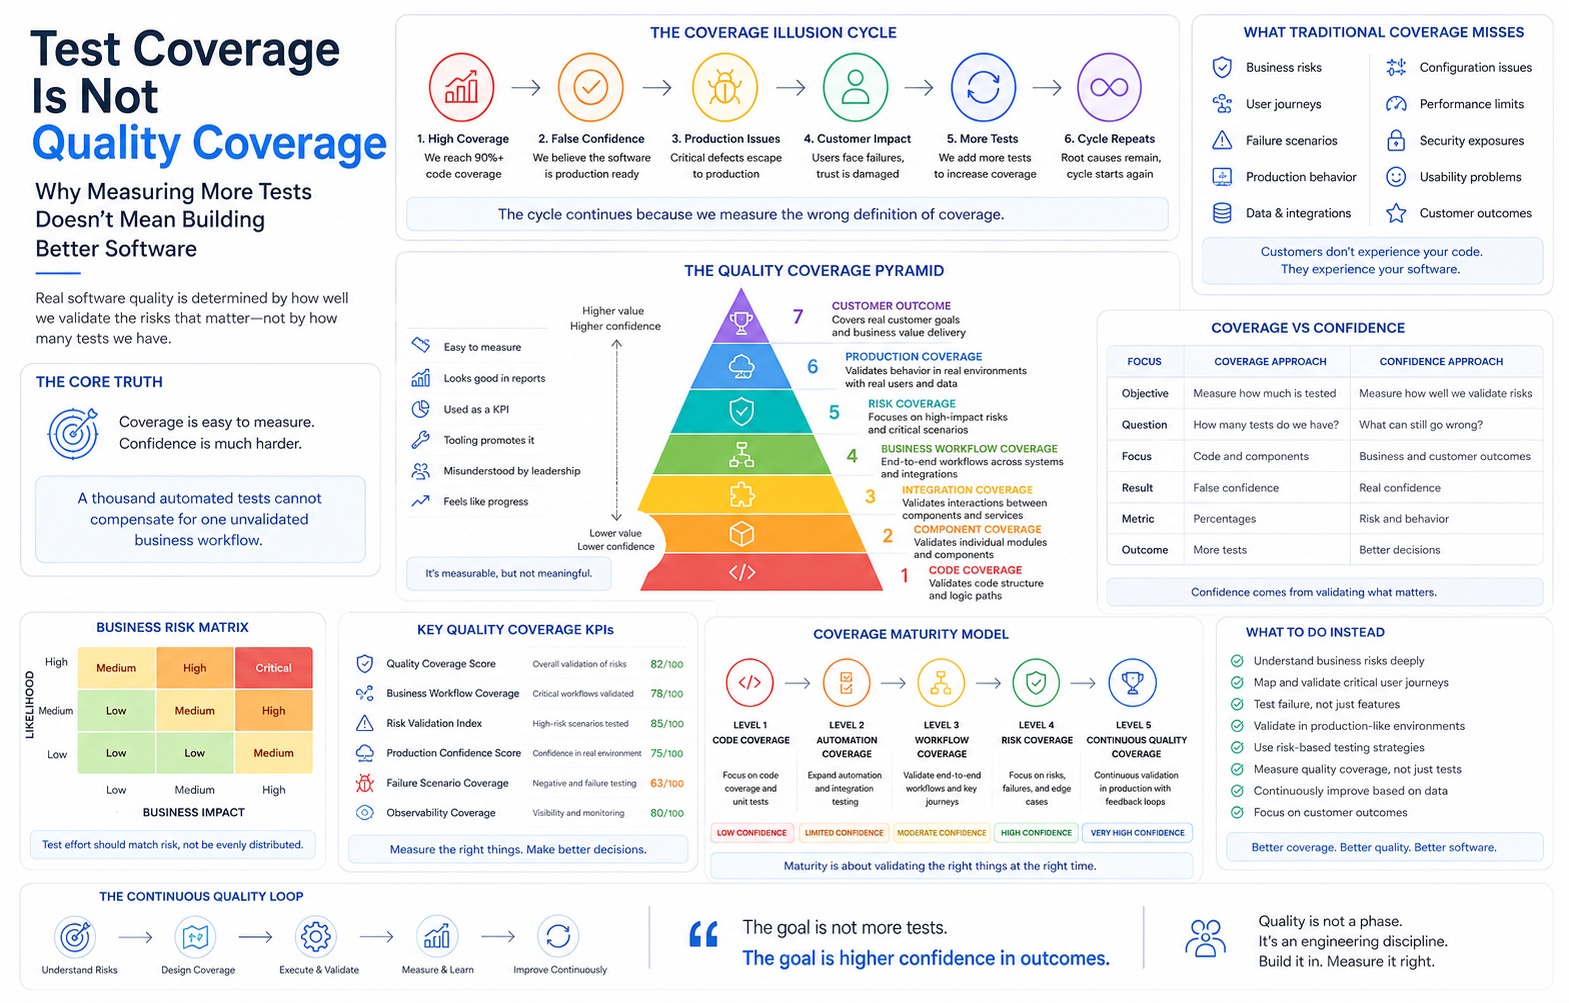
There is a persistent paradox in modern software engineering.
Organizations invest years building automated test suites. They report 95% code coverage. They run 20,000 tests on every commit. Their pipelines are green. Their dashboards are green. Their quarterly engineering reviews contain a slide showing a coverage line moving up and to the right.
And their customers still find the defects first.
Payments still fail during peak load. Onboarding still breaks for the fourth-largest account. A subscription renewal job silently skips 3% of accounts for eleven days. An authentication token refresh path degrades in one region and nobody notices until support tickets cluster. In the post-incident review, someone inevitably asks the question that exposes the whole illusion:
"Was this code covered by tests?"
And the answer, uncomfortably often, is: yes.
The code was covered. The behavior was not. The workflow was not. The failure mode was not. The production configuration was not. The customer outcome was not.
This paper argues that coverage, as most engineering organizations measure it, is a proxy metric that has been mistaken for the thing itself. Code coverage measures which lines were executed during a test run. It does not measure whether the system does what the business requires, under the conditions the business will actually encounter, when the dependencies the business relies on behave badly.
The distinction matters because engineering effort is finite. Every hour spent writing a low-value test is an hour not spent validating a high-value risk. Organizations that optimize test quantity are not neutral — they are actively misallocating their most expensive resource while generating confidence they have not earned.
Coverage is easy to measure. Confidence is much harder.
This paper introduces a different model of coverage built around seven layers of validation, from code to customer outcome; a set of measurable quality-coverage KPIs designed to replace percentage-based reporting; a risk prioritization method for allocating testing effort; a five-level maturity model; and a practical strategy framework for restructuring an existing test estate without halting delivery.
It does not recommend writing more tests. In several places, it recommends writing fewer.
The intended outcome for the reader is a single, uncomfortable, useful realization:
We have been measuring the wrong definition of coverage.
Chapter 1 — The Coverage Illusion
1.1 What coverage actually measures
Code coverage instrumentation answers one narrow question: during this test execution, which lines, branches, or statements were executed at least once?
That is all it answers. It does not assert that the executed code produced correct output. It does not assert that the assertions were meaningful. It does not assert that the inputs resembled production data. It does not assert that anything downstream of the code behaved correctly.
A test that calls a function and asserts nothing produces identical coverage to a test that calls the same function and validates twelve business invariants. The instrumentation cannot tell them apart. Neither can your dashboard.
This is not a criticism of the tool. Coverage instrumentation does precisely what it was designed to do. The failure is interpretive: organizations read an execution metric as a correctness metric, and then make budget, staffing, and release decisions on that misreading.
1.2 Three illusions
Illusion One: High coverage implies high confidence.
90% Code Coverage
        ↓
"We are well tested"
        ↓
Production incident in the covered 90%
The uncovered 10% receives disproportionate attention in coverage reviews, because it is visible. But in most incident post-mortems the failing code path was executed by tests. It was executed with the wrong data, in the wrong sequence, against a mocked dependency that never returned the error the real dependency returns.
Illusion Two: Passing tests imply working software.
20,000 tests passing
        ↓
Deploy
        ↓
Checkout fails for customers using saved payment methods
A passing test suite proves that the system behaves as the suite expects. If the suite's expectations were derived from the same misunderstanding that produced the bug, the suite will confirm the bug rather than catch it. Tests written by the author of a feature encode that author's mental model — including its blind spots.
Illusion Three: A large automation suite implies broad validation.
4,300 automated tests
        ↓
Business workflow "Enterprise SSO onboarding"
        ↓
Never executed end-to-end by any test
Suite size correlates with the number of things validated, not with the importance of things validated. Large suites accumulate around code that is easy to test — pure functions, validators, mappers, formatters — because that is where the friction is lowest. The highest-risk paths are usually the ones with the most integration surface, and those are precisely the paths engineers avoid automating.
1.3 The structural reason this happens
Test suites do not grow according to a plan. They grow according to incentive gradients.
| Force | Effect on the test estate |
|---|---|
| Coverage gates in CI (e.g. "no PR below 80%") | Produces tests optimized to touch lines, not to validate behavior |
| Ease of unit testing pure logic | Over-indexes on low-risk, low-integration code |
| Difficulty of testing distributed workflows | Under-indexes on the highest-risk paths |
| Flaky end-to-end tests being deleted or quarantined | Systematically removes the most realistic validations |
| Performance reviews citing "tests written" | Rewards volume |
| Absence of a risk register | Removes any basis for prioritization |
The result is predictable: the test estate becomes an inverse map of business risk. The more critical and more integrated a path is, the less likely it is to be genuinely validated.
1.4 The correct framing
Coverage is not meaningless. It is conditionally meaningful.
Coverage creates confidence only when it covers the right things.
A 40% coverage figure concentrated on payment authorization, idempotency, token refresh, and tenant isolation is worth more than a 95% figure spread evenly across a codebase in which 70% of modules cannot cause a customer-visible failure.
The question "what is our coverage?" is unanswerable in a useful way. The answerable questions are:
- Coverage of what?
- Coverage against which failure modes?
- Coverage under which conditions?
- Coverage validated where — in a mock, an integration environment, or production?
Every framework in this paper exists to make those four questions routine.
1.5 Practical recommendation for Chapter 1
Run a one-week diagnostic before changing anything:
- Take the last 12 months of customer-visible incidents.
- For each, identify the code path that failed.
- Determine whether that path was covered by tests at the time of the incident.
- Classify the reason coverage did not prevent it.
Most organizations find that 60–85% of incidents occurred in covered code. That single number is the most persuasive artifact you will ever produce for changing a testing strategy, because it is derived from your own history rather than from an external opinion.
Classify each into one of six buckets — this classification becomes the input to everything that follows:
| Failure class | Description |
|---|---|
| Wrong assertion | Path executed, but the test validated the wrong property |
| Mocked reality | Dependency behavior in production differed from the test double |
| Missing failure mode | Only the success path was validated |
| Workflow gap | Each component worked; the composition did not |
| Environmental delta | Configuration, scale, or data volume differed from test |
| Unknown behavior | Requirement itself was never specified or understood |
Chapter 2 — Code Coverage vs Quality Coverage
2.1 Two different questions
Code coverage answers: was this executed?
Quality coverage answers: is this risk controlled?
These are not variations of the same metric. They belong to different disciplines. The first is a property of a test run. The second is a property of an engineering organization's understanding of its own system.
2.2 The seven coverage dimensions
Most teams have one dimension. Mature organizations track seven, and understand that they are not substitutes for each other.
| Dimension | Question it answers | Typical instrument | Common state |
|---|---|---|---|
| Code coverage | Which lines executed? | Coverage tooling | Measured, over-reported |
| Test coverage | Which requirements have a test? | Traceability matrix | Partially maintained |
| Business coverage | Which business capabilities are validated? | Capability map | Rarely formalized |
| Risk coverage | Which failure risks have a control? | Risk register | Almost never exists in engineering |
| Workflow coverage | Which end-to-end journeys are validated intact? | Journey tests | Fragmentary |
| Failure coverage | Which failure modes are exercised? | Fault injection, chaos | Rare outside SRE-mature orgs |
| Production coverage | Which behaviors are validated in the real environment? | Synthetic monitoring, SLOs | Owned by ops, disconnected from QA |
| Customer journey coverage | Which real customer outcomes are verified? | Journey SLOs, funnel telemetry | Owned by product, disconnected from both |
The last column is the finding that matters. In most enterprises these dimensions are not merely unmeasured — they are owned by different departments who do not share a vocabulary. QA owns rows 1–2. SRE owns row 7. Product owns row 8. Nobody owns rows 3–6, which is where customer-visible failures originate.
2.3 Comparison: code coverage vs quality coverage
| Attribute | Code Coverage | Quality Coverage |
|---|---|---|
| Unit of measure | Lines / branches / statements | Validated risks and workflows |
| Derived from | Test execution instrumentation | Business risk model |
| Can be gamed | Trivially | Only by lying about risk |
| Sensitive to importance | No | Yes, by construction |
| Detects missing failure modes | No | Yes |
| Detects environment drift | No | Yes |
| Correlates with incident rate | Weakly, sometimes inversely | Strongly, when maintained |
| Cost to increase | Low (write more tests) | High (understand the system) |
| Value of increase | Diminishing rapidly | Sustained |
| Reportable to a board | Yes, misleadingly | Yes, meaningfully |
The row that ends most debates is "cost to increase." Code coverage is cheap to raise, which is exactly why organizations raise it. Quality coverage requires modeling the business, which is expensive, unglamorous, and cannot be delegated to a contractor with a mandate to "get us to 90%."
2.4 The substitution error
The core organizational failure is substitution: an easy-to-measure proxy replaces a hard-to-measure objective, and over time the proxy becomes the objective.
Objective:   Customers do not experience failures
     ↓ (hard to measure)
Proxy:       Requirements are validated
     ↓ (hard to measure)
Proxy:       Tests exist and pass
     ↓ (hard to measure)
Proxy:       Lines are executed
     ↓ (easy to measure)
Metric:      87.4%
Every arrow in that chain loses information. By the time the number reaches a leadership dashboard, it has been separated from the objective by four lossy translations, and it is the only number anyone sees.
2.5 Practical recommendation for Chapter 2
Stop reporting a single coverage percentage to leadership. Replace it with a three-column statement per critical capability:
Capability: Subscription renewal
  Risk severity:        Critical (revenue-recognizing)
  Validation depth:     Component ✔  Integration ✔  Workflow ✖  Failure ✖  Production ✔
  Unvalidated risks:    Dunning retry after gateway 5xx; proration on mid-cycle plan change
This format cannot be gamed by writing trivial tests, and it produces an actionable list rather than a number. A leader reading it knows what to fund. A leader reading "87.4%" knows nothing at all.
Chapter 3 — The Quality Coverage Pyramid
3.1 Why a new model is needed
The classic test pyramid (unit / integration / end-to-end) is a model of test types and their cost. It is useful for structuring a suite, but it says nothing about what should be validated. It is an implementation model, not a risk model.
The Quality Coverage Pyramid replaces test type with validation depth. Each level answers a strictly harder question than the level below it, and each level is closer to the customer.
3.2 The framework
                    ▲   INCREASING BUSINESS VALUE
                    │   INCREASING COST TO VALIDATE
                    │   DECREASING ABILITY TO FAKE
                    │
      ┌─────────────────────────────┐   L7
      │  CUSTOMER OUTCOME COVERAGE  │   Did the customer succeed?
      └─────────────────────────────┘
    ┌─────────────────────────────────┐ L6
    │      PRODUCTION COVERAGE        │ Does it work in reality?
    └─────────────────────────────────┘
  ┌─────────────────────────────────────┐ L5
  │           RISK COVERAGE             │ Are known risks controlled?
  └─────────────────────────────────────┘
 ┌───────────────────────────────────────┐ L4
 │      BUSINESS WORKFLOW COVERAGE       │ Does the journey complete?
 └───────────────────────────────────────┘
┌─────────────────────────────────────────┐ L3
│         INTEGRATION COVERAGE            │ Do the parts compose?
└─────────────────────────────────────────┘
┌───────────────────────────────────────────┐ L2
│           COMPONENT COVERAGE              │ Does the unit behave?
└───────────────────────────────────────────┘
┌─────────────────────────────────────────────┐ L1
│              CODE COVERAGE                  │ Was the line executed?
└─────────────────────────────────────────────┘
3.3 Level definitions
L1 — Code coverage. Execution evidence. Necessary hygiene, zero standalone value. Treat as a leak detector: very low coverage in a critical module is a signal; high coverage anywhere is not.
L2 — Component coverage. The unit behaves correctly across its input domain, including boundaries, invalid inputs, and state transitions. This is where most suites live and where most suites stop.
L3 — Integration coverage. Components compose correctly across real boundaries: contracts, serialization, transactions, retries, ordering, idempotency. The critical discipline here is contract fidelity — a mock that does not reproduce the dependency's real error taxonomy is a false integration test.
L4 — Business workflow coverage. A complete, business-meaningful sequence executes end to end with realistic data and realistic state. Not "the API returns 200" but "a new enterprise customer can go from signup to first successful invoice."
L5 — Risk coverage. Each identified risk — business, technical, regulatory, security — has a corresponding validation control. This level is the first that requires an explicit risk model, and it is the level at which QA becomes an engineering discipline rather than a verification activity.
L6 — Production coverage. Behavior is continuously validated in the real environment: synthetic journeys, SLO burn, canary analysis, feature-flag experiments, real configuration, real data volumes.
L7 — Customer outcome coverage. The customer achieved their goal. Measured via funnel completion, task success rate, support contact rate per journey, and time-to-value. This is the only level whose degradation is definitionally a quality problem.
3.4 Why value increases with height
| Level | What a failure at this level costs to find | Where the customer notices |
|---|---|---|
| L1 | Nothing — it is not a failure | Never |
| L2 | Minutes | Rarely |
| L3 | Hours | Occasionally |
| L4 | Days | Frequently |
| L5 | Weeks | Severely |
| L6 | Live incident | Immediately |
| L7 | Churn | Permanently |
The pyramid inverts the usual investment profile. Organizations spend roughly 70–85% of quality effort at L1–L2, where the customer almost never notices failures, and 5–10% at L4–L7, where every failure is customer-visible.
3.5 Using the pyramid as an assessment instrument
For each critical business capability, mark the highest level at which it is genuinely validated. The resulting profile is the single most useful diagnostic artifact in this paper.
Capability            L1  L2  L3  L4  L5  L6  L7
─────────────────────────────────────────────────
Payment authorization ✔   ✔   ✔   ✔   ◐   ✔   ✖
User authentication   ✔   ✔   ✔   ✔   ✔   ✔   ◐
Onboarding (SMB)      ✔   ✔   ✔   ◐   ✖   ✖   ✖
Onboarding (Ent SSO)  ✔   ✔   ✖   ✖   ✖   ✖   ✖
Subscription renewal  ✔   ✔   ✔   ✖   ✖   ◐   ✖
Data export           ✔   ✔   ◐   ✖   ✖   ✖   ✖
Notifications         ✔   ◐   ✖   ✖   ✖   ✖   ✖
Read that grid and you can predict the next twelve months of incidents with uncomfortable accuracy. Enterprise SSO onboarding will fail. Renewals will fail at the workflow seams. Exports will fail at scale.
3.6 The pyramid's governing rule
Validation depth should be proportional to risk, not to convenience.
A capability may legitimately stop at L2 — if it cannot cause customer-visible harm. The error is not that low-risk capabilities are shallowly validated. The error is that high-risk capabilities are validated to the same depth as low-risk ones, because depth was determined by testability rather than by consequence.
Chapter 4 — Business Risk Is the Real Coverage Metric
4.1 The premise
Software does not fail uniformly. A defect in a tooltip and a defect in payment capture are not the same event, and treating them as equivalent units of "a bug" is the root cause of most misallocated QA effort.
If failures are not uniform, validation should not be uniform either. The organizing question becomes:
What is the business cost of this behavior being wrong, and how likely is it to be wrong?
That question produces a Business Risk Matrix, and the matrix — not the coverage report — should determine where testing effort goes.
4.2 The Business Risk Matrix
Each capability is scored on two axes and one modifier.
- Business Impact (1–5): revenue loss, regulatory exposure, data integrity, customer trust, contractual SLA.
- Failure Likelihood (1–5): change frequency, integration surface, dependency count, historical defect density, architectural complexity.
- Detectability modifier (×0.5 to ×2): how quickly would we know? A silent failure is worse than a loud one.
Risk Score = Impact × Likelihood × Detectability Modifier| Capability | Impact | Likelihood | Detectability | Score | Tier |
|---|---|---|---|---|---|
| Payment capture & settlement | 5 | 4 | ×1.5 (partially silent) | 30.0 | Tier 1 |
| Authentication & session | 5 | 3 | ×1.0 | 15.0 | Tier 1 |
| Tenant data isolation | 5 | 2 | ×2.0 (silent) | 20.0 | Tier 1 |
| Subscription renewal / dunning | 5 | 3 | ×2.0 (silent) | 30.0 | Tier 1 |
| User onboarding (self-serve) | 4 | 4 | ×0.5 (loud) | 8.0 | Tier 2 |
| Compliance audit logging | 4 | 2 | ×2.0 (silent) | 16.0 | Tier 1 |
| Data export | 3 | 3 | ×1.0 | 9.0 | Tier 2 |
| Notifications | 2 | 4 | ×1.5 | 12.0 | Tier 2 |
| In-app help content | 1 | 3 | ×0.5 | 1.5 | Tier 3 |
| Admin theme settings | 1 | 2 | ×0.5 | 1.0 | Tier 3 |
4.3 The detectability multiplier
This is the term most organizations omit, and it is the one that explains their worst incidents.
A checkout page that returns a 500 error is catastrophic for ninety seconds and then fixed, because everyone knows instantly. A renewal job that silently skips accounts with a specific proration state is catastrophic for a fiscal quarter, because nothing alerts and the loss appears in finance reconciliation weeks later.
Silent failure modes deserve disproportionate validation investment, because production will not catch what production cannot see. This is also the bridge between quality engineering and observability: if a risk cannot be detected in production, its validation burden shifts entirely to pre-production, which is expensive. Investing in detectability is often cheaper than investing in the tests that would otherwise be required.
4.4 Tiering and effort allocation
| Tier | Score range | Validation mandate | Typical effort share |
|---|---|---|---|
| Tier 1 — Critical | ≥ 15 | Full pyramid L1–L7. Failure coverage mandatory. Production synthetic monitoring mandatory. Changes require risk review. | 50–60% |
| Tier 2 — Significant | 6–14 | L1–L4 required. Selected failure modes. Production alerting on key indicators. | 25–35% |
| Tier 3 — Standard | < 6 | L1–L2. Exploratory testing on change. No dedicated automation investment. | 10–15% |
The uncomfortable corollary, stated explicitly because most organizations refuse to say it out loud:
Low-risk modules do not deserve equal testing effort. Deliberately under-testing them is a correct engineering decision, not negligence.
An admin theme picker with 40% coverage and no automation is not a quality gap. It is capital correctly allocated elsewhere. The failure to make this decision explicitly is why Tier 1 capabilities remain under-validated: the effort was spent achieving uniformity.
4.5 Keeping the matrix alive
A risk register that is written once and filed is worthless. Three mechanisms keep it current:
- Change-triggered re-scoring. Any architectural change, new third-party dependency, or new regulatory obligation triggers re-scoring of affected capabilities.
- Incident-triggered re-scoring. Every production incident updates the likelihood score of its capability. Reality beats estimates.
- Quarterly review with product and finance. Impact scores are business judgments and engineering should not make them alone. Finance in particular will identify revenue-recognizing paths that engineering under-rates.
4.6 Practical recommendation for Chapter 4
Build the first matrix in a two-hour workshop with engineering, product, support, and finance. Limit it to 15–25 capabilities. Resist precision — the difference between a 4 and a 5 is irrelevant compared to the difference between a scored and an unscored capability. The output is a ranked list, and the ranked list is the testing strategy.
Chapter 5 — User Journey Coverage
5.1 Customers do not use functions
No customer has ever invoked calculateProratedAmount(). No customer has ever consumed POST /v2/subscriptions in isolation. Customers execute journeys — multi-step, multi-session, multi-system sequences with real intent behind them.
Customers never experience your code coverage — they experience your software.
A journey succeeds only if every step succeeds and every transition between steps preserves state correctly. Component testing validates the steps. Almost nothing in a typical test estate validates the transitions.
5.2 The anatomy of a journey
  Registration → Verification → Configuration → Purchase → Payment
        ↓             ↓              ↓             ↓          ↓
   Confirmation ← Provisioning ← Entitlement ← Receipt ← Settlement
        ↓
     First value  →  Renewal  →  Expansion  →  Support
Each arrow is a seam. Seams are where the following live:
- State handoffs between services
- Asynchronous processing and eventual consistency windows
- Identity and entitlement propagation
- Idempotency and duplicate-submission handling
- Email/SMS/webhook delivery dependencies
- Session and token lifetime boundaries
- Cross-region data replication lag
Component tests validate boxes. Incidents happen at arrows.
5.3 Why isolated API testing misses journey failures
Consider a genuinely typical failure:
POST /signup— passes all tests. Creates user withstatus=pending.- Verification email — service tested, template tested, delivery mocked.
POST /organizations— passes all tests. Creates org, assigns owner.POST /subscriptions— passes all tests. Creates subscription.- Entitlement service — passes all tests. Grants features based on subscription.
Every endpoint is at 96% coverage. Every test is green.
In production, the entitlement service reads the user record from a read replica. For users created less than 400ms earlier, the replica returns status=pending, and the entitlement grant silently applies the free-tier feature set. The customer pays for Enterprise and receives Starter. No error is logged. No test could have caught it, because no test ever executed steps 1 and 5 against the same infrastructure within the same time window.
This class of defect — composition failure under real timing — is invisible to every level below L4 of the pyramid, and it is disproportionately represented in serious incidents.
5.4 The Customer Journey Framework
For each Tier 1 and Tier 2 capability, define journeys with five attributes:
| Attribute | Definition | Example |
|---|---|---|
| Actor | Who, with what permissions and account state | Enterprise admin, SSO-federated, existing org |
| Intent | The business outcome sought | Add 200 seats mid-cycle |
| Path | Ordered steps across all systems | UI → billing → provisioning → identity → notification |
| Success criterion | Observable proof of outcome | 200 seats usable; correct prorated invoice; audit log entry |
| Degradation tolerance | What may fail without failing the journey | Notification may be delayed 5 min; analytics may lag |
The fifth attribute matters more than it appears. Without an explicit degradation tolerance, teams build journey tests that fail on irrelevant conditions, the tests become flaky, and the flaky tests get deleted — which is how organizations lose exactly the validation they most need.
5.5 Journey validation without a brittle E2E suite
The standard objection is correct: broad end-to-end suites are slow, flaky, and expensive. The answer is not to abandon journey coverage but to change its implementation:
| Technique | Where it runs | What it validates | Cost |
|---|---|---|---|
| Consumer-driven contract tests | CI, per service | Seam compatibility without full-stack execution | Low |
| Journey-scoped integration tests | CI, on merge | 3–6 step segments across real service instances | Medium |
| Full journey tests (5–15 total) | Pre-prod, on release | Complete Tier 1 journeys, realistic data | High |
| Synthetic production journeys | Production, continuous | Real environment, real config, real dependencies | Medium |
| Funnel telemetry with alerting | Production, continuous | Actual customer completion rates | Low after setup |
The strategic point: a handful of full journey tests plus continuous synthetic production journeys outperforms a large brittle E2E suite on every axis — reliability, signal quality, maintenance cost, and time to detection.
A thousand automated tests cannot compensate for one unvalidated business workflow.
5.6 Journey coverage as a metric
Journey Coverage = (Tier 1+2 journeys validated end-to-end)
                   ─────────────────────────────────────────
                   (Total Tier 1+2 journeys defined)
Reported alongside a second figure that prevents gaming:
Journey Depth = Average number of pyramid levels at which each
                journey is validated (L3 minimum to count at all)
Ten journeys at 100% coverage but validated only in mocked integration environments is a weaker position than six journeys validated through production synthetics — and this metric pair makes that visible.
Chapter 6 — Failure Coverage
6.1 The asymmetry nobody plans for
Examine any mature test suite and classify its assertions. The result is remarkably consistent across organizations and industries:
| Assertion category | Typical share |
|---|---|
| Expected behavior with valid input ("happy path") | 70–80% |
| Input validation and rejection | 12–20% |
| Business rule edge cases | 5–10% |
| Dependency failure behavior | 1–5% |
| Infrastructure degradation behavior | < 1% |
| Partial-failure and recovery behavior | ≈ 0% |
Now examine the incident record. The distribution of causes is close to inverted. Systems rarely fail because a function computed the wrong sum. They fail because something they depended on became slow, returned an unexpected shape, timed out, returned a duplicate, ran out of connections, or came back mid-transaction.
We validate what we control and neglect what fails.
6.2 The Failure Coverage Model
Failure coverage is the systematic validation of system behavior when things go wrong. It is organized in five classes:
┌──────────────────────────────────────────────────────────┐
│ CLASS 1 — DEPENDENCY FAILURE                             │
│ Timeouts · 5xx · 429 · malformed payloads · TLS errors   │
│ · slow responses · connection resets · DNS failure       │
├──────────────────────────────────────────────────────────┤
│ CLASS 2 — PARTIAL FAILURE                                │
│ One of N replicas down · one region degraded · half a    │
│ batch processed · write succeeded, event not published   │
├──────────────────────────────────────────────────────────┤
│ CLASS 3 — RESOURCE EXHAUSTION                            │
│ Connection pool · memory · disk · file handles · thread  │
│ pool · rate limit budget · queue depth                   │
├──────────────────────────────────────────────────────────┤
│ CLASS 4 — DATA ANOMALY                                   │
│ Null in non-null field · encoding · unexpected volume ·  │
│ duplicate events · out-of-order events · clock skew      │
├──────────────────────────────────────────────────────────┤
│ CLASS 5 — RECOVERY BEHAVIOR                              │
│ Retry storms · idempotency under retry · circuit breaker │
│ transitions · backlog drain · reconciliation after       │
│ partial failure · cache stampede on restart              │
└──────────────────────────────────────────────────────────┘
Class 5 is the one that separates organizations that survive incidents from those that amplify them. Most serious outages are not caused by the initial failure; they are caused by the system's response to the failure — retries multiplying load, circuit breakers flapping, a cold cache stampeding a database that was already struggling.
6.3 Writing a failure test that means something
A failure test must assert on a defined behavior, which means the behavior must first be specified. This is where failure coverage exposes a deeper gap: for most dependencies, nobody has decided what should happen.
For each Tier 1 dependency, answer four questions and turn the answers into tests:
- Detect: How and how quickly do we know it failed?
- Degrade: What is the intended reduced-functionality behavior? (Fail closed? Fail open? Queue? Serve stale?)
- Communicate: What does the customer see, and what does the operator see?
- Recover: What happens when the dependency returns — automatically, and with what data-consistency guarantee?
| Dependency | Detect | Degrade | Communicate | Recover |
|---|---|---|---|---|
| Payment gateway | 2s timeout, 3 failures/10s → open circuit | Queue authorization, do not double-charge | "Processing — we'll email confirmation" | Drain queue, idempotency key enforced |
| Identity provider | 1s timeout | Existing sessions valid; new logins blocked | Explicit SSO status message | Resume; no session invalidation |
| Email service | Async, delivery webhook | Persist and retry with backoff up to 24h | In-app notification as fallback | Dedupe on retry drain |
| Analytics pipeline | Async | Drop silently | Nothing (correctly) | No backfill required |
That last row matters: deciding a dependency may fail silently is a legitimate, documented engineering decision. Failure coverage is not "handle everything"; it is "have decided about everything that matters."
6.4 Techniques by environment
| Technique | Environment | Failure classes covered |
|---|---|---|
| Fault-injecting test doubles / mock servers with error scripting | CI | 1, 4 |
| Contract tests including error responses | CI | 1 |
| Toxiproxy-style network fault injection | Integration | 1, 2 |
| Load tests driven past capacity deliberately | Pre-prod | 3, 5 |
| Chaos experiments (instance kill, latency, region isolation) | Pre-prod, then prod | 2, 3, 5 |
| Game days with unannounced scenarios | Prod (controlled) | All, plus human response |
| Production failure drills on dependency sandboxes | Prod | 1, 5 |
6.5 Failure Scenario Coverage as a KPI
Failure Scenario Coverage =
    (Specified failure modes with a passing validation)
    ─────────────────────────────────────────────────── × 100
    (Specified failure modes for Tier 1+2 capabilities)
The denominator is the honest part. Most organizations discover at first measurement that the denominator does not exist — no one has enumerated the failure modes. Producing the denominator is more valuable than the eventual percentage.
6.6 Practical recommendation for Chapter 6
Start with the top five dependencies by blast radius. For each, run the four-question specification, write one test per class where the class applies, and schedule one game day per quarter. This is roughly two engineer-weeks of work and it typically eliminates a category of repeat incidents that no amount of unit testing would have touched.
Chapter 7 — Production Coverage
7.1 The environment gap
Pre-production environments are models of production. Like all models, they are wrong in specific, knowable ways:
| Dimension | Test environment | Production |
|---|---|---|
| Configuration | Simplified, often defaulted | Per-tenant, per-region, feature-flagged, drifted |
| Data volume | Thousands of rows | Hundreds of millions; skewed distributions |
| Data shape | Synthetic, well-formed | Legacy records, partial migrations, encoding artifacts |
| Traffic | Scripted, uniform | Bursty, correlated, adversarial |
| Concurrency | Low | High, with real contention |
| Dependencies | Mocked or sandboxed | Real, with real latency and real incidents |
| Infrastructure | Single region, small instances | Multi-region, autoscaling, noisy neighbors |
| Users | Test accounts | Humans doing unpredictable things |
| Time | Fresh state | Years of accumulated state |
Some defects are only reachable through the differences in that table. No amount of pre-production investment closes the gap, because closing it would mean building a second production — at which point you have doubled cost and still lack real users.
The conclusion is not that pre-production testing is futile. It is that a validation strategy which ends at deployment is structurally incomplete.
7.2 The Production Coverage Framework
Production coverage has four pillars:
┌───────────────┬───────────────┬───────────────┬───────────────┐
│  OBSERVE      │  VERIFY       │  EXPERIMENT   │  GUARD        │
├───────────────┼───────────────┼───────────────┼───────────────┤
│ Logs, metrics │ Synthetic     │ Canary        │ SLOs & error  │
│ traces, events│ journeys      │ releases      │ budgets       │
│               │               │               │               │
│ Business      │ Continuous    │ Feature flags │ Automated     │
│ event streams │ contract      │ A/B tests     │ rollback      │
│               │ verification  │               │               │
│ Funnel        │ Data quality  │ Shadow        │ Circuit       │
│ telemetry     │ assertions    │ traffic       │ breakers      │
└───────────────┴───────────────┴───────────────┴───────────────┘
Observe — can you see the behavior at all? Most production "coverage" gaps are actually observability gaps: the system misbehaved and emitted nothing.
Verify — active, continuous assertion that critical journeys work right now. Synthetic journeys running every five minutes against production, exercising real payment sandboxes, real identity providers, real provisioning.
Experiment — controlled exposure. Canary deployments with automated statistical comparison of error rates, latency percentiles, and business metrics between canary and baseline.
Guard — automated containment. SLO-based alerting, error budgets that gate releases, automated rollback triggered by canary analysis.
7.3 Continuous validation, not continuous monitoring
The distinction is important and frequently blurred.
- Monitoring is passive. It tells you when something that happened was bad. It requires a customer to have already triggered the path.
- Continuous validation is active. It executes critical journeys on a schedule whether or not customers do, so that failure in a low-traffic-but-high-value path is detected in minutes rather than at month-end.
Enterprise systems are full of high-value, low-frequency paths: annual renewals, quarterly compliance exports, month-end invoicing, SSO certificate rotation, disaster-recovery failover. These are exactly the paths where monitoring provides no coverage — nothing is happening to monitor — and exactly the paths where failure is most expensive.
7.4 Data quality assertions
An underused form of production coverage: continuous assertions over production data state.
| Assertion | Detects |
|---|---|
No subscription has status=active with expires_at < now() |
Renewal job failures |
| Every settled payment has a matching ledger entry | Reconciliation drift |
| No user has entitlements exceeding their plan | Provisioning race conditions |
| Every tenant's row count in shared tables matches tenant scope | Isolation breaches |
| No audit log gap exceeding N minutes during business hours | Compliance logging failure |
These run as scheduled queries with alerting. They detect the silent failures from Chapter 4's detectability modifier — precisely the class that produces quarter-long, finance-discovered incidents. In many organizations this is the highest return-on-effort quality investment available, and it does not involve writing a single test.
7.5 Production Confidence Score
Production Confidence Score (0–100) = weighted sum of:
   Synthetic journey coverage of Tier 1 journeys        25%
   Observability coverage of Tier 1 capabilities        20%
   Percentage of releases using canary + auto-rollback  15%
   Data quality assertion coverage of critical invariants 15%
   SLO definition + error budget adherence              15%
   Mean time to detect (inverse-scaled)                 10%
Reported per capability, not globally. A single organization-wide number recreates the original sin of the coverage percentage.
7.6 The prerequisite: safety
Production coverage requires the ability to fail safely: feature flags, progressive rollout, fast rollback, tenant-scoped exposure, and a culture that does not punish the discovery of defects in production. Without those, teams will resist production validation — correctly, because in an unsafe system it is genuinely dangerous.
Invest in deployment safety before investing in production validation. The order is not negotiable.
Chapter 8 — Risk-Based Testing
8.1 From risk model to test allocation
Chapter 4 produced a ranked risk model. Risk-based testing is the discipline of converting that ranking into a concrete allocation of engineering effort, review depth, and release gating.
The core instrument is the Risk Priority Matrix, which maps likelihood against business impact and assigns a validation regime to each quadrant.
                        BUSINESS IMPACT
              Low                            High
        ┌──────────────────────┬──────────────────────────┐
   High │  Q2: STABILIZE       │  Q1: FORTIFY             │
        │  Frequent failures,  │  Frequent failures,      │
        │  low consequence     │  severe consequence      │
   L    │                      │                          │
   I    │  Automate cheaply.   │  Full pyramid L1–L7.     │
   K    │  Fix root causes to  │  Failure coverage.       │
   E    │  reduce noise.       │  Production synthetics.  │
   L    │  Do not gold-plate.  │  Release gating.         │
   I    ├──────────────────────┼──────────────────────────┤
   H    │  Q4: ACCEPT          │  Q3: DETECT              │
   O    │  Rare, low impact    │  Rare, severe impact     │
   O    │                      │                          │
   D    │  Exploratory only.   │  Cannot afford to wait   │
        │  No automation       │  for it. Invest in       │
   Low  │  investment.         │  detection, failure      │
        │  Monitor and move    │  drills, and recovery    │
        │  on.                 │  rehearsal, not volume.  │
        └──────────────────────┴──────────────────────────┘
8.2 Quadrant strategies in detail
Q1 — Fortify (high likelihood × high impact). Payment processing under change, authentication during an identity migration, multi-tenant data paths in a new sharding scheme. These get everything: full pyramid depth, mandatory failure coverage, contract tests with every dependency, canary releases with automated rollback, and a required risk review on change. This quadrant justifies dedicated quality engineering headcount.
Q2 — Stabilize (high likelihood × low impact). Typically flaky peripheral features, cosmetic rendering, non-critical integrations. The correct response is not more tests. It is root-cause elimination — because high failure frequency in low-impact areas consumes attention and desensitizes teams to alerts, which then degrades their response to Q1 failures. Reduce noise, then stop investing.
Q3 — Detect (low likelihood × high impact). Disaster recovery, region failover, data-loss scenarios, security boundary failures, regulatory reporting. Volume testing is useless here because the events are rare by definition. Invest instead in: detection instrumentation, rehearsed recovery procedures, periodic drills, and data-integrity assertions. The KPI is time to detect and recover, not test count.
Q4 — Accept (low likelihood × low impact). State the acceptance explicitly and move the budget to Q1. Undocumented acceptance is how organizations end up with 40% of their suite validating settings pages.
8.3 Scoring likelihood with evidence rather than intuition
Likelihood estimates degrade into opinion unless anchored to observable signals:
| Signal | Weight | Source |
|---|---|---|
| Change frequency (commits/quarter) | High | VCS |
| Number of contributors | Medium | VCS |
| Historical defect density | High | Issue tracker, linked to modules |
| Cyclomatic / architectural complexity | Medium | Static analysis |
| Number of external dependencies | High | Dependency graph |
| Age since last significant refactor | Low | VCS |
| Incident history in the last 12 months | Very high | Incident record |
A simple weighted model computed monthly from these signals produces a likelihood score that updates itself and survives the departure of the engineer who originally guessed.
8.4 The Coverage Decision Matrix
Once a capability's risk tier is known, decide how to validate each behavior rather than defaulting to automation.
| Behavior characteristic | Automate in CI | Automate in pre-prod | Production validation | Exploratory / manual |
|---|---|---|---|---|
| Deterministic, fast, stable | ✔ Primary | — | — | — |
| Cross-service, stateful | ◐ Contract only | ✔ Primary | ✔ Synthetic | — |
| Requires real third party | ✖ | ◐ Sandbox | ✔ Primary | ◐ |
| Rare, high impact, expensive to simulate | ✖ | ◐ Drill | ✔ Detection + drill | ✔ Game day |
| Subjective (UX, content, accessibility perception) | ✖ | ◐ Automated checks only | — | ✔ Primary |
| Novel feature, unclear requirements | ✖ | ✖ | ◐ Canary | ✔ Primary |
| Probabilistic output (see Ch. 10) | ◐ Eval harness | ✔ Eval suite | ✔ Online eval | ✔ Review sampling |
The row worth pausing on is "novel feature, unclear requirements." Automating tests for a feature whose behavior is not yet settled produces tests that encode a guess, then makes changing the guess expensive. Exploratory testing is the correct primary technique for genuinely new behavior, and automation should follow stabilization rather than precede it.
8.5 Risk-based release gating
Not every release requires the same evidence. Gate proportionally:
| Change scope | Required evidence |
|---|---|
| Tier 3 capability, isolated | CI green |
| Tier 2 capability | CI green + journey segment tests + canary 10% for 30 min |
| Tier 1 capability | Full above + failure suite + synthetic journey verification post-deploy + canary 5% with automated statistical rollback |
| Tier 1 with schema or contract change | Full above + backward-compatibility verification + rollback rehearsal + data assertion verification |
This is the mechanism by which the risk model changes engineer behavior daily. A risk model that does not touch the release process will be ignored within two quarters.
Chapter 9 — False Confidence
9.1 Confidence is a belief, not a measurement
Every engineering organization operates on a shared belief about how safe it is to ship. That belief is formed by signals: pipeline color, coverage percentage, suite size, recent incident memory. When those signals are poorly correlated with actual safety, the organization develops false confidence — and false confidence is more dangerous than acknowledged ignorance, because it suppresses caution precisely where caution is needed.
9.2 The mechanisms that manufacture it
Green pipelines. A pipeline reports the status of the checks it contains. It cannot report the status of the checks it does not contain. Yet the visual language — a green checkmark — communicates completeness. Teams read "all checks passed" as "everything is fine."
Coverage thresholds. A gate at 80% converts coverage from a diagnostic into a compliance target. Engineers meet it. The tests written to meet it are, by selection, the cheapest possible tests that touch lines. The organization then reports its compliance figure as evidence of quality.
Suite size as a proxy for diligence. "We have 20,000 tests" is offered in incident reviews as evidence that the team was rigorous. It is evidence that the team was busy.
Absence of recent incidents. Quiet periods are read as safety. Often they reflect low change volume, seasonal traffic, or luck. Confidence built during quiet periods is spent during busy ones.
Automation ownership diffusion. When a suite is large enough, no individual knows what it covers. Everyone assumes someone else validated the critical path. This is why suite size and actual confidence eventually become inversely related past a certain scale.
Flaky test normalization. Once a team is habituated to reruns, a genuine failure is indistinguishable from noise. The suite still reports green — after three attempts — and the organization has lost its signal without losing its confidence.
9.3 The confidence–coverage divergence
   Confidence
       ▲
       │                    ┌─────────── Reported confidence
       │              ┌─────┘            (tracks coverage %)
       │        ┌─────┘
       │   ┌────┘                        ← DIVERGENCE ZONE
       │───┘        ╲
       │             ╲___________         Actual confidence
       │                        ╲___      (tracks risk coverage,
       │                            ╲___   plateaus, then declines
       │                                ╲  as maintenance burden
       │                                 ╲ crowds out real work)
       └────────────────────────────────────────► Test count
Actual confidence declines at high test counts for a concrete reason: maintenance cost. A 20,000-test suite consumes engineering hours in updates, triage, and flake investigation. Those hours come from the same budget that would fund workflow and failure validation. Past a threshold, adding tests reduces quality by consuming the capacity needed to validate risk.
9.4 Diagnosing false confidence
Six questions, each answerable with data you already have:
- What percentage of last year's incidents occurred in code with >80% coverage? (If above 60%, coverage is not your control.)
- What is your suite's flake rate, and how many reruns does a typical merge require?
- How many tests have failed and revealed a genuine defect in the last 90 days? (Divide by suite size. The ratio is usually shocking.)
- For your top five business workflows, name the specific test that validates each end to end. (If you cannot name it in ten seconds, it does not exist.)
- When did a test last catch a defect in a Tier 1 capability before a human did?
- If you deleted 30% of the suite at random, how would you know?
Question 3 is the most revealing. Suites frequently contain thousands of tests that have never failed except during refactors — which means they detect change, not defect. They are a change-detection system marketed internally as a quality system.
9.5 Replacing false signals with honest ones
| False signal | Honest replacement |
|---|---|
| Coverage percentage | Risk-tier validation depth grid (Ch. 3.5) |
| "All tests passing" | "All Tier 1 journeys verified in production within last 15 min" |
| Suite size | Defect detection rate per validation |
| Green pipeline | Release confidence statement listing what was and was not validated |
| Zero incidents this month | Error budget remaining; MTTD trend |
| Automation percentage | Automation effectiveness (Ch. 11) |
9.6 The cultural component
False confidence is sustained socially. It persists because the coverage number is reported upward, upward reporting rewards improvement, and honest reporting of "we do not validate our renewal workflow" reads as an admission of failure rather than as valuable information.
Leaders break this by explicitly rewarding the discovery of validation gaps. The first team that reports a Tier 1 capability as unvalidated should be publicly credited, not questioned. Otherwise the gaps remain, and they remain invisible until a customer finds them.
Chapter 10 — AI Makes Coverage More Difficult
10.1 A category change, not a degree change
Traditional software is deterministic: same input, same code, same output. Every testing technique in the previous nine chapters rests on that property, at least implicitly.
LLM-based systems break it. The same prompt produces different outputs across runs, across model versions, across temperature settings, and across subtle changes in retrieved context. Assertion-based testing — expect(output).toEqual(x) — becomes not merely brittle but conceptually inapplicable.
This is not "testing is harder now." It is that the unit of validation changes from output correctness to behavioral distribution.
10.2 What changes, concretely
| Property | Traditional system | LLM-based system |
|---|---|---|
| Output for fixed input | Identical | Varies |
| Correctness | Binary | Graded, often subjective |
| Failure mode | Exception, wrong value | Plausible but wrong; unsafe; off-policy; verbose |
| Regression source | Code change | Code change, prompt change, model version, retrieval corpus change, embedding model change |
| Coverage meaning | Lines executed | Behavior space sampled |
| Test oracle | Expected value | Rubric, reference set, model-as-judge, human review |
| Blast radius of a change | Localized | Global — one prompt edit alters all behavior |
That last row is the operational shock for engineering leaders. A one-word change in a system prompt is a global change to every capability the model serves, with no compiler, no type system, and no static analysis to constrain it.
10.3 The additional surfaces in AI systems
Prompt variation. Users express the same intent in unbounded ways. Coverage means sampling the intent space, not the string space: paraphrases, languages, spelling errors, adversarial phrasings, mixed intents, incomplete requests.
Retrieval (RAG). Failure often originates upstream of the model. Retrieval coverage requires validating: recall on known-answerable queries, behavior when retrieval returns nothing, behavior when retrieval returns contradictory documents, behavior when retrieval returns stale documents, and chunking artifacts that split critical context.
Context drift. In long sessions, earlier instructions are diluted or overridden. Coverage requires multi-turn scenarios of realistic length, not single-turn probes.
Memory and state. Systems that persist user facts need validation of write correctness, retrieval relevance, staleness handling, contradiction resolution, and deletion.
Agents and tool use. Agentic systems compose actions. This resurrects every problem from Chapter 5 — journey coverage — with the added difficulty that the agent chooses the path. Validation must cover: correct tool selection, parameter construction, failure handling when a tool errors, loop termination, and the consequences of side-effecting actions taken in error.
Guardrails. Safety, policy, and scope constraints require adversarial coverage: jailbreak attempts, prompt injection through retrieved documents, out-of-scope requests, and requests that are in-scope but should be refused for policy reasons.
10.4 Behavior coverage instead of deterministic coverage
The replacement framework has four components:
┌────────────────────────────────────────────────────────────┐
│ 1. EVALUATION SETS                                         │
│    Curated cases per capability, with rubrics.             │
│    Grown continuously from production failures.            │
├────────────────────────────────────────────────────────────┤
│ 2. SCORING                                                 │
│    Deterministic checks (format, schema, citation present, │
│    tool called) + rubric grading (model-as-judge,          │
│    calibrated against human labels) + human review sample. │
├────────────────────────────────────────────────────────────┤
│ 3. THRESHOLDS, NOT ASSERTIONS                              │
│    Ship criteria are distributional: pass rate ≥ X%,       │
│    unsafe rate ≤ Y%, no regression > Z% on any slice.      │
├────────────────────────────────────────────────────────────┤
│ 4. ONLINE EVALUATION                                       │
│    Production sampling, user feedback signals, task        │
│    completion telemetry, automated grading of live traffic.│
└────────────────────────────────────────────────────────────┘
10.5 AI coverage vs traditional coverage
| Dimension | Traditional coverage | AI behavior coverage |
|---|---|---|
| Primary artifact | Test suite | Evaluation set + rubrics |
| Unit | Test case | Scenario with grading criteria |
| Pass condition | All assertions true | Distribution meets thresholds |
| Regression detection | Diff in output | Diff in score distribution across slices |
| Coverage measure | Lines / branches | Intent classes, slices, adversarial classes covered |
| Environment sensitivity | Config, data | Config, data, model version, prompt, corpus, temperature |
| Failure discovery | Deterministic reproduction | Statistical; requires repeated sampling |
| Production role | Optional | Mandatory — offline evals cannot cover intent space |
10.6 The slice discipline
The most common AI evaluation failure is aggregate reporting. A system at 91% overall pass rate can be at 34% for a specific customer segment, language, or document type — and aggregate reporting hides it exactly as a global coverage percentage hides an unvalidated workflow.
Define slices explicitly: user segment, language, query intent class, document domain, session length, and adversarial category. Report per slice; gate on the worst slice, not the mean. This is the same lesson as Chapter 3, arriving in new clothes.
10.7 Practical recommendation for Chapter 10
Treat the evaluation set as a first-class production asset with an owner, a review cadence, and version control. Every production failure adds a case. Every prompt change runs the full set. Every model version upgrade is treated as a major dependency upgrade with a full re-evaluation and a canary rollout — because that is exactly what it is.
Chapter 11 — Measuring Quality Coverage
11.1 Design principles for quality metrics
Before defining KPIs, three constraints must hold, or the new metrics will decay into the old ones:
- Every metric must be resistant to volume gaming. If a metric improves when you write a trivial test, it is a bad metric.
- Every metric must be reported per risk tier or per capability. Global averages destroy the signal.
- Every metric must connect to a decision. If no one would act differently at 60 than at 80, do not measure it.
11.2 The ten quality coverage KPIs
1. Quality Coverage Score (QCS)
A composite, computed per capability, expressing validation depth weighted by risk.
QCS(capability) = Σ (level_weight × level_validated) / Σ level_weight

  Level weights:  L1=1  L2=2  L3=4  L4=8  L5=8  L6=10  L7=10
Weighted so that shallow levels cannot compensate for missing depth. A capability validated fully at L1–L3 but absent at L4–L7 scores 7/43 ≈ 16% — which is an honest description of its state.
2. Business Workflow Coverage (BWC)
BWC = (Tier 1+2 workflows validated end-to-end) / (Total Tier 1+2 workflows)Reported with the accompanying Workflow Depth figure (average pyramid level of validation). Target: 100% of Tier 1 at L4 minimum, L6 preferred.
3. Risk Validation Index (RVI)
RVI = Σ (risk_score of validated risks) / Σ (risk_score of all identified risks)Risk-weighted rather than count-weighted, so validating one Tier 1 risk moves the index more than validating twelve Tier 3 risks. This is the single number that best replaces "coverage %" in executive reporting.
4. Customer Journey Coverage (CJC)
CJC = (Journeys with continuous production verification) / (Defined critical journeys)Deliberately restricted to production verification. Pre-production journey tests count toward BWC, not CJC.
5. Production Confidence Score (PCS)
The weighted composite defined in Chapter 7.5, reported per capability.
6. Failure Scenario Coverage (FSC)
FSC = (Specified failure modes with passing validation) / (Specified failure modes)Accompanied by Failure Specification Completeness: the proportion of Tier 1 dependencies that have a documented detect/degrade/communicate/recover specification at all.
7. Observability Coverage (OC)
OC = (Tier 1+2 capabilities where a synthetic failure is detected
      by existing instrumentation within target MTTD)
     ─────────────────────────────────────────────────────────────
     (Total Tier 1+2 capabilities)
Measured empirically by injecting failures and observing whether alerts fire — not by counting dashboards. Most organizations score below 40% on first measurement.
8. Automation Effectiveness (AE)
AE = (Tests that detected a genuine defect in last 180 days)
     ───────────────────────────────────────────────────────
     (Total tests)

Reported alongside:
Cost per detection = (maintenance hours + execution cost) / defects detected
This metric legitimizes test deletion. A test with zero detections and recurring maintenance cost has negative value, and AE makes that measurable rather than debatable.
9. Regression Stability (RS)
RS = 1 − (flaky failures / total failures)

Plus: Mean reruns per successful merge
      Percentage of suite quarantined
Below 0.95, the suite's signal is compromised and every other metric in this list is degraded by it. Stability is a prerequisite metric, not a peer metric.
10. Engineering Confidence Index (ECI)
A deliberately hybrid measure combining objective and subjective inputs:
ECI = 0.5 × (normalized RVI + PCS + BWC composite)
    + 0.3 × (inverse of escaped-defect rate, normalized)
    + 0.2 × (surveyed team confidence: "How confident are you that
             a serious defect in Tier 1 would be caught before a
             customer notices?" — 1–5 scale, monthly)
The survey component is not decoration. Engineers usually know where the gaps are long before metrics reveal them. A divergence between measured indices and surveyed confidence is itself a high-value signal: if the numbers are good and the team is nervous, the team is usually right.
11.3 Metric summary table
| KPI | Answers | Gaming resistance | Reporting frequency | Owner |
|---|---|---|---|---|
| QCS | How deeply is this validated? | High | Monthly | Eng manager |
| BWC | Do our journeys work? | High | Per release | QA director |
| RVI | Are our real risks controlled? | Very high | Monthly | VP Eng |
| CJC | Do journeys work now? | Very high | Continuous | SRE + QA |
| PCS | Can we trust production? | High | Weekly | SRE |
| FSC | Do we survive failure? | High | Quarterly | Architect |
| OC | Would we notice? | Very high | Quarterly | SRE |
| AE | Is our suite earning its cost? | High | Quarterly | Eng manager |
| RS | Is our signal trustworthy? | Medium | Weekly | Platform/CI team |
| ECI | Overall honest confidence | Medium | Monthly | CTO |
11.4 What to stop reporting
Removing metrics is as important as adding them. Retire from executive reporting:
- Global code coverage percentage (keep it as a local diagnostic only)
- Total test count
- Automation percentage without effectiveness context
- Tests executed per pipeline run
- Defect counts without severity and journey attribution
- Pass rate of the test suite (it should be ~100%; reporting it is theater)
Chapter 12 — The Economics of Better Coverage
12.1 Tests are an asset with a carrying cost
Engineering organizations account for tests as if they were free after creation. They are not. Every test carries:
| Cost component | Description |
|---|---|
| Creation | Engineer hours to write and stabilize |
| Execution | CI compute, per run, forever |
| Latency | Delay to every developer, compounded by team size and merge frequency |
| Maintenance | Updates on every refactor of the code it touches |
| Triage | Investigation time per failure, including false failures |
| Cognitive load | Comprehension burden on every engineer who reads it |
| Change resistance | Tests coupled to implementation raise the cost of improving design |
The last is the least visible and often the largest. A suite that asserts on implementation details converts every refactor into a test-rewriting project, which discourages refactoring, which degrades architecture, which increases defect likelihood — a quality metric actively causing quality decline.
12.2 A worked comparison
Two portfolios, equal creation budget of 1,000 engineer-hours.
| Portfolio A: 4,000 low-value tests | Portfolio B: 300 high-value validations | |
|---|---|---|
| Composition | Unit tests on mappers, getters, validators; heavy mocking | 120 component tests on complex logic; 90 contract tests; 45 journey segment tests; 25 failure scenario tests; 12 production synthetic journeys; 8 data assertions |
| Creation cost | 1,000 hrs (0.25 hr each) | 1,000 hrs (3.3 hrs each) |
| CI execution time | 22 min | 9 min |
| Annual maintenance | ~900 hrs | ~180 hrs |
| Annual triage (at 2% flake) | ~320 hrs | ~40 hrs |
| Defects detected/year | 45 (mostly trivial) | 38 (mostly Tier 1) |
| Tier 1 defects detected | 3 | 29 |
| Escaped Tier 1 defects | 17 | 4 |
| Refactoring friction | High | Low |
| Year-2 total cost of ownership | ~2,220 hrs | ~1,220 hrs |
Portfolio B costs 45% less to own and prevents 76% more Tier 1 escapes. This is not a marginal optimization — it is a different economic regime.
12.3 The flakiness tax
Flaky tests are not an annoyance; they are a quantifiable tax on the entire organization.
Annual flake cost = merges/year × flake_rate × reruns × pipeline_minutes
                    × (developer_hourly_rate + CI_cost_per_minute)
                    + investigation_hours × developer_hourly_rate
                    + (incidents_caused_by_ignored_real_failures × incident_cost)
For a 120-engineer organization with 8,000 merges annually, a 3% flake rate, and a 20-minute pipeline, direct costs commonly land between $400k and $900k per year. The third term — genuine failures dismissed as flakes — is unbounded and has produced some of the most expensive incidents on record in the industry.
A 3% flake rate is not acceptable. It is an emergency with a friendly name.
12.4 Execution time as a productivity multiplier
Pipeline duration affects behavior nonlinearly:
| Pipeline duration | Developer behavior |
|---|---|
| < 5 min | Stays engaged; iterates in-flow |
| 5–15 min | Context switches; returns |
| 15–40 min | Batches changes into larger, riskier PRs |
| > 40 min | Avoids merging; long-lived branches; painful integration |
Larger, riskier PRs are themselves a quality problem. A slow suite therefore degrades quality through developer behavior even when every test in it is correct. This is the clearest case where reducing test count improves quality.
12.5 Reallocation, not reduction
The economic argument is frequently misheard as "spend less on quality." It is the opposite. The recommendation is:
Current state:   85% effort on L1–L2 · 10% on L3 · 5% on L4–L7
Target state:    40% effort on L1–L2 · 20% on L3 · 40% on L4–L7
Total investment stays flat or increases. What changes is where it lands. In practice the transition is funded by deleting low-value tests, which releases maintenance capacity — the migration pays for itself from within.
12.6 Making deletion safe and routine
Teams resist deleting tests because deletion feels like removing safety. Establish a defensible protocol:
- Identify candidates: zero genuine detections in 180 days + non-zero maintenance cost + covering Tier 3 capability or duplicating higher-level coverage.
- Verify the behavior is covered at a higher pyramid level, or that the capability is Tier 3.
- Delete in a dedicated PR with the rationale recorded.
- Track escaped defects by capability for two quarters afterward.
Organizations that run this protocol typically remove 20–35% of their suite with no measurable increase in escaped defects, and reinvest the recovered hours into workflow and failure coverage.
Chapter 13 — Enterprise Case Study
The following is a composite drawn from common enterprise patterns. Metrics are illustrative placeholders, structured to show the shape of a realistic transformation rather than to report a specific company's results.
13.1 Context
Organization: B2B SaaS platform, workforce management vertical. Scale: 2,400 enterprise customers, $180M ARR, 340 engineers across 28 teams. Architecture: 90+ microservices, multi-region, multi-tenant, heavy third-party integration (payroll providers, identity providers, HRIS systems).
13.2 The reported position
| Metric | Value |
|---|---|
| Code coverage | 95.2% |
| Automated tests | 41,000 |
| CI pass rate | 98.7% |
| Deployments per week | 190 |
| QA headcount | 46 |
| Annual quality spend | ~$9.4M |
By every metric the organization tracked, quality engineering was excellent.
13.3 The actual position
| Metric | Value |
|---|---|
| P1/P2 incidents per quarter | 31 |
| Incidents in code with >90% coverage | 79% |
| Escaped defects found by customers first | 64% |
| Mean time to detect (P1) | 47 min |
| Mean time to detect (silent-class defects) | 9.3 days |
| Enterprise renewals citing reliability concerns | 11 of 34 at-risk accounts |
| Pipeline duration | 38 min |
| Flake rate | 4.1% |
| Median PR size | 780 lines |
The pattern is the signature of the coverage illusion: excellent execution metrics, poor outcome metrics, and a large gap between them concentrated in silent failure modes.
13.4 Assessment findings
A six-week quality coverage assessment produced the pyramid grid:
Capability                    L1  L2  L3  L4  L5  L6  L7   Tier
────────────────────────────────────────────────────────────────
Payroll export (3rd party)    ✔   ✔   ◐   ✖   ✖   ✖   ✖    1
Enterprise SSO provisioning   ✔   ✔   ✖   ✖   ✖   ✖   ✖    1
Subscription & billing        ✔   ✔   ✔   ◐   ✖   ◐   ✖    1
Tenant data isolation         ✔   ✔   ◐   ✖   ✖   ✖   ✖    1
Time & attendance sync        ✔   ✔   ✔   ✖   ✖   ✖   ✖    1
Reporting & analytics         ✔   ✔   ✔   ◐   ✖   ✔   ◐    2
Notifications                 ✔   ✔   ◐   ✖   ✖   ◐   ✖    2
Admin configuration           ✔   ✔   ✔   ✔   ◐   ✔   ✖    3
Two findings dominated:
Finding 1 — Inverse risk allocation. Admin configuration, a Tier 3 capability, had the deepest validation in the organization (6,200 tests) because it was the easiest to test. The four highest-risk capabilities had no validation above L3.
Finding 2 — Mock divergence. 71% of integration tests used hand-written mocks of third-party systems. Sampling showed those mocks reproduced an average of 2.1 error responses per dependency, while the real dependencies documented 14–31 error conditions. Failure coverage of third-party integrations was effectively zero, and third-party integration was the single largest incident category.
Additional findings: 61% of the suite had produced no genuine defect detection in 18 months; observability coverage measured empirically at 34%; no capability had a documented degrade/recover specification.
13.5 The redesign
Phase 1 (weeks 1–8): Stabilize the signal. Quarantined and fixed or deleted flaky tests; parallelized the pipeline; deleted 11,400 zero-detection tests covering Tier 3 code. Pipeline dropped from 38 to 14 minutes; flake rate from 4.1% to 0.6%.
Phase 2 (weeks 6–16): Build the risk model. Ran the Business Risk Matrix workshop with engineering, product, support, and finance. Produced 23 scored capabilities and 31 defined critical journeys. Re-tiered the release gating process.
Phase 3 (weeks 10–28): Close failure coverage. Replaced hand-written third-party mocks with recorded-contract simulators reproducing the full documented error taxonomy. Wrote detect/degrade/communicate/recover specifications for the 14 Tier 1 dependencies, then tests for each. Introduced quarterly game days.
Phase 4 (weeks 16–34): Journey and production coverage. Built 12 full journey tests for Tier 1 journeys and 19 journey-segment suites. Deployed continuous synthetic journeys against production for all Tier 1 journeys at 5-minute intervals. Added 24 production data-quality assertions targeting silent failure classes.
Phase 5 (weeks 24–40): Measurement and governance. Replaced coverage-percentage reporting with RVI, BWC, CJC, FSC, and OC. Introduced risk-tiered release gating and canary-with-auto-rollback for Tier 1 changes.
13.6 Results after four quarters
| Metric | Before | After | Change |
|---|---|---|---|
| Code coverage | 95.2% | 81.4% | −13.8 pts |
| Automated tests | 41,000 | 24,600 | −40% |
| Risk Validation Index | (not measured) | 78% | — |
| Business Workflow Coverage | ~19% | 94% | +75 pts |
| Failure Scenario Coverage | ~4% | 71% | +67 pts |
| Observability Coverage | 34% | 88% | +54 pts |
| P1/P2 incidents per quarter | 31 | 9 | −71% |
| Customer-first defect discovery | 64% | 21% | −43 pts |
| MTTD (P1) | 47 min | 6 min | −87% |
| MTTD (silent class) | 9.3 days | 41 min | −99% |
| Pipeline duration | 38 min | 13 min | −66% |
| Flake rate | 4.1% | 0.4% | −90% |
| Median PR size | 780 lines | 240 lines | −69% |
| Annual quality spend | $9.4M | $9.1M | −3% |
13.7 The finding that mattered to the board
Code coverage fell by fourteen points while incidents fell by seventy-one percent, at flat cost.
That single sentence permanently ended coverage-percentage reporting at the organization, because it demonstrated empirically what no framework argument had managed to demonstrate: the metric and the outcome were not merely weakly correlated — over this period they moved in opposite directions.
13.8 What was hard
Honesty requires reporting the friction:
- Deleting 16,400 tests required executive air cover; three teams escalated.
- Two engineering managers interpreted the strategy as "leadership doesn't value testing" and had to be re-briefed personally.
- The third-party contract simulators required vendor engagement that took 11 weeks.
- Synthetic production journeys initially created noise until degradation tolerances were defined (Chapter 5.4).
- The first quarter showed increased detected defect counts, which looked like regression to observers who did not understand that detection had improved.
That final point is worth institutionalizing: quality transformations look worse before they look better, because you start finding what you were previously missing. Brief leadership on this in advance or the program will be cancelled in month four.
Chapter 14 — Common Coverage Mistakes
Twenty-four failure patterns, each with its detection signal and correction.
1. Optimizing for the percentage. Signal: PRs contain tests that call methods and assert nothing meaningful. Correction: remove hard coverage gates; replace with risk-tier validation requirements.
2. Uniform validation depth across risk tiers. Signal: the settings module and the payment module have similar test density. Correction: apply the Business Risk Matrix and deliberately under-test Tier 3.
3. Testing implementation instead of behavior. Signal: refactors break dozens of tests without any behavior change. Correction: assert on observable outcomes and contracts, not internal calls; delete tests that verify mock invocation counts.
4. Mocks that do not reproduce real failure taxonomies. Signal: mocks return success and one generic error. Correction: build simulators from real recorded traffic and the dependency's documented error set.
5. Validating components while ignoring seams. Signal: every service is well tested; incidents occur between services. Correction: consumer-driven contract tests plus journey-segment tests.
6. Happy path only. Signal: failure-class assertions under 5% of the suite. Correction: the detect/degrade/communicate/recover specification per Tier 1 dependency.
7. Duplicating validation across levels. Signal: the same business rule asserted in a unit test, an integration test, and an E2E test. Correction: assign each rule a canonical validation level; delete the rest.
8. Treating flakiness as background noise. Signal: "just rerun it" is standard practice. Correction: quarantine on first flake; fix or delete within one sprint; track flake rate as a release-blocking metric.
9. No production validation. Signal: the quality strategy document ends at "deploy." Correction: synthetic journeys, canary analysis, data assertions.
10. Observability assumed rather than verified. Signal: dashboards exist; no one has tested whether alerts fire. Correction: measure Observability Coverage empirically by injecting failures.
11. Ignoring silent failure modes. Signal: incidents discovered by finance, support escalation, or customers weeks later. Correction: apply the detectability multiplier; add data-quality assertions.
12. Automating unstable requirements. Signal: tests for new features rewritten three times in a quarter. Correction: exploratory testing first; automate after behavior stabilizes.
13. Eliminating exploratory testing entirely. Signal: "we're 100% automated." Correction: reserve capacity for structured exploratory sessions on new and high-risk areas; automation cannot discover unknown unknowns.
14. Journey tests that are actually UI tests. Signal: journey suite breaks on CSS selector changes. Correction: drive journeys through APIs and stable test identifiers; validate business outcomes, not DOM structure.
15. Test data that does not resemble production. Signal: every test user is test@example.com with a clean account. Correction: production-shaped anonymized data, including legacy records, long tenures, unusual encodings, and large volumes.
16. Ignoring data volume and scale behavior. Signal: export and reporting features fail for the largest customers only. Correction: scale-tier test data; run key paths against the p99 tenant size.
17. Coverage measured but never acted upon. Signal: the number appears in a monthly deck and changes nothing. Correction: every metric must map to a funding or gating decision (Ch. 11.1).
18. Quality owned exclusively by a QA function. Signal: engineers describe testing as "QA's job." Correction: engineers own component, integration, and failure coverage; quality engineering owns strategy, risk modeling, journeys, and tooling.
19. Release gating identical for all changes. Signal: a copy change and a billing schema change follow the same process. Correction: risk-tiered gating (Ch. 8.5).
20. No specification of degraded behavior. Signal: under dependency failure, behavior is emergent and inconsistent across services. Correction: documented degradation policy per dependency, then tests for it.
21. Treating third-party integrations as out of scope. Signal: "that was the vendor's outage" appears repeatedly in post-mortems. Correction: your customer experienced your failure; validate your behavior during vendor failure.
22. Confusing environment parity with confidence. Signal: large investment in a "production-like" staging environment that still misses incidents. Correction: accept irreducible environment delta; invest in production coverage instead.
23. Aggregate reporting that hides slices. Signal: a healthy overall number while a customer segment, region, or language is failing. Correction: report per capability, per tier, per slice; gate on the worst slice.
24. Never deleting anything. Signal: suite size only grows. Correction: the deletion protocol in Chapter 12.6, run quarterly.
Chapter 15 — Coverage Maturity Model
15.1 The five levels
LEVEL 5 · CONTINUOUS QUALITY COVERAGE
  Validation is continuous, risk-weighted, and production-integrated.
  Quality is an operational property, not a phase.
        ▲
LEVEL 4 · RISK COVERAGE
  Effort allocated by explicit business risk model.
  Failure modes specified and validated. Release gating is tiered.
        ▲
LEVEL 3 · WORKFLOW COVERAGE
  End-to-end business journeys validated. Contracts enforced.
  Seams are tested, not assumed.
        ▲
LEVEL 2 · AUTOMATION COVERAGE
  Broad automated suite in CI. Stable pipeline.
  Volume-oriented; risk-blind.
        ▲
LEVEL 1 · CODE COVERAGE
  Tests exist. Coverage measured. Quality equated with percentage.
15.2 Level characteristics
| L1 Code | L2 Automation | L3 Workflow | L4 Risk | L5 Continuous | |
|---|---|---|---|---|---|
| Primary metric | Coverage % | Test count, pass rate | Journey coverage | RVI, FSC | ECI, CJC, error budgets |
| Risk model | None | None | Informal | Explicit, scored | Explicit, auto-updating |
| Failure testing | None | Rare | Some | Systematic | Continuous + game days |
| Production role | None | None | Monitoring | Synthetics | Full production coverage |
| Release gating | Pipeline green | Pipeline green | Journey suite green | Risk-tiered | Error-budget driven |
| Test deletion | Never | Never | Occasional | Protocol-driven | Continuous curation |
| Defect discovery | Customer | Customer + QA | QA + monitoring | Pre-prod + synthetics | Automated, pre-customer |
| Typical MTTD | Days | Hours | Hours | Minutes | Minutes, incl. silent class |
| Quality ownership | QA team | QA team | Shared | Engineering-owned | Organization-wide |
15.3 Four supporting maturity models
Automation Maturity
| Level | State |
|---|---|
| 1 | Manual regression; automation aspirational |
| 2 | Automated suite exists; flaky; slow |
| 3 | Stable, fast, parallelized; trusted signal |
| 4 | Effectiveness measured; low-value tests removed; suite curated |
| 5 | Self-maintaining: test impact analysis, auto-quarantine, AI-assisted generation with human review |
Risk Validation Maturity
| Level | State |
|---|---|
| 1 | No risk model; effort by convenience |
| 2 | Informal severity labels on tickets |
| 3 | Documented capability list with priority |
| 4 | Scored matrix with impact × likelihood × detectability, reviewed quarterly |
| 5 | Continuously updated from incident and change telemetry; drives gating automatically |
Production Validation Maturity
| Level | State |
|---|---|
| 1 | Deploy and hope; detection via support tickets |
| 2 | Infrastructure monitoring; technical alerts only |
| 3 | Business metric alerting; SLOs defined |
| 4 | Synthetic journeys; canary analysis; data assertions |
| 5 | Progressive delivery with automated statistical rollback; continuous online evaluation |
Engineering Quality Maturity
| Level | State |
|---|---|
| 1 | Quality is a phase performed by others |
| 2 | Quality is a gate before release |
| 3 | Quality is shared but unmeasured |
| 4 | Quality is engineered, measured by risk, funded explicitly |
| 5 | Quality is an operational property continuously verified; confidence is reported honestly, including gaps |
15.4 Movement rules
Levels cannot be skipped in one respect: signal stability (L2) is a prerequisite for everything above it. An organization with a 4% flake rate cannot meaningfully operate risk-based gating, because its gates do not mean anything.
Beyond that constraint, levels 3 and 4 can be developed in parallel, and level 5 is not a destination but a steady state requiring continuous curation.
Typical duration between levels for a 200–400 engineer organization: L1→L2, 6–9 months; L2→L3, 9–12 months; L3→L4, 6–9 months; L4→L5, 12+ months and ongoing.
Chapter 16 — Building a Coverage Strategy
16.1 The eight-step framework
1. MEASURE REALITY      → Incident archaeology; where did failures actually occur?
2. MODEL RISK           → Business Risk Matrix; tier the capabilities
3. MAP JOURNEYS         → Define Tier 1+2 customer journeys with success criteria
4. ASSESS DEPTH         → Pyramid grid per capability; find the gaps
5. STABILIZE SIGNAL     → Fix flakiness and pipeline duration before adding anything
6. REALLOCATE           → Delete low-value tests; fund workflow and failure coverage
7. EXTEND TO PRODUCTION → Synthetics, canaries, data assertions, observability verification
8. GOVERN               → Risk-tiered gating, new KPIs, quarterly review cadence
Steps 1–4 are assessment and typically take 4–8 weeks. Steps 5–8 are execution over 9–18 months.
16.2 What should be tested first?
Order of operations, deliberately opinionated:
- Anything that moves money. Authorization, capture, refund, proration, invoicing, revenue recognition, tax.
- Anything that controls access. Authentication, session lifecycle, authorization, tenant isolation.
- Anything that cannot be undone. Deletions, exports of sensitive data, irreversible state transitions, outbound communications to customers.
- Anything with regulatory exposure. Audit logging, retention, consent, residency.
- Anything with silent failure modes. Scheduled jobs, async pipelines, reconciliation, replication.
- Anything that just failed. Recent incidents update likelihood; validate the class, not only the instance.
- Everything else, by risk score.
16.3 What should be automated?
Automate where the behavior is stable, the cost of repetition is high, and the signal is reliable:
| Automate | Do not automate |
|---|---|
| Deterministic business rules with real consequences | Behavior still being designed |
| Contracts between services | Subjective quality (visual polish, tone, UX intuitiveness) |
| Regression-prone paths with defect history | One-off migrations |
| Failure modes with specified behavior | Scenarios requiring elaborate, fragile setup for low-risk paths |
| Tier 1 journeys, at segment and full level | Tier 3 capability edge cases |
| Data integrity invariants | Anything you would not fix if it failed |
That final row is the sharpest filter available: if a failing test would not cause you to stop and fix something, do not write it.
16.4 What should remain exploratory?
Exploratory testing is not a legacy practice awaiting automation. It is the only technique that discovers unknown unknowns, and it should be permanently funded for:
- Newly built features before behavior stabilizes
- Complex Tier 1 areas after significant refactoring
- Integration points with newly onboarded third parties
- Adversarial and abuse scenarios
- Accessibility and usability under real assistive technology
- AI system behavior sampling (Chapter 10)
Structure it: charter-based sessions with a stated risk focus, time-boxed, with findings logged and converted into automated validations where they represent recurring risk.
16.5 How priorities evolve
| Situation | Priority shift |
|---|---|
| New third-party dependency | Failure coverage for that dependency, immediately |
| Architecture change (e.g. sharding, region expansion) | Re-score likelihood; rebuild integration and journey coverage |
| Incident in a covered area | Root-cause the validation gap, not only the defect; update the pyramid grid |
| Entering a regulated market | New Tier 1 capabilities for compliance; audit-grade evidence requirements |
| Adding AI features | Establish evaluation sets and online evaluation before launch, not after |
| Major customer segment change (SMB → enterprise) | Journey definitions change entirely; re-map |
| Team growth beyond ~8 teams | Contract testing becomes mandatory; informal coordination stops working |
16.6 A 90-day starting plan
| Weeks | Activity | Deliverable |
|---|---|---|
| 1–2 | Incident archaeology on 12 months of P1/P2 | % of incidents in covered code, by failure class |
| 3–4 | Business Risk Matrix workshop | 15–25 scored, tiered capabilities |
| 5–6 | Journey definition for Tier 1 | 8–15 journeys with success criteria and degradation tolerance |
| 5–8 | Pyramid depth assessment | Validation grid; ranked gap list |
| 7–10 | Flakiness and pipeline remediation | Flake rate < 1%; pipeline < 15 min |
| 9–12 | First failure-coverage specifications | Detect/degrade/communicate/recover for top 5 dependencies |
| 11–13 | First production synthetics | Continuous verification of top 3 journeys |
| 13 | Reporting change | RVI, BWC, FSC replace coverage % in leadership reporting |
Ninety days does not complete a transformation. It produces the evidence, the model, and the first irreversible change to reporting — which is what makes the remaining eighteen months possible.
Chapter 17 — Quality Engineering Dashboard
17.1 Design principles
A quality dashboard fails in one of two ways: it shows metrics no one acts on, or it aggregates until the signal disappears. Four principles prevent both:
- Outcome metrics above activity metrics. Escaped defects and MTTD are outcomes; test counts are activity.
- Every panel segmented by risk tier. No global-only figures.
- Trends over snapshots. Direction of travel matters more than absolute position.
- Gaps are first-class content. The dashboard must have a permanent, prominent "what is not validated" panel.
17.2 Layout
┌───────────────────────────────────────────────────────────────────────┐
│  ENGINEERING CONFIDENCE INDEX     72 ▲4        Error budget: 61% left  │
├──────────────────────────┬────────────────────┬───────────────────────┤
│ RISK VALIDATION INDEX    │ BUSINESS WORKFLOW  │ CUSTOMER JOURNEY       │
│         78% ▲6           │ COVERAGE  94% ▬    │ COVERAGE  81% ▲12      │
│ Tier1 92% Tier2 71%      │ Depth avg: L5.2    │ 13/16 prod-verified    │
├──────────────────────────┼────────────────────┼───────────────────────┤
│ FAILURE SCENARIO COV.    │ OBSERVABILITY COV. │ PRODUCTION CONFIDENCE  │
│         71% ▲9           │      88% ▲3        │        84% ▲2          │
│ 14/14 deps specified     │ Verified by        │ Canary+rollback: 96%   │
│ 3 deps below target      │ injection, Q3      │ of Tier 1 releases     │
├──────────────────────────┴────────────────────┴───────────────────────┤
│  OUTCOMES (rolling 90 days)                                            │
│  Escaped defects (Tier 1)        4  ▼13     Customer-first discovery 21%│
│  P1/P2 incidents                 9  ▼22     MTTD (P1)            6 min │
│  MTTD (silent class)        41 min ▼        MTTR (P1)           34 min │
│  Change failure rate           2.1% ▼1.4    Rollbacks (auto)         7 │
├────────────────────────────────────────────────────────────────────────┤
│  SUITE HEALTH                                                          │
│  Regression stability  0.996 ▲   Pipeline p50 13 min   p95 19 min      │
│  Automation effectiveness  1 detection / 172 tests / 180d              │
│  Tests removed this quarter 1,240   Tests added 610                    │
├────────────────────────────────────────────────────────────────────────┤
│  ⚠  UNVALIDATED RISK REGISTER                        (always visible)   │
│  · Payroll export — partial-batch recovery (Tier 1, score 30) — no test │
│  · SSO cert rotation — expiry handling (Tier 1, score 20) — no drill    │
│  · Data export at p99 tenant volume (Tier 2, score 12) — untested       │
└────────────────────────────────────────────────────────────────────────┘
17.3 Panel definitions
| Panel | Source | Cadence | Decision it drives |
|---|---|---|---|
| Engineering Confidence Index | Composite + survey | Monthly | Overall investment level |
| Risk Validation Index | Risk register × validation status | Weekly | Where to fund next |
| Business Workflow Coverage | Journey registry | Per release | Release readiness |
| Customer Journey Coverage | Synthetic journey inventory | Continuous | Production investment |
| Failure Scenario Coverage | Failure spec registry | Monthly | Resilience roadmap |
| Observability Coverage | Injection test results | Quarterly | Instrumentation work |
| Escaped defects by tier | Incident + defect records | Weekly | Strategy validation |
| MTTD split by loud/silent | Incident records | Weekly | Detectability investment |
| Change failure rate | Deployment records | Weekly | Gating adjustments |
| Regression stability | CI telemetry | Daily | Blocking issue if < 0.99 |
| Automation effectiveness | Test-to-defect linkage | Quarterly | Deletion candidates |
| Unvalidated risk register | Risk model minus validation | Continuous | Sprint planning |
17.4 The most important panel
The Unvalidated Risk Register is the panel most organizations omit and the one that produces the most behavior change. A dashboard that shows only what has been achieved converts into a self-congratulation instrument within two quarters. A dashboard with a permanent, ranked list of known-unvalidated Tier 1 risks maintains organizational attention on the gap.
It must be ranked by risk score, must name an owner, and must show age. A Tier 1 risk that has been unvalidated for 200 days is the single most important fact on the entire dashboard.
17.5 Anti-patterns
- Reporting code coverage anywhere on the executive view
- A single global number for anything
- Green-by-default styling that reads as "fine" when data is stale
- Panels without an owner
- Metrics that cannot be improved by any specific action
Chapter 18 — The Future of Software Quality
18.1 Direction of travel
Five shifts are already visible in advanced engineering organizations and will define the next several years of quality practice.
18.2 AI-assisted test generation, human-governed intent
Generative models are already competent at producing test code. They are not competent at deciding what matters, because that requires knowledge of business consequence that does not exist in a repository.
The realistic division of labor:
| Model does well | Humans must own |
|---|---|
| Generating test scaffolding and boilerplate | Deciding which risks require validation |
| Enumerating edge cases from a specification | Writing the specification of intended behavior |
| Producing failure-injection variants | Setting degradation policy |
| Maintaining tests through refactors | Approving deletion and coverage strategy |
| Summarizing coverage gaps across a codebase | Judging which gaps are acceptable |
The danger is obvious and worth stating plainly: AI generation makes it trivially cheap to produce enormous volumes of low-value tests. Organizations without a risk model will use it to accelerate exactly the failure mode this paper describes, reaching 99% coverage and 40,000 tests faster than ever before, with unchanged incident rates and a much larger maintenance burden.
The competitive advantage in the AI era is not generation capacity. It is knowing what to generate.
18.3 Autonomous quality validation
Emerging capability: systems that explore an application, derive its behavioral model, detect deviations across releases, and propose validations for uncovered high-risk paths. Combined with test impact analysis, this moves toward suites that curate themselves — running only what a change could affect and flagging what a change has left unvalidated.
The governing constraint remains: autonomous exploration discovers behavior, not intent. It can tell you that behavior changed. It cannot tell you whether the change was a defect or a feature, because that judgment lives outside the system.
18.4 Continuous verification as the default
The pre-production/production boundary continues to erode. The end state is not "test in production" as a slogan but a continuum:
Design → Build → CI validation → Progressive exposure → Continuous verification
                                        ↑                        │
                                        └────── evidence ────────┘
Releases become statistical events with automated statistical decisions: expose to 1%, compare distributions of error rate, latency, and business conversion against baseline, promote or roll back automatically. Human approval moves from "does this look right?" to "is this risk tier eligible for automated promotion?"
18.5 Production experimentation as a quality technique
Feature flags, shadow traffic, and A/B infrastructure were built for product experimentation. They are equally quality infrastructure: shadow traffic validates a rewritten service against real production requests without customer exposure; flags scope blast radius to a tenant; experiments detect behavioral regressions that no assertion would have expressed.
Organizations that treat experimentation infrastructure as product-only are leaving their most powerful validation mechanism unused.
18.6 Engineering intelligence
The final shift is the unification of currently separate data: version control, CI, incidents, defects, deployments, telemetry, and customer outcomes. When these are joined, questions that are currently unanswerable become routine:
- Which modules have the highest defect density per change, and are they validated proportionally?
- Which tests have ever detected a genuine defect, and what did each cost?
- What is the measured correlation between our validation depth and our incident rate, per capability?
- Which unvalidated risks have the highest expected annual loss?
This is the mature end-state of the argument in this paper: quality decisions made from evidence about your own system, rather than from an industry-standard percentage that was never connected to your outcomes in the first place.
18.7 What will not change
Three things are durable regardless of tooling:
- Risk judgment cannot be automated, because it requires knowing what the business cannot afford to lose.
- Someone must specify intended behavior, including intended behavior under failure. No tool derives should from is.
- Customers judge outcomes, not process. Every metric is a proxy; the outcome is whether the customer succeeded.
Chapter 19 — CTO Checklist
Forty questions. If more than fifteen cannot be answered with evidence within one working day, the organization is operating on false confidence.
Measurement honesty
- Are we measuring coverage or confidence?
- What percentage of last year's incidents occurred in code that was already covered by tests?
- Do our coverage metrics change any funding, staffing, or gating decision?
- Could a team improve every quality metric we report without reducing customer-visible failures?
- What is our escaped-defect rate, segmented by risk tier?
- Do we report a single global quality number to leadership? Why?
- When did we last remove a metric from executive reporting?
- Is there any metric on our dashboard that no one has acted on in six months?
Risk model
- Do we have a written, scored risk model for our business capabilities?
- Who from finance and product participated in scoring business impact?
- When was the risk model last updated, and by what trigger?
- Which capabilities are explicitly designated as low-priority for validation?
- Do we account for detectability, or only for impact and likelihood?
- Which risks are currently accepted, and is that acceptance documented and approved?
Workflow and journey
- Name the five business workflows whose failure would most damage the company.
- For each, name the specific validation that proves it works end to end.
- Which business workflows remain entirely unvalidated at L4 or above?
- Do we validate journeys through APIs and business outcomes, or through UI selectors?
- Have we defined degradation tolerance for each critical journey?
- Do our journey validations use production-shaped data, including our largest tenants?
Failure coverage
- For each Tier 1 dependency, what is our specified behavior on timeout, on 5xx, and on rate limiting?
- Have we tested that behavior, or only documented it?
- What happens to in-flight transactions when our payment provider fails mid-request?
- Do we validate idempotency under retry, for every path that retries?
- When did we last run an unannounced failure drill?
- Which of our failure responses could amplify an incident — retry storms, cache stampedes, breaker flapping?
Production coverage
- Which critical journeys are continuously verified in production right now?
- If a scheduled job silently skipped 3% of accounts, how long until we knew?
- Have we empirically verified that our alerts fire, by injecting failures?
- What proportion of Tier 1 releases use canary analysis with automated rollback?
- Do we have data-integrity assertions running against production state?
- What is our MTTD for silent-class failures specifically, as distinct from loud ones?
Economics and suite health
- What is our flake rate, and what does it cost us annually?
- How many tests have detected a genuine defect in the last 180 days?
- What is our pipeline p95 duration, and how is it affecting PR size?
- When did we last delete tests deliberately, and what was the outcome?
- What proportion of our quality effort is spent at pyramid levels L4–L7?
Organization and AI
- Do engineers regard quality as owned by them or by a QA function?
- Is a team that reports an unvalidated Tier 1 gap rewarded or questioned?
- For any AI-based feature: do we have versioned evaluation sets, per-slice thresholds, and online evaluation in production — and who owns them?
Chapter 20 — Final Thoughts
20.1 The reframe
This paper has argued a single proposition from many angles: coverage, as conventionally measured, describes test execution rather than software quality, and organizations that manage the first while believing they are managing the second will continue to be surprised by their own incidents.
The alternative is not more rigor applied to the same metric. It is a different question. Not how much of our code did we execute? but which of the risks that matter have we actually validated, under conditions that resemble reality, including the conditions in which things go wrong?
That question is harder to answer. It cannot be computed by a tool, it does not produce a number that rises smoothly quarter over quarter, and it requires engineering leaders to know their business well enough to rank consequences. Those properties are not defects of the approach. They are why it works.
20.2 What changes when an organization makes this shift
- Testing effort concentrates where failure is expensive rather than where testing is easy.
- Suite size stops growing and often falls, while confidence rises.
- Failure behavior becomes specified rather than emergent.
- Production becomes the final validation environment rather than the discovery environment.
- Leadership reporting shifts from achievement to gap, which is the only reporting that drives action.
- Engineers stop writing tests to satisfy a threshold and start writing them to control a risk.
20.3 Three statements worth carrying forward
Coverage is easy to measure. Confidence is much harder.
Customers never experience your code coverage — they experience your software.
A thousand automated tests cannot compensate for one unvalidated business workflow.
20.4 The closing distinction
Coverage is a measurement. Quality is an outcome. The two are related, but the relationship is conditional, weak at the margins, and — as Chapter 13 demonstrated — occasionally inverse.
The best engineering organizations do not optimize for test counts. They optimize for the confidence that a customer, executing a workflow that matters, under conditions that are imperfect, will succeed. Everything else — the pyramid, the risk matrix, the KPIs, the maturity model — exists to serve that single objective.
The measurement is not the goal. It never was.



