
A trace nobody looked at
Here is a distributed trace from a production checkout. It was recorded on an ordinary weekday afternoon, it was never attached to an incident, and no engineer ever opened it.
POST /checkout                            1.91 s   status=200
│
├── authenticate_user ..................... 31 ms
├── get_cart .............................. 42 ms
├── pricing_service ....................... 84 ms
├── inventory_service .................... 121 ms
├── payment_authorize .................... 604 ms
│    └── retry ........................... 588 ms
├── create_order .......................... 73 ms
└── send_confirmation .................... 214 ms
With the resource and span attributes attached:
deployment.environment  = production
service.version         = 4.18.2
region                  = eu-central
cart.item_count         = 17
payment.provider        = B
customer.type           = returning
promotion.active        = true
checkout.variant        = new_checkout
result.status           = success
Nothing failed. The customer got an order confirmation. The request finished inside whatever latency budget the team has written down, if it has written one down. In every dashboard this trace exists only as one increment to a success counter and one sample in a latency histogram. In most organizations, that is the entire lifecycle of this piece of evidence: it is retained for a couple of weeks, it is never queried, and it expires.
Now ask a different question about it. Not what broke — nothing broke — but: what does this trace know that the regression suite does not?
Read it again as a test-design artifact rather than as an operational one, and it turns out to be dense with information that no planning meeting produced.
It knows that this exact dependency combination occurs in real usage. Authentication, cart retrieval, pricing, inventory, payment, order creation, and confirmation all participate in a single user-visible operation, in that order, with those adjacencies. A test suite that exercises each of those services independently has not exercised this composition.
It knows that payment provider B required a retry. The first authorization attempt did not return in time and the client tried again. The customer never learned this. The trace is the only durable record that, in this system, on this path, the retry logic is not a theoretical branch — it is load-bearing. Nearly a third of the request's total duration was spent inside a code path that most regression suites touch only through a unit test written when the retry was first implemented.
It knows that a seventeen-item cart is not an exotic input. Somebody's regression fixture almost certainly contains one item, or three. The production distribution says otherwise, and cart size is precisely the kind of variable that changes pricing rule evaluation, inventory allocation, promotion applicability, response payload size, and the number of rows written inside create_order.
It knows that a promotion was active, which means the pricing path taken here is not the pricing path taken by a default-configuration test. It knows the request ran under a feature-flag variant called new_checkout, which means the executed code differs from the code a test using default flag values would execute. It knows the customer is a returning one, which implies stored payment instruments, an address book, a loyalty balance, and an order history — all state that a freshly seeded test account does not have.
And it knows that confirmation delivery cost 214 milliseconds inside the user-visible request, which is a design fact worth arguing about and a latency contributor that no functional test would ever notice.
None of that came from a requirements document. All of it came from the system doing its job.
The second trace
Here is another trace from the same endpoint, in the same hour, from the same service version.
POST /checkout                            2.44 s   status=200
│
├── authenticate_user ..................... 28 ms
├── get_cart .............................. 39 ms
├── loyalty_service ....................... 96 ms
├── pricing_service ...................... 151 ms
├── fraud_check .......................... 402 ms
├── inventory_service .................... 118 ms
│    ├── warehouse_reserve[eu-1] .......... 61 ms
│    └── warehouse_reserve[eu-3] .......... 54 ms
├── payment_authorize .................... 289 ms
├── create_order .......................... 88 ms
├── fulfillment_split ..................... 44 ms
└── send_confirmation .................... 198 msregion = eu-central
cart.item_count = 22
payment.provider = A
customer.type = returning
customer.loyalty_tier = gold
promotion.active = true
inventory.split = true
result.status = successSame endpoint. Same HTTP method. Same status code. Same "covered by our checkout tests" claim in the coverage report. Structurally, a different program ran. Two services appear that were absent from the first trace — loyalty_service and fraud_check — and one span, fulfillment_split, exists only because the inventory service could not satisfy the order from a single warehouse and fanned out to two. The payment provider is different, and this one did not need a retry.
An endpoint-level coverage metric treats these two executions as the same thing. They are not the same thing. They exercise different services, different failure surfaces, different data shapes, and different timing profiles. The difference between them is not noise; it is the difference between two distinct behaviors that happen to share a URL.
This is the observation the rest of this article is built on. Production execution is itself a source of test-design information. Not a substitute for requirements, not a replacement for unit tests, not an argument that you should stop thinking before you ship. Simply this: the running system continuously produces evidence about which paths exist, which combinations occur, which dependencies are fragile, and which behaviors have already had to survive contact with real users — and most engineering organizations throw that evidence away without ever asking it a testing question.
The rest of this piece works in one direction repeatedly. Start with a trace. Turn it into an observation. Generalize the observation into a pattern. Judge the pattern's risk and importance. Decide whether it deserves to become a test candidate. If it does, decide what kind of test, at what level, with what controlled. That movement — evidence to durable regression asset — is what turns observability from a diagnostic capability into a quality-engineering one.
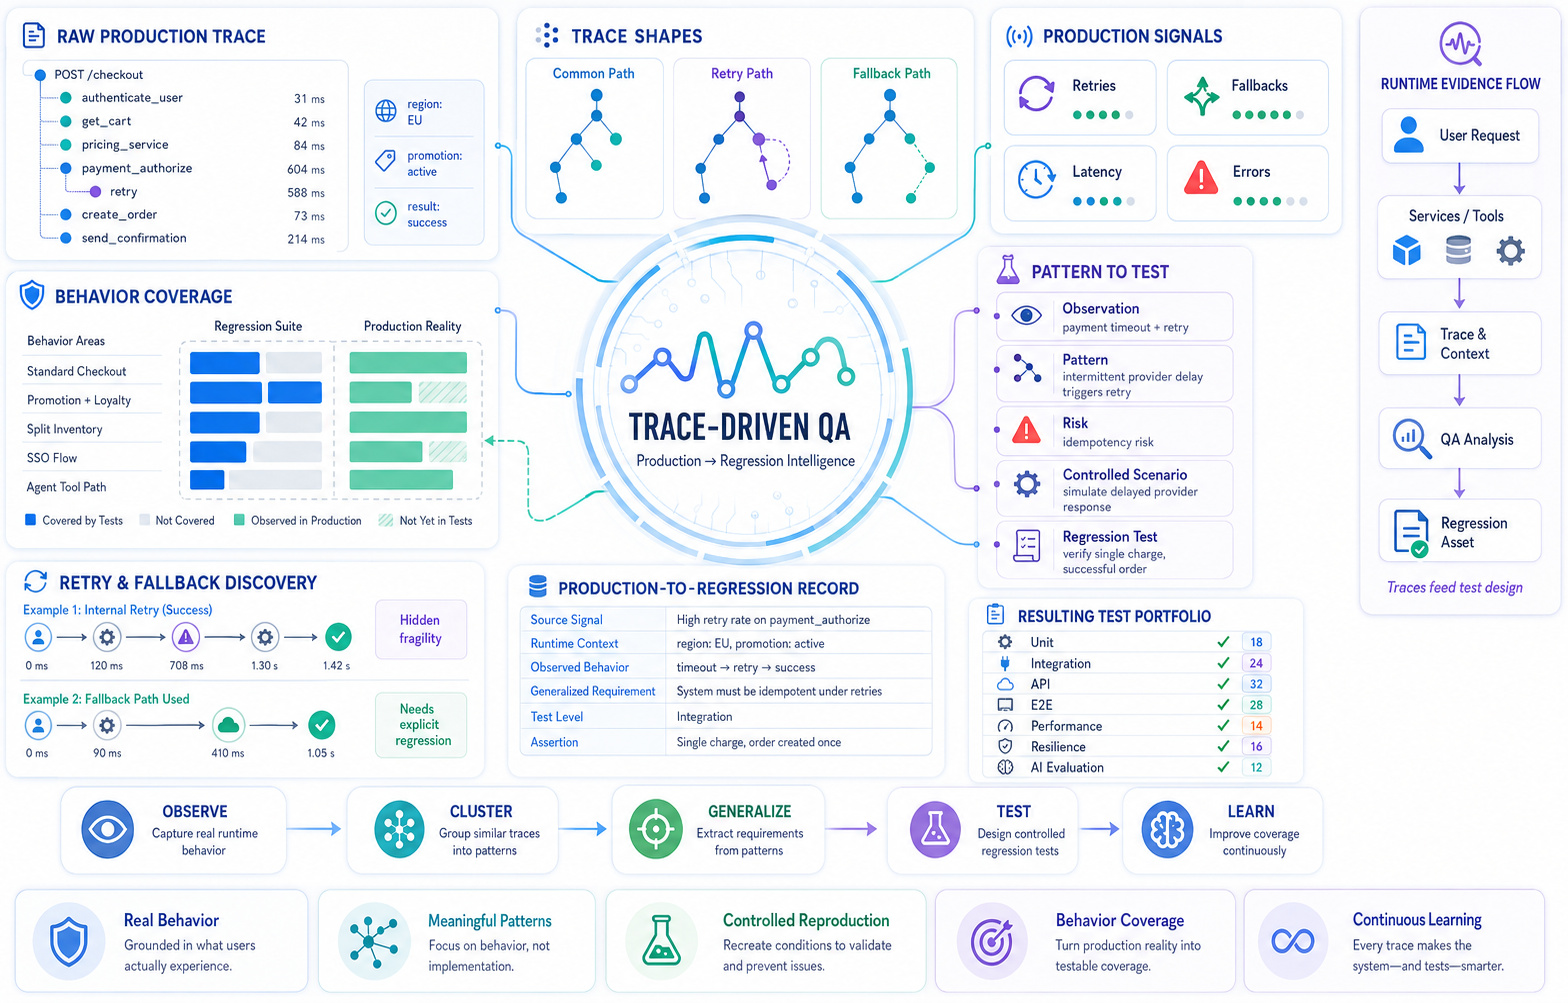
Figure 1 — A raw production trace, annotated as test-design evidence. Visual brief: The checkout span tree from the opening, rendered as a standard waterfall. To the right of the waterfall, a second column of callouts pointing at individual spans, each labeled with the testing question that span raises:
payment_authorize → retry→ "Is retry idempotent?";inventory_service→ "Is a 17-item cart in any fixture?";send_confirmation→ "Is 214 ms inside the request intentional?"; the attribute block → "Which of these is in any test's setup?" Placement: Immediately after the opening section. Caption: A trace that never triggered an alert. Read operationally, it says "success." Read as test-design input, it enumerates at least five untested conditions.
What counts as production evidence
Before going further it is worth being precise about the word "trace," because the argument here is broader than distributed tracing while still being anchored in it.
Production evidence is a family of signals, and the members of the family are related but not interchangeable. Treating them as one undifferentiated pile of "telemetry" is the fastest way to reach wrong conclusions about what the system is doing.
Distributed traces record a single logical operation as it crosses process and service boundaries. A trace is a set of spans linked by parent-child relationships and carried across boundaries by context propagation. Its distinguishing property is that it preserves relationships: what called what, in which order, with what overlap, and how long each participant took relative to the whole. This is the signal that matters most for the argument in this article, because test design is fundamentally about composition, and traces are the only widely deployed signal that records composition directly.
Application-internal traces are the same mechanism applied below the service boundary: spans around workflow steps, state machine transitions, business rule evaluation, cache lookups, or queue handoffs inside a single process. These are usually the difference between a trace that says "the pricing service took 151 ms" and one that says "the pricing service took 151 ms, of which 94 ms was promotion rule evaluation over 22 line items."
Logs carry detailed, unaggregated event context — exception types and messages, business events, decision points, and the specific values that a span attribute was never going to hold. Logs are where you find out why a span has error.type=validation_failed. In OpenTelemetry, log records can carry trace and span identifiers, which is what makes the pairing useful rather than parallel.
Metrics are aggregations: counters, gauges, and histograms over dimensions. Metrics are excellent at telling you that something has changed and roughly where, and structurally incapable of telling you what the individual execution looked like. A metric knows that checkout p95 rose. It does not know that the increase is concentrated in requests where promotion.active=true unless someone had the foresight to make that a dimension, and it never knows what the affected requests did next.
User-flow analytics describe which product paths people follow — screens, actions, abandonment points. Different granularity from traces, usually a different pipeline, and the answer to a question traces answer poorly: what was the user trying to do across several requests.
Errors and exceptions are the observed failure modes with their frequency and stack context — the signals most organizations already mine, though usually for triage rather than test design. External dependency behavior — retry counts, throttling, timeout distributions, partial failures, degraded modes of systems you do not control — is often the highest-value and least-instrumented category, because dependency behavior is precisely what pre-production environments simulate least accurately. Tool calls and model calls, in AI systems, record which tools an agent selected and which model handled which step. User feedback — corrections, abandonment, escalation, support tickets — is evidence about whether a successful-looking execution was actually acceptable.
These fail in different ways, and a useful discipline is to keep asking which one you are holding. Metrics find the region; traces explain the execution; logs explain the decision; analytics explain the intent; feedback explains whether the outcome was good enough. A test candidate built from one of them is usually built on a guess about the other four.
The emphasis throughout this article stays on trace-level evidence, for one reason: traces preserve execution relationships that aggregation destroys. You can reconstruct a metric from traces. You cannot reconstruct a trace from metrics. And test design is almost entirely about relationships — sequence, adjacency, causality, state, and timing. That is the same information a span tree holds and a counter does not.
The information gap
A regression suite is a written record of one specific thing: what the engineering team, at various points in the past, believed was important enough to encode as an executable check.
That is a valuable artifact, and nothing here argues otherwise. But it is worth being clear-eyed about what it is. Every test in the suite exists because a human decided it should. Every scenario reflects an act of imagination performed before the behavior existed, under time pressure, with incomplete requirements, against an environment that was not production.
Production, meanwhile, is a record of something different: what users and systems actually did.
These two sets overlap. They never coincide. The interesting engineering question is why the gap exists and what shape it has.
Pre-release test design operates under constraints that are structural rather than cultural:
- Requirements are incomplete by construction. They describe intended behavior, not emergent behavior. A requirement says what should happen when a promotion applies. It rarely says what should happen when a promotion applies to eleven of seventeen items, three of which are out of stock in the nearest warehouse, for a customer whose loyalty tier changed mid-session.
- Usage is imagined, not observed. Before launch there is no alternative. After launch, most teams never revisit the imagined model.
- Combinations are pruned aggressively. They have to be. The combinatorial space of state × configuration × data × timing is unbounded; a suite must sample it. The question is whether the sampling is informed.
- Test data is synthetic. Seeded accounts have clean histories, plausible values, and no accumulated weirdness. Real accounts have partial migrations, legacy plan codes, deleted-but-referenced entities, and fields that were free text for two years before they were an enum.
- Integration assumptions are frozen at design time. The payment provider's documented behavior is what the stub implements. Its actual behavior — including the response it returns at the 99th percentile of latency under load — is not in the documentation.
- Time runs out. Always.
Production introduces the combinations those constraints exclude:
real account state
  × real traffic patterns
  × real dependency behavior
  × real historical data
  × real feature configuration
  × real timing and concurrency
That product is where most non-obvious defects live.
Production is not truth
It is important to state the counterweight immediately, because the failure mode of this whole approach is treating runtime behavior as authoritative.
Production traffic contains noise: bots, scanners, misconfigured integrations, one-off client bugs, abuse, obsolete flows reached through stale bookmarks, and anomalies that will never recur. It contains malformed data the system accepted years ago and now has to keep tolerating. Most importantly, it contains the effects of defects nobody has discovered yet, which means some observed behavior is wrong behavior, faithfully recorded.
So telemetry has to be interpreted, not copied. The rest of this article is largely about the interpretation step, because the mechanical parts — collecting traces, querying them, clustering them — are the easy half.
Test coverage, code coverage, behavior coverage
Most automation reporting answers questions about the suite and the codebase:
1,820 automated tests
83% line coverage
92% API endpoint coverage
Each of these is a real and useful number. Each measures something specific:
Test coverage measures what the suite executes — how many scenarios exist and run, and how often they pass. It is a property of the suite.
Code coverage measures what implementation lines, branches, or paths are executed during testing. It is a property of the relationship between the suite and the source.
Neither of them measures the thing that determines whether users encounter defects. That third property deserves a name:
Behavior coverage is the degree to which meaningful real-world workflows, state combinations, dependency interactions, and failure patterns have representation somewhere in testing.
Note what behavior coverage is not. It is not "percentage of production traces replayed." It is not a single number at all, and the article is going to resist inventing one, because a universal behavior-coverage metric would be either trivially gameable or so heavily qualified as to be useless.
It resists quantification for concrete reasons:
- The denominator is unbounded and unknown. You cannot enumerate all meaningful behaviors, only observe a sample of the ones that occurred, filtered through whatever sampling policy is in effect.
- "Meaningful" is a judgment, not a measurement. Two traces that differ in one attribute may represent the same behavior or two entirely different ones, depending on whether that attribute changes what the system does.
- Representation is not one-to-one. A single well-designed unit test can cover a behavior class that appears in millions of traces. A hundred end-to-end tests can fail to cover a behavior class that appears in eleven. What behavior coverage can be is a question asked repeatedly against specific, segmented evidence. Not "what is our behavior coverage" but: of the twelve most frequent checkout trace shapes last month, how many have a corresponding test? Of the six error classes that account for most failures on the pricing path, how many have a controlled reproduction? Of the dependency degradation modes actually observed in the last quarter, how many are simulated anywhere in CI?
Those questions have answers. The answers are usually uncomfortable, which is a good sign that the question was worth asking.
Figure 2 — The suite's model versus production's behavior. Visual brief: Two overlapping irregular regions (deliberately not a clean Venn diagram with equal circles). Left region labeled "encoded in the regression suite," right region labeled "occurring in production." The intersection is labeled "verified behavior." The suite-only crescent is labeled "obsolete, hypothetical, or over-specified tests." The production-only crescent is labeled "behavior with no representation in testing," subdivided by dotted lines into "high-frequency," "rare but high-impact," "newly emerging," and "noise / not worth encoding." Placement: End of the behavior-coverage section. Caption: Test count measures the left region. Neither region is a subset of the other, and the right-hand crescent is where production evidence earns its keep.
A suite can be large and still model the wrong reality
Consider a regression suite whose checkout coverage, viewed as a list of scenarios, looks responsible:
checkout — single item, standard price
checkout — Visa card, no promotion
checkout — default region, default currency
checkout — guest customer
checkout — declined card
checkout — empty cart validation
Six scenarios, all passing, all maintained. Now compare against what production actually does most often on the same endpoint:
carts of 10–30 items                         common
stored wallet payment instrument             common
promotion stacked with loyalty discount      common
mobile web client                            majority of traffic
inventory allocated across two warehouses    common
returning customer with saved addresses      majority
(These proportions are illustrative, not measured.)
The suite is not wrong. Every one of those six scenarios is worth having. The suite is stale, in a specific way that no amount of test-count growth would fix: the modal execution in production is not represented, and neither are the state and configuration dimensions that most influence which code runs.
This is not incompetence, and framing it that way makes teams defensive and stops the conversation. It is a consequence of how systems and scenario models age differently. The system changes with every deployment, every flag rollout, every dependency upgrade, and every shift in the customer mix. The scenario model changes only when a human deliberately revisits it. Over three years, the system will have changed thousands of times; the scenario model, if the team is diligent, a few dozen. Divergence is the default state, and it is invisible unless something external measures it.
Production evidence is that external measurement.
Trace shape
Two requests to the same endpoint can execute different programs. The useful abstraction here is trace shape: the topology of the span tree, independent of timing and identifiers.
Shape A                       Shape B
checkout                      checkout
 → pricing                     → loyalty
 → payment                     → pricing
 → order                       → fraud_check
                               → payment
                                  → retry
                               → order
                               → fulfillment_split
Same endpoint. Same contract. Different behavior, different dependencies, different failure surface.
Trace topology reveals things that endpoint-level and even service-level views cannot:
- Optional services. Which participants appear only under some conditions, and what those conditions are.
- Retries. Whether a logical operation succeeded on the first attempt or the third, which is invisible in the response.
- Fallback paths. A span sequence that indicates the primary path failed and a secondary one produced the result.
- Feature-specific branches. Structural differences that correlate with a flag, a plan tier, or a rollout cohort.
- Regional dependencies. Services that participate only in some regions, or that are called cross-region in some deployments and locally in others.
- Asynchronous work. Where the synchronous request ends and the downstream consequences begin.
- Unexpected coupling. A service appearing in a trace where the architecture diagram says it should not be, which is one of the most valuable findings this technique produces and one of the least often looked for.
Shape is a better unit of analysis than endpoint for test design, because shape is closer to what the system did while endpoint is only what the system was asked.
Clustering shapes into behaviors
A high-traffic system produces more traces than any human process can review. The scale problem is real and it is the reason most teams never attempt this. The resolution is to stop looking at traces and start looking at groups of traces.
Conceptually:
~10,000,000 traces in a week
        ↓ group by structural similarity
    ~400 distinct trace shapes
        ↓ merge shapes that represent the same behavior
     ~30 meaningful behavior clusters
        ↓ filter by novelty, risk, change, and instability
      ~8 worth an engineering conversation this week
The reduction from ten million to eight is what makes the whole approach tractable. It is also where the judgment lives.
There is no single correct grouping algorithm, and claiming otherwise would be overreach. Useful grouping dimensions, in rough order of how often they prove informative:
| Dimension | What it separates | Typical failure mode |
|---|---|---|
| Ordered sequence of span names | Structurally different programs | Explodes on high-cardinality span names |
| Set of participating services | Dependency composition | Loses ordering, merges genuinely different flows |
| Error signature (type + originating span) | Failure classes | Groups by symptom, not cause |
| Latency profile shape | Performance regimes | Sensitive to load, not behavior |
| Feature flag / variant combination | Configuration-driven branches | Requires flags to be instrumented |
| Customer segment or plan tier | State-driven branches | Privacy sensitive; needs low-cardinality classes |
| Tool-call sequence (agent systems) | Reasoning/orchestration patterns | Extremely high variance |
Automated clustering — hashing normalized span-name sequences, edit distance over span trees, embedding similarity — is good at surfacing candidates and at answering "is this shape new?" Human judgment is better at the merge step, because deciding that two structurally different shapes represent the same behavior requires knowing what the system is supposed to do.
A practical starting point that requires no machine learning: normalize each trace to its ordered sequence of span names with identifiers and parameters stripped, hash the sequence, count occurrences over a time window, and sort. The long tail is noise; the head is your behavior model; the shapes that appeared this week and not last week are your investigation queue.
Figure 3 — From trace volume to behavior clusters. Visual brief: A funnel in four stages, left to right. Stage 1: a dense field of tiny span-tree glyphs (millions). Stage 2: those glyphs collapsed into a few hundred distinct outline shapes. Stage 3: shapes grouped into ~30 labeled clusters ("standard checkout," "promotion + loyalty," "payment retry," "split fulfillment," "fallback recommendations"…). Stage 4: a short list of 6–8 clusters flagged with icons for new, rising, error-prone, unrepresented in suite. Annotate the arrow between stages 3 and 4 as "human judgment." Placement: After the clustering table. Caption: The value of clustering is not compression. It is producing a list short enough that engineers will actually read it.
Frequency is a signal, not a ranking
Production tells you how often each behavior occurs, and frequency is genuinely informative. A workflow that executed four million times last month is doing more work for more people than one that executed eleven times. A regression in the first affects everyone; a regression in the second may go unnoticed for a quarter.
But frequency cannot be the ordering function, and the reason is easy to state. Consider a payment path where, illustratively:
99.8%   payment authorization succeeds on the first attempt
 0.2%   authorization times out after the provider has already accepted it
The 0.2% is the dangerous one. It is the case where a naive retry creates a second authorization against the same payment intent — a duplicate charge, a reconciliation problem, a chargeback, and a support conversation that costs more than the order was worth. Rarity in production says nothing about consequence.
A workable framing keeps several signals in view without collapsing them into a score:
frequency              how much of real usage depends on this
business impact        what it costs when this is wrong
failure severity       is failure recoverable, visible, or silent
historical instability how often has this area broken before
change frequency       how actively is this code being modified
Deliberately, no formula. Any weighting you publish will be gamed, or will be treated as objective when it encodes a set of arguable judgments, or will need different weights per domain and per quarter. What the list is good for is making sure a prioritization conversation considers all five rather than defaulting to whichever one is easiest to query.
Four categories are worth protecting for four different reasons:
High-frequency paths — protect because many users depend on them and a regression is immediately expensive.
High-risk rare paths — protect because impact is severe regardless of rate: money movement, data destruction, permission boundaries, regulated actions, anything irreversible.
Historically unstable paths — protect because empirical breakage rate is the best available predictor of future breakage rate.
Newly emerging paths — investigate first, because a behavior that did not exist last month either represents an intentional change (verify it is behaving as intended) or an unintentional one (which is a defect you have not named yet).
Working backward from a failure trace
Now the central transformation, performed slowly and explicitly, because the steps between "we saw this in production" and "we have a durable regression asset" are where most teams either skip work or do the wrong work.
The incident is the payment timeout from the opening trace, in its unhappy variant. The production evidence:
POST /checkout                    status=200  duration=3.42 s
├── ...
├── payment_authorize                        error.type=timeout
│    ├── attempt 1 ................. 3000 ms  (client deadline exceeded)
│    └── attempt 2 .................. 288 ms  status=authorized
├── create_order ..................... 91 ms
└── send_confirmation ............... 203 msservice.version = 4.18.2
payment.provider = B
promotion.active = true
customer.type = returning
retry.count = 1
retry.reason = deadline_exceeded
result.status = successLater reconciliation shows two authorizations at the provider for one payment intent. The customer sees one order and two holds on their card.
The wrong response
The intuitive response is to take this trace and turn it into a test: recreate the same cart, the same provider, the same promotion, drive the same sequence, assert the outcome. This produces a test that is expensive to build, non-deterministic, tightly coupled to the current architecture, and — critically — specific to the wrong things. Nothing about a seventeen-item cart or an active promotion caused this defect. Encoding them into the test embeds coincidence as a requirement, and the next engineer to read it will not be able to tell which parts matter.
The transformation
Work through it in stages.
Observation. The authorization request exceeded the client's deadline. The client treated the timeout as a failure and retried.
The important fact. A timeout is not a failure signal. It is the absence of a signal. The provider may have completed the operation, may have rejected it, or may never have received it. The client cannot distinguish these three states from a timeout alone. This is the actual finding, and it is a property of distributed systems rather than a property of this cart or this promotion.
Risk. Blind retry after an ambiguous response can duplicate a financial operation. The blast radius is money, reconciliation, and trust — high severity, low frequency, irreversible without manual intervention.
Generalized requirement. State it as an invariant, in the vocabulary of the domain rather than the vocabulary of the trace:
For a given payment intent, repeated authorization attempts — whether caused by client retry, network replay, user resubmission, or worker redelivery — must result in at most one authorization at the provider.
Notice what this invariant does not mention: cart size, promotion state, region, customer type, provider identity, or the specific timeout value. It survives a change of payment provider. It survives a refactor of the checkout service. It is the durable thing.
Controlled test. Now design the reproduction, and design it to be deterministic:
Given  a payment provider stub configured to
         accept the first authorization request,
         and delay its response beyond the client deadline
When   checkout is executed for a payment intent
Then   the client observes a timeout and retries
And    the provider stub records exactly one authorization
And    the order is created exactly once
And    the customer-visible state shows a single charge
Assertions. Exactly one authorization exists for the payment intent. Exactly one order exists. The idempotency key sent on the retry equals the key sent on the first attempt. The trace emitted by the test contains retry.count=1 and retry.reason=deadline_exceeded — because if you are going to depend on those attributes to detect this class of problem in future, they are themselves worth asserting.
The principle underneath the whole exercise, stated once:
Production supplies evidence of the failure. Test engineering generalizes the failure into a reusable property.
The trace is not the test. The trace is the reason the test exists.
Figure 4 — Trace to generalized regression asset. Visual brief: Six stacked bands, top to bottom, each a different width to suggest narrowing then widening. Band 1 (widest): the raw failure trace with its full attribute block. Band 2: "Observation — authorization deadline exceeded, client retried." Band 3: "Generalized fact — a timeout does not distinguish not-received from completed." Band 4 (narrowest): "Invariant — at most one authorization per payment intent." Band 5: "Controlled scenario — provider stub accepts then delays." Band 6 (wide again): a fan-out into four test artifacts at different levels. Mark the boundary between bands 3 and 4 as "the generalization step — where most of the engineering judgment lives." Placement: After the invariant is stated. Caption: The narrow point in the middle is deliberate. Value is created by discarding the incidental detail, not by preserving it.
One failure, several test assets
A second common mistake is the assumption that one production failure maps to one test. It rarely does, because a single runtime failure usually exposes several independent gaps at several levels.
The payment timeout above justifies at minimum:
Unit — idempotency key derivation. Does the key derive deterministically from the payment intent, or does it derive from something regenerated per attempt (a request ID, a timestamp, a UUID)? This is a pure function and belongs in a unit test that runs in microseconds. If the key derivation is wrong, every other layer of protection is decorative.
Integration — retry behavior against the payment adapter. With a controlled stub, does the adapter resend the same key, respect a maximum attempt count, distinguish retryable from non-retryable errors, and apply backoff? This is the layer where the actual defect probably lives.
End-to-end — checkout recovery after an ambiguous provider response. Does the user-visible outcome remain correct: one order, one charge, one confirmation, correct order status? Exactly one such test, not one per cart configuration.
Reconciliation / contract — provider-side state. If the provider exposes a way to query authorizations by idempotency key, does the system's view agree with the provider's view after an ambiguous exchange?
Observability — the diagnostic attributes. Does the retried span carry retry.count and a low-cardinality retry.reason? If detection of this failure class in production depends on those attributes, their absence is itself a defect, and it is one that will be introduced silently by an unrelated refactor unless something asserts it.
Five assets, four of them cheap, one of them slow. That distribution is the point of the next section.
Choosing the level
A production trace shows a system-wide workflow. It does not follow that the test must be system-wide. This is probably the single most common way trace-driven testing goes wrong: production evidence is dramatic and end-to-end, so the response is dramatic and end-to-end.
Take a different incident. Production traces show scheduled reports generating with the wrong date range for a subset of customers. The trace spans eleven services and forty spans. Root cause: a date parser treats an ISO-8601 string with a Z suffix as local time in one code path.
The cheapest reliable prevention is a unit test over the parser with a table of timezone-annotated inputs. It runs in milliseconds, it never flakes, it fails with a message that points directly at the bug, and it will still be correct after the eleven services become six.
An end-to-end replay of the original workflow would also catch it, at roughly a thousand times the cost, with a failure message that says "report contents did not match expected" and a maintenance burden that outlives the defect by years.
Production tells you what failed. Test design decides the cheapest reliable layer that can prevent recurrence.
A working heuristic for the level decision:
| If the defect is fundamentally about… | The test probably belongs at… |
|---|---|
| A pure computation, parse, format, or rule | Unit |
| The interaction between your code and one dependency | Integration with a controlled stub |
| A contract between two services you both own | Contract test on both sides |
| The composition of several steps into a user outcome | One end-to-end test, carefully chosen |
| Behavior under dependency degradation | Fault injection at the integration boundary |
| Behavior under data volume or concurrency | Performance or concurrency test with a controlled fixture |
| Whether a condition is detectable at all | Telemetry assertion |
Two additional rules of thumb. First, push down: if the same defect can be caught one level lower, catch it one level lower. Second, if you cannot state what the end-to-end test adds beyond what the lower-level tests already assert, it is probably adding cost rather than confidence.
Successful traces are evidence too
There is a strong pull toward treating telemetry as a failure archive. Errors are what wake people up, so errors are what get mined. This leaves most of the evidence unread, because most production behavior succeeds.
A successful trace tells you things a failing one cannot:
- Which workflows are actually load-bearing for the business.
- Which dependency sequences occur in practice, as opposed to which ones the architecture diagram implies.
- Which data combinations are ordinary — cart sizes, record counts, tenant configurations, document lengths.
- Which fallback paths are working, silently, all the time.
- What "normal" latency and shape look like, which is the only baseline against which "abnormal" means anything.
- How the system recovers, and whether the recovery is correct or merely non-crashing.
A path does not need to fail before it deserves regression coverage.
A worked example: enterprise sign-in
Production evidence over a week shows a substantial, entirely successful trace shape:
GET /app  (enterprise session establishment)     620 ms
├── saml_assertion_validate ................. 84 ms
├── tenant_resolve .......................... 41 ms
│    └── tenant_membership_lookup ........... 33 ms
├── entitlement_service .................... 289 ms
│    ├── plan_features ...................... 47 ms
│    ├── seat_assignment .................... 62 ms
│    └── custom_entitlement_overrides ...... 171 ms
└── dashboard_bootstrap .................... 187 msauth.method = sso_saml
tenant.type = enterprise
tenant.multi_org = true
entitlement.overrides = 14
result.status = successIllustratively, this shape accounts for a large minority of authenticated sessions — call it 35% — and effectively all of the revenue-weighted usage, because enterprise tenants are where the money is.
The automated suite covers password login. It covers it well: valid credentials, invalid credentials, lockout, password reset, session expiry, remember-me. There is no automated coverage of the SAML assertion path, no coverage of tenant resolution when a user belongs to multiple organizations, and no coverage of entitlement override resolution.
Nothing has broken. That is exactly why nobody noticed. The gap is invisible from inside the suite — every test passes, coverage looks reasonable, no bug reports point here — and obvious from the trace data, which shows a heavily used, multi-service, state-dependent execution path with no representation in testing.
This is a coverage discovery signal, and it is the category that pure incident-driven testing structurally cannot produce. Incident-driven testing improves the suite only where the system has already hurt someone. Trace-driven testing can improve it before that.
The test candidates that fall out:
- Integration: SAML assertion validation against a controlled identity provider stub — valid assertion, expired assertion, wrong audience, replayed assertion, missing required attribute.
- Integration: tenant resolution for a user with membership in multiple organizations, including the ambiguous case and the revoked-membership case.
- Unit: entitlement override resolution precedence — plan default versus seat assignment versus explicit override, with conflicts.
- End-to-end: one enterprise SSO session establishment producing a correctly scoped dashboard for a multi-org user with overrides.
- Performance: entitlement resolution latency with a realistic override count (see the latency section below — 14 overrides is ordinary; some tenants have hundreds).
Figure 5 — A successful path with no representation in the suite. Visual brief: Two horizontal tracks. The upper track shows the production SSO span sequence, each span drawn as a filled block. The lower track shows the regression suite's authentication coverage as a shorter sequence of blocks (credential validation → session issue → dashboard). Draw vertical dotted lines connecting matched concepts; leave
saml_assertion_validate,tenant_resolve, andcustom_entitlement_overrideswith no counterpart, shaded and labeled "no coverage." Include a small annotation: "zero failures, zero alerts, zero tests." Placement: After the enterprise sign-in example. Caption: Nothing here is broken. The gap is only visible by comparing what runs against what is tested.
The reverse finding: tests that no longer earn their keep
The same evidence source supports a less comfortable conclusion. Production can show that behavior a suite spends significant maintenance effort on no longer occurs.
Candidates surface as trace shapes that are conspicuously absent from production while being conspicuously present in the suite:
- Flows for features that were removed but whose tests were only disabled, never deleted.
- Legacy API versions with no remaining callers.
- Client types that no longer exist in the traffic mix.
- Configuration combinations that were deprecated three migrations ago.
- Paths that are genuinely rare and genuinely low-consequence.
Two cautions, both important.
First, absence of evidence is not evidence of absence. The path may occur below your sampling rate. It may occur only in a region whose collector is misconfigured. It may occur annually — end-of-year processing, tax boundaries, certificate rotation, leap day — and you are looking at a week of data. It may be a disaster-recovery path that has correctly never executed. Check the instrumentation before concluding the behavior is gone.
Second, "rare" and "unimportant" are different words. The rare payment ambiguity from the previous section would show up in this list too, and deleting its test would be an expensive mistake.
But with those caveats, this is one of the more valuable applications for teams carrying large legacy suites. A suite that grows monotonically becomes slower, flakier, and harder to trust, and the usual pruning criteria — "which tests fail most," "which tests are slowest" — select for the wrong things. Production evidence at least lets the pruning conversation be about whether the behavior still matters, rather than about whether the test is annoying.
User journeys versus API tests
There is a specific and very common mismatch worth naming, because it explains why systems with excellent API test coverage still ship user-visible defects.
API automation typically covers endpoints in isolation:
GET  /cart              → 200, schema valid, correct totals
POST /coupon            → 200, discount applied
POST /shipping          → 200, options returned
POST /payment           → 200, authorization succeeded
POST /orders            → 201, order created
Every endpoint is verified. Every contract holds. Every response validates against its schema.
The production trace shows what actually happens:
search
 → product_detail
 → add_to_cart
 → apply_coupon
 → shipping_options
 → shipping_select      (recalculates tax, invalidates coupon eligibility)
 → payment_method
 → payment_authorize
 → 3ds_redirect         (session suspended, resumed 40 s later)
 → order_create
 → confirmation
The APIs are tested. The behavioral composition is not. And composition is where a specific family of defects lives: state carried between steps, ordering assumptions, cache invalidation between calls, session state across a third-party redirect, recalculations triggered by later steps that invalidate earlier ones, and idempotency when a step is repeated.
The coupon-invalidated-by-shipping-selection interaction cannot be found by testing POST /coupon and POST /shipping independently. Neither endpoint is wrong in isolation. The defect exists only in the sequence.
This is not an argument that API tests are insufficient and everything must become end-to-end. It is an argument that composition is a distinct thing to be tested, that production traces are the best available evidence of which compositions actually occur, and that a small number of composition tests chosen from real sequences will outperform a large number chosen from imagination.
Turning a real journey into a controlled test
Given a common production journey, the conversion is a sequence of deliberate decisions. Skipping any of them tends to produce either a brittle test or a privacy incident.
1. Identify the meaningful pattern. Not one trace — a cluster. Take the sequence that recurs, not the individual instance. If the pattern is "search → product → cart → coupon → shipping → payment → confirmation," that is the artifact, not the particular customer's particular purchase.
2. Strip personal and unnecessary data. Remove user identifiers, email addresses, session tokens, search query text, product names where they are not behaviorally relevant, addresses, and payment details. What remains should be structure and behaviorally relevant classes: "logged-in returning customer," "coupon of percentage type," "shipping option requiring address validation."
3. Identify the required state. This is usually the hardest step and the one that determines whether the test is realistic. The journey above presupposes: a catalog with searchable products, at least one product in stock, a valid coupon whose rules interact with shipping, a customer account with an address, a payment instrument, and a tax configuration for the destination. Enumerate it explicitly; state that is implied rather than declared is where test flakiness comes from.
4. Separate incidental detail from behavior. For every attribute in the production evidence, ask whether the behavior would change if it were different. Cart contains 17 items → does the defect class depend on count, or is any multi-item cart equivalent? Provider is B → does provider identity matter, or only the response timing? Region is eu-central → does the code branch on region, or is that coincidence? Everything that does not change behavior should be replaced with a neutral value or removed. Everything that does change behavior should be named in the test, so a future reader knows it was chosen deliberately.
5. Reproduce dependencies controllably. External services become stubs whose behavior you specify. This is not a compromise — it is the point. A test whose outcome depends on a third party's live behavior is a monitor, not a test. Where the real dependency's behavior is the thing under test, use a recorded-and-replayed contract or a vendor-provided sandbox with defined semantics.
6. Define the assertions. State what must remain true, in terms of user-visible outcome and critical side effects. Prefer outcome assertions ("the order total equals the sum of line items minus the discount, plus tax for the selected destination") over mechanism assertions ("the pricing service was called twice").
7. Place it at the right level. Most of a journey does not need to run through a browser. Frequently the right answer is: one thin end-to-end test that proves the composition holds, plus several integration tests that cover the interesting interactions between adjacent steps.
Do not copy production data
Everything above depends on getting production evidence in front of engineers, which makes data governance a first-class part of the technique rather than a compliance footnote.
Production traces and logs routinely contain, deliberately or accidentally:
- User identifiers, account identifiers, and internal customer keys
- Email addresses and phone numbers, often inside URLs or error messages
- Full request URLs with query parameters
- Search query text and free-text form input
- Document names, file paths, and object keys
- Tool call arguments in agent systems
- Model prompts and completions
- Business data: prices, balances, order contents, medical or financial specifics
- Occasionally, credentials and tokens that ended up in a header dump
Before any of this becomes a test input, several things need to be settled — ideally as policy rather than per-incident judgment.
Minimization at the source. The best control is not capturing it. Instrumentation should emit behavioral dimensions, not payloads. customer.tier=enterprise instead of the customer's name. query.length_bucket=long instead of the query. document.type=invoice instead of the filename. This is cheaper, safer, more useful for aggregation, and better for cardinality all at once.
Redaction and anonymization in the pipeline. For what does get captured, processing between collection and storage should strip or hash sensitive fields. Note that hashing an identifier makes it pseudonymous, not anonymous — a hashed user ID is still a user ID for most regulatory purposes, and still permits linkage.
Retention. Trace data used for test discovery does not need to live as long as trace data used for incident response, and the derived artifacts (patterns, shapes, invariants) should outlive the raw traces by design.
Legal requirements. Depending on jurisdiction and sector, moving production data into a test environment may be constrained regardless of technical safeguards. Purpose limitation, cross-border transfer rules, and sector-specific regimes all apply to telemetry as much as to databases. This needs a real answer from people qualified to give one, before the pipeline is built rather than after.
The governing principle is simple to state and clarifying to apply: the goal is to preserve behavioral structure, not to copy data. A test derived from production should be reproducible by someone who has never had access to a production record. If the test requires a real customer's real data to work, the generalization step was not finished.
What succeeds while quietly failing
The richest vein in production evidence is the set of behaviors that produce a successful user-visible outcome while something underneath did not work. These are structurally invisible to functional testing — the assertions pass, the status code is 200, the UI shows the confirmation — and they are exactly where latent fragility accumulates.
Retries
A retry that succeeds erases itself from every signal except the trace.
inventory_service ......... 1.63 s   result=success
├── attempt 1 ............. 1.00 s   error.type=timeout
└── attempt 2 ............. 0.62 s   status=200
The response is correct. The error rate is unaffected. The user notices, at most, that the page was slow. The metric that would have caught this — dependency error rate — was never incremented, because from the caller's perspective there was no error.
QA should care for reasons that compound:
- Traffic amplification. A dependency that is slow enough to trigger retries receives more load precisely when it is least able to handle it. Retry storms are a standard cascading-failure mechanism, and the first evidence of one is a rising retry rate during a period when error rate looks fine.
- Duplication. Every retry against a non-idempotent operation is a potential duplicate. The payment case earlier is the expensive version; duplicated emails, duplicated webhook deliveries, and duplicated inventory reservations are the common ones.
- Latency. The retried request's latency is the sum of a timeout plus a successful call. This is the mechanism behind most "the p99 is terrible but the p50 is fine" investigations.
- Masked degradation. Retries hide a dependency's decline until it crosses the threshold where retries stop working, at which point the failure appears sudden. It was not sudden; it was invisible.
- Idempotency as a testable property. Retry behavior makes idempotency a runtime requirement rather than a design nicety, and idempotency is very testable at the integration level.
The practical action is to make retry rate a first-class thing to look at, per dependency, per path — not just retry count on error, but retry count on success. A rising successful-retry rate is an early warning that costs nothing to watch and is almost never watched.
Figure 6 — A retry hidden inside a success. Visual brief: One wide span bar labeled
inventory_service — 1.63 s — success, drawn in the "healthy" color. Directly beneath it, the same duration decomposed into two child bars: a long one shaded as failed (attempt 1 — timeout) and a short successful one (attempt 2). To the right, three small signal panels: an error-rate sparkline (flat), a latency histogram (visible right-tail bump), and a retry-count sparkline (rising). Label the error-rate panel "no signal" and the retry panel "the signal." Placement: End of the retries subsection. Caption: From above, a success. From inside, a dependency that has started failing. Only one of the three panels notices.
Fallback paths
Fallbacks are retries' more consequential cousin: instead of trying the same thing again, the system does something different.
get_recommendations ....... 214 ms   result=success
├── recommendation_service .. 200 ms  error.type=unavailable
└── cache_recommendations .... 12 ms  status=200  source=cache  age=6h
The user sees recommendations. Whether they see good recommendations is a separate question that no automated check is currently asking.
The reasoning here should be uncomfortable: if a fallback path is important enough to be carrying production traffic, it is important enough to have explicit tests. Fallbacks are typically written once, tested manually during development, and then never exercised again in any controlled way — while quietly serving real users during every dependency incident, which is precisely when correctness matters most.
Four things deserve testing, and they are distinct:
Fallback correctness. Does the degraded path produce valid output? Not "does it return 200" — does it return something the downstream system and the user can correctly consume? Schema, invariants, and business rules all still apply.
Staleness semantics. Cached recommendations six hours old may be fine. Cached prices six hours old may be a legal problem. Cached permissions six hours old is a security problem. The test should assert the staleness bound, and the system should be emitting the age attribute that makes the assertion possible.
Degraded functionality boundaries. What is unavailable in fallback mode, and does the system communicate that honestly? A fallback that silently drops personalization is different from one that silently drops a safety check.
Detectability. Is fallback activation observable? If not, you cannot measure how often it happens, alert on it, or test for it — which is where observability and testability turn out to be the same problem.
The corresponding test writes itself once the fallback is treated as a real path: make the primary dependency unavailable in a controlled environment, then assert that the fallback engages, that the output is correct and appropriately labeled, that the staleness bound holds, and that the telemetry records the degradation.
Dark failure modes
It is useful to have a name for the general category. A dark failure is a failure that does not produce a user-visible error.
Examples, roughly ordered by how often they go unnoticed:
- A retry succeeded, so the underlying failure is invisible.
- A fallback succeeded, so the primary failure is invisible.
- A secondary write failed — the audit log, the search index, the analytics warehouse, the replica — while the primary write succeeded.
- An asynchronous side effect failed after the response was returned: the notification, the webhook, the downstream event.
- A cache refresh failed, so the system continues serving stale data that is still plausible.
- A partial result was returned where a complete one was expected, and the caller has no way to tell the difference.
- A background reconciliation job silently skipped records it could not process.
UI automation cannot find any of these, because from the UI everything is correct, and API tests generally cannot either. Traces can, because a trace records the spans that failed even when the operation as a whole succeeded — and because it records the spans that should have existed and did not. Absence is a signal: a checkout trace with no search_index_update span, in a system where that span normally appears, is evidence of a dark failure, visible only to someone comparing shapes rather than reading individual traces.
Asynchronous work
Most production workflows do not end when the response is sent.
POST /orders  → 201 Created                       [user-visible: 340 ms]
   │
   └── order.created (event)
         ├── inventory_worker      → decrement stock          (+ 1.2 s)
         ├── invoice_worker        → generate invoice PDF     (+ 4.8 s)
         ├── notification_worker   → send confirmation email  (+ 6.1 s)
         ├── warehouse_worker      → dispatch pick request    (+ 12 s)
         └── analytics_worker      → emit order event         (+ 0.4 s)
End-to-end automation typically stops at "Order confirmed." Everything after that arrow is a responsibility the system has taken on and that nothing in the suite verifies.
The question of when regression testing should verify asynchronous effects has a defensible answer: when the effect is part of the user's or the business's definition of the operation succeeding. The email is part of the order being complete, from the customer's point of view. The warehouse pick request is part of the order being complete, from the business's point of view. The analytics event probably is not, and a test that waits for it is buying very little.
For the effects that do matter, the mechanics need care, because polling with a timeout is the usual approach and produces the flakiest tests in most suites. Better, roughly in order: assert on the event being published rather than on all consumers finishing; test consumers independently with a synthetic event; and where the full chain must be verified, use a deterministic trigger and a bounded wait on a specific state transition rather than a sleep. Trace context propagation across the async boundary is what makes any of it diagnosable — if the event carries context and the workers continue the trace, you get one causally linked view from user action to warehouse dispatch instead of five disconnected traces and an order ID to grep for at three in the morning.
Queues and event-driven systems
Trace-driven analysis pays off disproportionately in message-driven architectures, because the properties that matter most there are properties of sequences and multiplicities rather than of individual calls, and those are precisely what a trace records and a metric does not.
Without naming any particular broker, the recurring findings are: duplicate processing, where at-least-once delivery causes the same logical message to be handled twice — fine if the consumer is idempotent, a defect if not; missing consumers, a message published with no consumer span anywhere, usually a deployment-ordering or topic-configuration problem and silent by construction; delayed processing, visible as the gap between publish and consume timestamps; unexpected fan-out, one event producing more downstream work than the design anticipated because a consumer was added and nobody recalculated the amplification; poison messages, failing and redelivering indefinitely; and ordering violations between related messages on different partitions.
Each maps to a consumer-level test with a controlled broker or an in-memory substitute — far cheaper and far more reliable than any end-to-end alternative.
Concurrency
Production creates interleavings that seeded test data almost never produces, because production has many actors and tests usually have one.
The recurring patterns that show up in traces:
- Two browser tabs, or a browser and a mobile app, acting on the same entity.
- A user action and an inbound webhook mutating the same record within milliseconds.
- A retry arriving while the original request is still in flight.
- Multiple workers picking up related messages simultaneously.
- A background job running against a record a user is editing.
- A read-modify-write cycle spanning a network call, with a second actor in the gap.
Traces are good at surfacing candidates — overlapping spans against the same resource identifier, version conflicts, retries triggered by optimistic locking failures — and bad at reproducing them. Reproduction has to be engineered, and the goal is not replaying the exact timing, which is not reproducible and which produces tests that fail one time in fifty for reasons nobody can explain. The goal is to extract the race: identify the two operations, the shared state, and the window, then force the interleaving with explicit synchronization — a latch, a stub that blocks until signaled, a transaction held open. What was probabilistic in production becomes deterministic in the test.
State is usually the missing variable
A large fraction of "not reproducible" defects are reproducible; the reproduction just requires state that nobody thought to recreate.
The characteristic shape:
The failure occurs only when
    the customer has a subscription created before the pricing migration
  + the account was moved to the new billing model
  + the feature flag `usage_based_invoicing` is enabled
  + the billing period boundary falls inside a DST transition
Test each variable independently and everything passes. All four together, and the invoice is wrong.
Trace attributes are what make this tractable, provided the right ones exist. If the trace carries billing.model, subscription.legacy=true, and the active flag set, then the query that finds the pattern is a filter rather than an investigation. If it does not, the pattern is only findable by someone who already suspects it.
The obvious objection is combinatorial explosion, and it is correct: with a dozen relevant dimensions you cannot test the product. Three partial responses. Test the interactions that occur, not the ones that could — production narrows the space enormously, since a small number of combinations account for nearly all traffic. Classify rather than enumerate — subscription.legacy as a boolean is more useful for both analysis and test design than a plan code with four hundred values. And use combinatorial techniques deliberately: pairwise selection over the dimensions that production says matter gets most of the interaction coverage for a fraction of the cases. What production contributes is telling you which dimensions belong in the model at all.
Feature flags and configuration
Feature flags mean the deployed artifact and the executing program are different things. Two users on the same build can run different code.
For trace-driven QA this has a hard requirement attached: the active configuration must be visible in the telemetry, or a large class of behavior becomes unattributable. A trace that shows a defect but not the flag state that produced it tells you something is wrong and nothing about where to look.
Four cases matter. Progressive rollout, where behavior differs between cohorts — comparing trace shapes across cohorts is one of the most direct forms of behavioral diffing available, and it is available before full rollout. A/B variants, where multiple behaviors are concurrent by design, each with its own correctness requirements. Migration flags, where old and new paths run simultaneously and the interesting defects are in the transitions and disagreements. And canary or regional configuration, where behavior differs by deployment target rather than by user.
When a defect appears only under new_checkout=true, the regression test should be tied to that configuration explicitly — the test sets the flag, the test name or metadata records it, and the test's lifecycle is linked to the flag's. This also creates a maintenance obligation that most teams handle badly: when the flag is removed, the test needs revisiting. A test pinned to a flag that no longer exists is either silently testing the default or silently passing for the wrong reason.
Cardinality discipline applies here too. Recording the full flag evaluation context on every span is attractive and expensive. Recording a small number of behaviorally significant flags, or a compact variant identifier, is usually the right trade.
Deployment correlation
Correlating behavior with version is what converts "something changed" into "something changed here." The dimensions worth carrying, most of which map to standard resource attributes:
service.version          which build of this service
deployment.environment   which environment
service.instance.id      which instance (for outlier isolation)
config.version           which configuration generation
model.version            which model (for AI systems)
schema.version           which data contract generation
With these present, a question that is otherwise an archaeology exercise becomes a query: what changed when this trace pattern appeared? And the answer targets regression engineering at the behavior that actually shifted, rather than at the general area where the symptom appeared.
Latency as a functional signal
Performance testing is usually organized as a separate activity, run by different people, on a different schedule, with different tooling and separate reporting. Production traces make that separation harder to justify, because a trace does not distinguish between a functional fact and a timing fact — it records both, in the same structure, for the same execution.
A feature can be entirely correct and still be broken. Correct output delivered after eleven seconds is, from the user's perspective and often from the business's, a failure. And unlike a functional regression, this kind of degradation arrives gradually and gets normalized.
Trace evidence identifies specific, actionable things:
- Which span dominates. Not "checkout is slow" but "84% of checkout duration is in
entitlement_service, and 60% of that is incustom_entitlement_overrides." - Sequential calls that could be concurrent. Visible immediately in a waterfall as a staircase where a stack would do.
- Repeated calls. The same downstream operation invoked n times where the caller intended one — the distributed-systems form of the N+1 query, and one of the most common findings in any first serious look at trace data.
- Unexpected retries. Covered above; a major contributor to tail latency.
- Serialization points. A lock, a single-threaded worker, or a rate-limited dependency showing up as spans that queue.
- Cold-path costs. Cache misses, connection establishment, lazy initialization, JIT warmup, or model cold starts appearing at a rate that suggests the warm path is less common than assumed.
Latency shape
An average is a poor summary of a latency distribution and an actively misleading one for a multi-modal distribution, which most real endpoints have.
Production distributions routinely show combinations like:
p50  240 ms    stable across the quarter
p95  1.4 s     up 60% since the last release
p99  6.2 s     concentrated in one region
max  38 s      one tenant, one query shape
Each line is a different phenomenon with a different cause and a different testing response. The p50 says the common path is healthy. The p95 shift says a meaningful minority of requests got worse — often a specific segment, and segmentation is what identifies it. The p99 regional concentration points at infrastructure or cross-region calls. The maximum points at a data-volume problem in a single tenant.
Two habits follow. First, look at percentiles rather than averages, and look at them segmented — by region, plan tier, client type, tenant size, flag variant. An aggregate p95 across all segments can be stable while every individual segment degrades, if the traffic mix shifts. Second, resist universal thresholds. There is no correct p95 for "an API." There is only a budget that a specific operation's specific users can tolerate, which is a product decision informed by measurement, not a number from an article.
From latency observation to performance regression
The transformation follows the same movement as the failure case, with a data-volume hypothesis in the middle.
Production observation. Traces for generate_report show a strongly bimodal duration distribution. Segmenting by tenant reveals the split correlates with record count: tenants under roughly a thousand records complete in under two seconds; tenants above ten thousand routinely exceed thirty.
Workload hypothesis. The cost is superlinear in record count. Drilling into the span tree of a slow trace shows permission_filter called once per record rather than once per query — an N+1 against the authorization service.
Reproducible dataset. Construct a fixture: a synthetic tenant with a defined record count at a level production says is real (not the maximum, not the median — a level that exists and matters), with the relevant distribution of record types and permission assignments. This fixture is now a durable asset, versioned alongside the tests.
Performance regression test. Run report generation against the fixture on every release candidate. Assert a duration budget. Optionally assert the structural property directly — that the authorization service is called O(1) times rather than O(n) — which is more precise, less flaky, and less sensitive to CI machine variance than a wall-clock threshold.
production observation
   → segmentation reveals the driving variable
      → workload hypothesis
         → controlled dataset at a realistic scale
            → performance regression with a defined budget
The contribution production makes here is workload realism. Left to imagination, performance fixtures gravitate toward round numbers that feel large — a thousand records, ten thousand rows. Production tells you that your largest tenant has 340,000 records with a permission override on 11% of them, that the 90th-percentile tenant has 4,200, and that the interesting cliff is somewhere around 8,000. A fixture built on that evidence tests something real.
The structural assertion deserves emphasis. Wall-clock assertions in CI are notoriously noisy — shared runners, neighbors, cold caches. Asserting on operation counts derived from the trace the test itself produces sidesteps most of that noise while catching the actual regression class. "The report generation trace contains at most one permission_filter span regardless of record count" is a stable, meaningful, fast assertion, and it is only expressible because the system emits traces.
Observability is evidence, not an oracle
A distinction that has to be made explicitly, because everything above could be read as claiming more than it should.
This trace is a complete record of an execution:
POST /checkout → pricing → payment → create_order → 201It does not tell you whether the price was correct. It does not tell you whether the authorization amount matched the order total. It does not tell you whether the discount should have applied. It does not tell you whether the customer saw a state consistent with what was written. It does not tell you whether a business rule about promotional stacking was respected, whether the tax jurisdiction was determined correctly, or whether the inventory decrement matched what was reserved.
A trace records what happened. It does not record what should have happened. That second thing has to come from somewhere else — requirements, product intent, domain rules, regulatory constraints, a reference implementation, a mathematical property, or a human being who knows the domain.
This is the oracle problem, and production telemetry does not solve it. What telemetry does is far more modest and still valuable: it tells you which situations need an oracle. It identifies the executions worth reasoning about, the combinations worth checking, the paths where "is this right?" is a question nobody has asked. The reasoning still has to happen.
Confusing these two roles produces a specific and dangerous failure: treating observed production behavior as the specification. That mistake gets its own section later, because it becomes acute in AI systems where the space of possible behaviors is much larger.
Error taxonomy and failure families
Production errors arrive as a long tail of distinct messages. A naive approach creates one test per distinct exception string, which produces a suite that is enormous, redundant, and organized around symptoms rather than causes.
The productive move is to group errors into failure classes — categories that share a mechanism and therefore share a mitigation and a test strategy:
| Failure class | Typical trace signature | Reusable test family |
|---|---|---|
| Dependency timeout | Span with error.type=timeout, duration at the deadline |
Fault injection: delayed response at the boundary |
| Dependency unavailable | Connection refused, circuit open, immediate error | Fault injection: dependency down |
| Rate limiting / throttling | 429-class responses, retry-after headers | Fault injection: throttled responses, backoff assertions |
| Partial success | Some child spans succeed, some fail, parent succeeds | Contract test: partial-result handling |
| Malformed or unexpected input | Validation or parse errors at an entry span | Property-based or table-driven unit tests |
| Authorization failure | 403-class at a permission span | Access-control test matrix |
| Data inconsistency | Constraint violation, missing referenced entity | Integration test with realistic inconsistent state |
| Retry exhaustion | Repeated attempt spans terminating in failure | Resilience test: sustained dependency failure |
| Concurrency conflict | Optimistic lock failure, version mismatch | Deterministic interleaving test |
| Stale cache | Correct-looking output with an old cache.age |
Cache invalidation test |
| Downstream 5xx | Server error propagating up | Error-propagation and user-messaging test |
| Serialization / schema mismatch | Parse failure at a service boundary | Contract test between the two services |
The pattern is: failure class → reusable test family. One well-built fault-injection harness covering the timeout class serves every dependency in the system. Forty-seven individual tests derived from forty-seven individual traces serve nobody.
Worked example: the dependency timeout cluster
Production traces over a week show inventory_service timeouts appearing across several unrelated workflows: checkout, order modification, a stock-report endpoint, and a background reservation-expiry job. Forty-seven traces, seven distinct trace shapes, one dependency.
The wrong response is forty-seven tests. The right response is a focused resilience investment aimed at one boundary, covering the behaviors that actually differ:
- Timeout. The dependency does not respond within the deadline. Does the caller fail cleanly, retry appropriately, or fall back?
- Slow response. The dependency responds just inside the deadline. Does the caller's own budget accommodate it, or does it blow the parent operation's SLO?
- Partial response. The dependency returns some of the requested items. Does the caller detect the gap, or silently proceed with incomplete data?
- Unavailable. Connection refused outright. Does the circuit breaker open, and what does the user see?
- Retry exhaustion. Sustained failure across all attempts. Is the terminal state correct — is the reservation released, is the cart preserved, is the error actionable?
- Recovery. The dependency comes back. Does the circuit close, does queued work drain, and does anything need reconciling?
Six controlled scenarios against one boundary, reusable across all four workflows that depend on it.
What production contributed was not the list of scenarios — that list is standard resilience engineering. What production contributed was the decision of where to spend the effort. There are probably thirty dependencies in this system. Building this harness for all thirty is not going to happen. Production evidence identified the one where it pays off this quarter.
This is also the honest answer to a common objection about chaos engineering and fault injection: that randomly breaking things is expensive and produces findings nobody prioritizes. Production telemetry converts randomized failure injection into targeted failure injection. Instead of "let's see what happens if we kill a random service," the question becomes "our traces show that this specific dependency degrades in these three specific ways under real conditions — do we handle those three correctly?" The first is an experiment. The second is a test.
Metrics find the area; traces explain the behavior
The three core signals are complementary and each is bad at the others' jobs. A worked sequence makes the division of labor concrete.
A metric raises the question.
checkout.duration  p95:  810 ms → 1,240 ms  (48h)
checkout.errors    unchanged
checkout.rate      unchanged
Something got slower. Nothing is failing. Traffic is flat. The metric has done exactly what metrics are good at — cheap, continuous, aggregate detection — and it has now told you everything it knows.
A trace explains the behavior.
Comparing p95 traces, before vs after:

  before:  fraud_check ..... 180 ms
  after:   fraud_check ..... 402 ms
             └── device_fingerprint_lookup ..... 231 ms   [new span]
The trace localizes the change to one span and reveals a child span that did not exist before. This is causal structure, and no amount of metric slicing produces it.
A log explains the decision.
level=info  msg="enhanced verification path activated"
            rule=high_value_cart  threshold=200  cart_total=340
            trace_id=…  span_id=…
Now the mechanism is known: a fraud rule was changed to invoke device fingerprinting for carts above a threshold, and the affected population is larger than whoever set the threshold expected.
Together they produce a test candidate that none of them produces alone.
- A performance regression test: checkout latency budget with a cart above the fraud threshold, asserting a bound on the verification path.
- A functional test: the enhanced verification path completes correctly and does not block legitimate high-value orders.
- A resilience test:
device_fingerprint_lookupis a new external dependency on the critical checkout path — what happens when it is slow or unavailable? (This is a new single point of failure that the change introduced, and it is arguably the most important finding of the three.) - A monitoring change: fraud-path latency and enhanced-verification rate become tracked signals, segmented by rule.
The general shape: metrics tell you where to look, traces tell you what happened, logs tell you why, and the combination tells you what to test. A workflow that uses only one of the three will systematically miss the candidates that require the others.
Figure 7 — Three evidence layers, one investigation. Visual brief: Three stacked horizontal bands sharing a common time axis. Top band: a metric line chart with a visible step change, annotated "detection — where." Middle band: two span waterfalls side by side (before / after) with the new child span highlighted, annotated "explanation — what." Bottom band: structured log records carrying trace and span identifiers, annotated "reason — why." Draw a vertical correlation line through all three at the moment of change; on the right, an arrow out of all three into a box labeled "test candidates." Placement: End of this section. Caption: Each signal answers a different question. The test candidate is only well-formed when all three have been consulted.
Instrumentation as a quality-engineering dependency
Everything in this article assumes the telemetry exists and is good enough to reason about. That assumption deserves scrutiny, because it usually does not hold by default, and the gap between "we have tracing" and "we have tracing that can answer test-design questions" is substantial.
What OpenTelemetry is, and why it matters here
OpenTelemetry is a vendor-neutral, open source observability framework — a set of APIs, SDKs, and tooling for generating, collecting, and exporting telemetry, specifically traces, metrics, and logs. It is explicitly not a backend: storage and visualization are left to other tools, which is what makes it possible to instrument once and change analysis tooling later. The project reached CNCF graduated status in May 2026, which is the foundation's highest maturity level and its formal signal of production readiness. A fourth signal, continuous profiling, is at an earlier stage of maturity.
For QA the relevant property is not tracing itself — distributed tracing predates OpenTelemetry by a long way. It is standardization. The useful question is:
How can standardized telemetry make runtime behavior machine-readable enough to feed quality workflows?
That question has a concrete answer, and it lives in the semantic conventions.
Semantic conventions
OpenTelemetry's semantic conventions define a shared vocabulary: standardized attribute names, span names and kinds, metric instruments and units, and their meanings and valid values. The point is correlation — data from different codebases, languages, and libraries lines up because everyone agreed on the names. The conventions cover areas including HTTP, database, messaging, RPC, CI/CD, and general resource attributes, and individual conventions carry explicit stability markers.
Why this matters is easiest to see through its absence. Suppose three services describe the same concept:
billing-service     customer.plan  = "enterprise"
auth-service        plan_type      = "ENT"
reporting-service   subscription   = "enterprise_annual"
Every cross-service question now needs a translation layer maintained by whoever remembers all three. "Show me all traces for enterprise customers where checkout took over two seconds" is a query in a consistent system and a project in an inconsistent one. Filtering, comparison, clustering, and any automated candidate extraction degrade in proportion to the inconsistency.
Consistent instrumentation is what makes production evidence queryable at the behavioral level rather than merely readable at the incident level — roughly the difference between observability as a debugging aid and observability as a quality-engineering input.
Trace attributes are test-design features
Once the vocabulary is consistent, attributes become the dimensions along which behavior is analyzed and along which tests are parameterized. In practice the useful set for QA looks like:
region                 which deployment or data residency zone
client.type            web / mobile / api / partner integration
customer.tier          plan or segment class (low cardinality)
tenant.size_class      small / medium / large / very_large
feature_flag.<name>    active variant for behaviorally significant flags
dependency.name        which downstream participated
payment.provider       which external provider handled the operation
retry.count            how many attempts
retry.reason           low-cardinality cause
fallback.used          whether a degraded path served the request
cache.hit              whether the response came from cache
cache.age_bucket       staleness class, not raw age
error.category         classified failure family
service.version        which build
model.version          which model (AI systems)
tool.name              which tool was invoked (agent systems)
These are the answers to the question that recurs throughout test design: which combination produced this behavior?
Two constraints. Attributes must be intentional — if every team invents its own names, the corpus becomes unanalyzable and you are back to grep — and low cardinality wherever they will be aggregated, which is why cache.age_bucket appears above rather than cache.age_ms. OpenTelemetry's conventions also flag which attributes should be set at span creation time rather than added later, because sampling decisions may depend on them; the QA consequence is direct, in that an attribute you want to sample on must exist when the sampling decision is made.
Sampling, and what it does to your conclusions
High-volume systems generally cannot retain every trace. OpenTelemetry's documentation is direct about this: if the large majority of requests succeed within acceptable latency, you do not need all of the traces to observe the system meaningfully — you need the right sample.
Two mechanisms, with different properties:
Head sampling decides at the start of a trace, typically at the root span, usually probabilistically and often deterministically derived from the trace identifier so the decision is consistent across services. It is cheap and stateless. Its structural limitation follows from its timing: at the moment the decision is made, nothing is yet known about how the trace will end. Head sampling cannot preferentially keep failed or unusually slow traces, because failure and duration are not yet facts.
Tail sampling defers the decision until all (or most) spans in a trace have been collected, which allows policies based on the complete picture — keep traces with errors, keep traces above a latency threshold, keep a percentage of everything else. In the OpenTelemetry Collector this is implemented by a tail sampling processor with explicit policies. The cost is state: the collector must buffer traces until a decision window closes, which consumes memory and adds a delay.
The two are frequently combined: head sampling first to protect the telemetry pipeline from very high volume, then tail sampling downstream for more sophisticated retention decisions.
Sampling bias is a test-design problem
Here is the part that most directly affects QA and is almost never discussed in QA terms.
The corpus you analyze is not the system's behavior. It is a sample of that behavior, shaped by a policy someone configured for cost and operational reasons.
The distortions run in both directions. If the policy preferentially retains errors and slow requests — exactly what a well-configured tail sampling policy does, for good operational reasons — the retained corpus over-represents failure, and frequency estimates computed from it are wrong. "Payment timeouts appear in 8% of retained checkout traces" may correspond to 0.05% of actual checkouts, and a team unaware of the policy will systematically overestimate how often things go wrong. If instead the policy is uniform probabilistic sampling at a low rate, the opposite happens: a behavior occurring once per million requests may never appear at all, and rare-but-critical patterns — the payment ambiguity, the annual billing edge case, the one tenant configuration that breaks — are precisely what uniform sampling discards. And if sampling varies by service, region, or client, which happens whenever teams configure their own SDKs, cross-cutting comparisons are invalid in ways the query results do not reveal.
Practical consequences:
- Know the policy before drawing conclusions. The sampling configuration is an input to every frequency claim. Anyone doing test discovery from traces should be able to state what it is.
- Prefer metrics for frequency, traces for structure. Metrics are typically computed before sampling or with sampling adjustment, so they are the better source for "how often." Traces are the better source for "what happened." Using traces for frequency estimation is a common and quiet error.
- Consider explicit retention for QA-relevant classes. If a behavior class matters for testing, a tail sampling policy can retain it regardless of rate — retain all traces with
fallback.used=true, retain all traces withretry.count > 0, retain all traces for a tenant class under investigation. This is a small configuration change with a large effect on what test discovery can find. - Watch for sampled-away evidence during incidents. The trace that would explain the failure is disproportionately likely to be the one that was not kept, unless the policy was designed with that in mind.
The one-line version, worth repeating internally until it sticks: production evidence is an observed sample, not the system's reality.
Cardinality
A brief note, because it constrains what QA can reasonably ask for. Identifiers like user ID, request ID, session ID, and full URL are genuinely useful for investigation — they are how you get from a support ticket to a specific execution — and they are unbounded in distinct values, which makes them expensive or unusable as dimensions on aggregated metrics, where each combination creates a separate time series.
The working compromise: high-cardinality identifiers on spans and logs for investigation; low-cardinality classifications on metrics for aggregation. Asking for tenant.size_class as a metric dimension is reasonable. Asking for tenant.id is asking for a cost incident. Instrumentation requests from QA have to be operationally sane, or they will be declined, and rightly.
What should QA ask engineering to instrument?
"Instrument everything" is not a request; it is an abdication. It produces cost, noise, and privacy exposure without producing answers.
The better framing: what runtime context is required to understand quality? Which is to say — after the fact, looking at a trace, what would you need to know to determine which scenario occurred and whether it was correct?
A defensible starting list:
- Workflow or operation name. A stable, low-cardinality identifier for the logical business operation, distinct from the endpoint.
checkout.submit, notPOST /api/v3/c. - Behaviorally significant configuration. The flags and variants that change which code runs.
- Product and service version. For deployment correlation.
- Dependency identity and outcome. Which downstream was called, and how it responded in classified terms.
- Retry count and reason. Low-cardinality reason, not the exception message.
- Fallback indicator. Whether a degraded path served the request, and which one.
- Error category. A classified family, alongside (not instead of) the specific error.
- Result classification. Success, partial success, degraded success, failure — because "200" and "correct" are different claims.
- Relevant business-state class. Tenant size class, subscription model, customer segment — as classes, never as raw records.
- Tool and model identity, for AI systems, plus operation name.
And the negative space, which matters as much: no raw request or response bodies by default, no credentials or tokens, no free-text user input, no personal identifiers beyond what an explicit policy permits, no unbounded values on aggregated dimensions.
The ideal instrumentation exposes behavioral dimensions, not private content. That formulation happens to satisfy the privacy requirement and the cardinality requirement and the analyzability requirement simultaneously, which is a good sign it is the right target.
QA belongs in telemetry design
Observability is usually designed by SRE, platform engineering, or the backend teams that own each service. Those groups optimize, reasonably, for operational needs: is the system up, is it fast, where is the error coming from, can we page the right person.
Quality engineering brings a different question set. Which scenario actually occurred? Which combination of state and configuration produced this? Is this the path we intended? Does this behavior have coverage? What would we need to see to know this was correct?
Those questions imply different attributes than "is it up." Operational telemetry rarely records flag state, business-state classes, fallback usage, or result classification beyond HTTP status — not because anyone decided against it, but because nobody with those questions was in the room when the instrumentation was designed.
This is not a proposal for QA to own observability infrastructure; running collectors and controlling telemetry cost are specialized operational responsibilities that should stay where they are. It is a proposal for QA to have standing input into what runtime evidence exists. Concretely: a quality engineer in the review when a new service's instrumentation is specified, telemetry requirements attached to feature work that introduces new behavioral branches, and a path for "we could not tell what happened from the trace" to become a backlog item rather than a shrug.
Testability and observability are the same property
A system that cannot reveal which path it took is harder to test. This is not a metaphor; it is the same underlying property viewed from two directions.
If a fallback executes silently, no automated test can assert that it executed — or, more importantly, that it did not execute on the happy path, since the output is identical either way. If tool calls in an agent workflow are not instrumented, testing which tools were selected requires scraping logs or instrumenting the harness separately from production, which means the test verifies different behavior from what production exhibits. If asynchronous work does not carry trace context, verifying downstream effects requires correlating by business identifier across systems, which is slower, more fragile, and often impossible.
Design-for-testability has always included dependency injection, deterministic clocks, and seams for substitution. Runtime observability belongs on that list: a team that treats "can we tell what this did?" as a design requirement gets better diagnostics and better tests from the same investment.
Using traces inside tests
So far production evidence has been an input to test design. It can also be an input to test execution: a test that inspects the trace its own action produced.
The pattern, vendor-neutrally:
test action
   ↓
request issued with a known correlation context
   ↓
trace_id captured
   ↓
assert user-visible outcome        (the normal assertions)
   +
assert runtime behavior            (queried from the trace)
Mechanically this requires that the test can obtain the trace identifier for the request it issued — by generating and propagating context itself, or by reading a response header — that the trace is retrievable shortly afterward, and that the test tolerates ingestion delay with a bounded retry rather than a fixed sleep. Sampling must be forced on for test traffic, or the assertion becomes probabilistic in the worst possible way.
No product API is invented here. Every major backend exposes trace retrieval, and in-process approaches — an in-memory span exporter inside the service under test — avoid the ingestion problem entirely. The in-process variant is usually the better engineering choice: faster, deterministic, no external dependency, no sampling concerns.
What is worth asserting
This capability is easy to overuse, and overusing it produces some of the most brittle tests it is possible to write. The discipline is a single question asked of every proposed trace assertion:
Is this trace behavior a product requirement, a safety constraint, a performance requirement, or an incidental implementation detail?
- Product requirement. "The confirmation email event is emitted when an order is created." The user's experience depends on it. Assert it.
- Safety constraint. "The payment provider is called at most once per payment intent." "The PII redaction service is invoked before any export." "The unauthenticated path never invokes the admin service." Violations are severe and silent. Assert them.
- Performance requirement. "Permission filtering executes a bounded number of times regardless of record count." A structural assertion standing in for a latency budget. Assert it.
- Incidental implementation detail. "Service A calls service B before service C." Unless the ordering carries a requirement, this is architecture, and architecture is allowed to change. Do not assert it.
Only the first three categories usually justify coupling a test to runtime structure.
Over-specified trace shape produces brittle tests
The failure mode is worth making concrete. A test that asserts:
the trace must contain exactly:
  checkout → pricing → payment → order
in exactly that order, with no other spans
will fail when someone adds a caching layer, splits a service, introduces a legitimate fraud check, parallelizes two independent calls, or renames a span. None of those are defects. All of them will produce a red build, an investigation, and eventually a culture in which trace assertions are assumed to be false alarms.
Better assertions target properties rather than topology:
payment_authorize occurs exactly once per payment intent
create_order occurs only after a successful authorization
fallback_path does not execute when the primary path succeeds
no span in this trace targets the internal admin service
the total number of pricing_service calls is independent of cart size
Each of these survives refactoring. Each expresses something a person actually cares about. Each fails only when something is genuinely wrong.
This is the same principle that separates good black-box test design from bad: assert the contract, not the implementation. Traces expose implementation, which makes them tempting. The temptation should be resisted everywhere the implementation is not itself the requirement.
Observability-assisted end-to-end tests
The productive combination is a normal end-to-end test that additionally verifies critical internal effects the UI cannot show.
UI assertions:
    order confirmation page is displayed
    order number is present and well-formed
    displayed total matches the cart total

Trace assertions (same request):
    payment.result = authorized, exactly one authorization
    order_write.status = success
    order.created event emitted with correct correlation
    no fallback path was used
    no span reports an error
The UI assertions verify the user's experience. The trace assertions verify that the success is real rather than cosmetic — that no dark failure occurred behind a correct-looking page.
Use this selectively. Not every end-to-end test needs trace inspection; adding it everywhere doubles the maintenance surface and slows the suite. The candidates are the flows where dark failures are plausible and expensive: anything involving money, anything with asynchronous side effects the user depends on, anything with a fallback path, and anything where "it looked fine" has previously turned out to be wrong.
Test the telemetry itself
Instrumentation is code, and code regresses. When quality workflows depend on telemetry, telemetry becomes something that needs its own protection.
The regressions are mundane and common. A span stops being emitted after a library upgrade. Trace context stops propagating across an async handoff or a new HTTP client, and one trace silently becomes two. A span's status is not set on error, so failures look successful in every aggregate. An attribute is renamed and every saved query using it quietly returns nothing. Cardinality explodes because a value that was a class became an identifier. Duplicate spans appear because automatic and manual instrumentation are both active. A payload field starts being captured that should not be.
None of these break the product. All of them break the ability to reason about the product, and all will be discovered during the next incident rather than during the build that introduced them.
The proportionate response is not to assert every field on every span. It is to identify the telemetry that operational and quality workflows actually depend on and assert that:
Given a checkout request
Then a trace is emitted with a root span named checkout.submit
And the root span carries service.version, region, and result.status
And every child span that failed sets an error status and error.type
And trace context propagates to the order.created event consumer
And no span attribute contains a value matching the PII detection rules
That last assertion is worth highlighting: a test that fails when instrumentation starts capturing something sensitive is a genuinely useful control, and it is cheap to implement as a rule over the attributes a test's own traces produce.
Telemetry contracts
The natural extension is to treat critical telemetry expectations the way service contracts are treated: as agreements between a producer and its consumers, versioned and verified.
# Illustrative — not a standardized format
contract: checkout.submit
version: 3
required_attributes:
  - checkout.version
  - payment.provider
  - result.status
  - service.version
conditional_attributes:
  - retry.count:      when a retry occurred
  - retry.reason:     when a retry occurred
  - fallback.used:    when a degraded path served the request
forbidden_attributes:
  - any attribute matching customer email, card number, or auth token
cardinality_limits:
  payment.provider:   bounded enumeration
  result.status:      bounded enumeration
consumers:
  - operational alerting: payment failure rate by provider
  - qa: behavior clustering, coverage analysis
  - finance: reconciliation of authorization counts
Whether this is worth formalizing depends on scale. For a handful of services it is bureaucracy. For a large organization where dozens of teams produce telemetry that other teams' dashboards, alerts, and analyses depend on, an unwritten contract is a contract that will be broken, and the breakage will be discovered by whoever is on call.
The important part is not the file format. It is the recognition that telemetry has consumers, and consumers have expectations that survive refactoring only if they are written down and checked.
AI systems raise the value of runtime evidence
Everything above applies to a conventional distributed system, and the argument does not depend on AI in any way. But applications built around language models change the shape of the problem in a way that makes trace-driven QA more valuable rather than less.
A conventional request has a bounded execution space:
endpoint → service → database → responseAn LLM-based application does not:
request
 → retrieval
 → model (decides what to do)
 → tool call
 → external API
 → model (decides again)
 → tool call
 → model
 → response
The number of steps, the identity of the steps, and their order are determined at runtime, partly by model output. Two semantically identical user requests can produce structurally different executions — different tools, different numbers of model invocations, different retrieval results, different token counts, different latency by an order of magnitude.
This has a direct consequence for test design: the execution path is not knowable from the code. In a conventional system you can read the source and enumerate the branches. In an agent system, the branch structure is partly a property of the model's behavior on particular inputs, which means the only way to know what the system actually does is to observe what it did.
Production traces become, for these systems, close to the only reliable source of information about which tools are actually selected, how often fallback or clarification paths trigger, which model and tool combinations occur, how often retries happen, what retrieval typically returns, and where latency concentrates.
The state of GenAI telemetry conventions
Accuracy about maturity matters here, because a good deal of published material overstates it.
OpenTelemetry's GenAI semantic conventions are developed by a dedicated special interest group and, as of this writing, live in their own repository — open-telemetry/semantic-conventions-genai — having been moved out of the main semantic conventions repository. The corresponding pages on the main OpenTelemetry site now point there.
Their status is explicitly Development. The GenAI span, agent span, metric, and event documents carry that marker, which means attribute names, span names, metric names, and units may still change. This is not a technicality to gloss over: it is the difference between "you can build on this and expect it to hold" and "you can build on this and expect to migrate."
The project provides a transition mechanism. Instrumentations already emitting an older generation of the conventions are directed not to change their default output, and to offer an OTEL_SEMCONV_STABILITY_OPT_IN environment variable; setting it to gen_ai_latest_experimental selects the newest experimental conventions instead of the older ones. The documented transition plan states it will be updated to include a stable version before the conventions are marked stable. Practically, this means a given deployment may be receiving several generations of attribute names simultaneously, depending on which instrumentation libraries and versions are in play — so it is worth inspecting an actual exported span rather than inferring the schema from documentation.
Within that caveat, the conventions model a coherent picture. Operations are identified by gen_ai.operation.name, with defined values including chat, embeddings, execute_tool, invoke_agent, invoke_workflow, retrieval, plan, and several memory operations. Provider identity is gen_ai.provider.name. Model identity is split between gen_ai.request.model and gen_ai.response.model, which matters because they can differ. Token usage appears as gen_ai.usage.input_tokens and gen_ai.usage.output_tokens, with additional attributes for cached and reasoning tokens. Multi-turn interactions can be grouped by gen_ai.conversation.id where the instrumented library has one available. Errors use the core error.type attribute, which is stable and shared with the rest of the conventions.
The structure that matters most for testing is that an agent execution is modeled as a span tree, not as a sequence of isolated model calls:
invoke_agent  (the agent run)
├── chat                  (model call)
│    └── execute_tool     (tool invocation)
├── chat
└── execute_tool
That is exactly the shape needed for behavioral analysis: it preserves which tools were invoked, in what order, under which model call, with what outcome.
Content capture and privacy
One design decision in the GenAI conventions deserves specific attention because it interacts directly with the privacy section earlier.
Prompt and response content is not in the default attribute set. The conventions define attributes for it — gen_ai.input.messages, gen_ai.output.messages, gen_ai.system_instructions, gen_ai.tool.definitions — and mark them Opt-In, with explicit warnings that they are likely to contain sensitive and personal data. Instrumentations are directed not to capture them by default but to provide an opt-in.
The conventions describe a tiered set of usage patterns: by default, record no instructions, inputs, or outputs; alternatively record them on the spans, which is described as suited to situations where telemetry volume is manageable and privacy obligations either do not apply or are satisfied by the storage — pre-production environments being the given example; or store the content externally and record only references on the spans, which is the pattern recommended for production where volume or sensitivity is a concern.
For QA this is a useful default to inherit rather than fight. Full prompt capture is not a prerequisite for trace-driven testing. Structural evidence — which tools ran, in what order, how often, with what latency, ending in what outcome — supports most of the test-design work described in this article and carries a fraction of the risk. Content capture should be a deliberate decision with a stated purpose, a defined retention period, and an access model, not a default that someone enabled during a debugging session and never turned off.
Tool-call sequences as coverage evidence
A concrete example of what this evidence produces.
Engineering's expectation for a customer-support agent was that the dominant pattern would be a single lookup:
invoke_agent
├── chat
└── execute_tool  lookup_customer
Production traces show a different distribution. A substantial share of sessions follow:
invoke_agent
├── chat
├── execute_tool  search_documents
├── chat
├── execute_tool  lookup_customer
├── chat
├── execute_tool  calculate_proration
└── chat
Three tools, four model calls, three times the latency, and a composition nobody wrote a test for.
The findings available here are several, and they are different in kind:
- Under-tested composition. The tools are individually tested. The sequence is not. State passing between
search_documentsandlookup_customer— does the customer identifier extracted from a document reliably resolve? — is untested surface. - Unexpected orchestration. Why does the agent search documents before looking up the customer? Possibly correct (it needs context to know what to look up). Possibly a prompt or tool-description problem causing an unnecessary step.
- Additional dependency risk. Three tools means three failure modes and three latency contributions on a path the design assumed had one.
- Cost and latency. Four model calls instead of one, with proportional token usage.
And the essential caution: a frequent tool sequence is not automatically a correct tool sequence. It is evidence to inspect, not a specification to enshrine. The right next step is to determine whether the sequence is intended before writing anything that locks it in.
Successful behavior is not automatically the specification
This nuance is critical, and it applies well beyond AI — but AI makes it acute, because agent systems produce plausible-looking successful executions in enormous variety.
Suppose production consistently shows:
A → B → CThat is not proof that A → B → C is correct. It may be:
- An accidental workaround: users learned that the intended path fails, so they take a different route that happens to work.
- An inefficient implementation: the sequence works but does three times the necessary work.
- An undiscovered defect: the behavior is wrong and nobody has noticed because the output is plausible.
- Legacy behavior: correct three years ago under assumptions that have since changed.
- Model drift: the agent's tool selection changed after a model version update, and the new pattern is worse in a way the success rate does not show.
Production telemetry answers what happened. Requirements, product intent, and domain expertise answer what should happen. QA's job is to hold both and compare them. Encoding observed behavior into a regression test without that comparison does something specific and harmful: it converts a possible defect into a permanent requirement, and makes fixing it a test failure.
A worked AI transformation
Production evidence for a support agent shows a correlation: sessions containing the sequence search_documents → lookup_customer → calculate_proration escalate to a human at a noticeably higher rate than sessions with other tool patterns. (Illustrative.)
The wrong response is to generate a test from the pattern. There is no established defect here — only a correlation, and several plausible explanations that imply completely different fixes.
Investigate first. The candidate explanations are distinguishable with evidence already in the traces:
- Wrong tool selected. Does
search_documentsreturn relevant results in these sessions, or is it retrieving on a poorly-formed query? Check retrieval outcomes. - Unnecessary step. Would
lookup_customeralone have sufficed? Compare outcomes for sessions where the agent skipped the search. - Slow path. Is escalation driven by latency rather than by answer quality? Compare escalation rate against session duration, controlling for tool count.
- Poor final answer. Is
calculate_prorationreturning correct values that the model then presents confusingly, or incorrect values? Check tool outputs against an independent calculation. - Selection bias. Are these sessions simply the harder questions, which were always more likely to escalate? This is the explanation most often skipped and quite often the right one.
Suppose investigation establishes the fourth: calculate_proration returns correct amounts, but only for the current billing period, and the agent presents them without qualification for questions about mid-cycle changes. Now there is a defect, and the transformation proceeds normally:
- Generalized requirement: proration answers must state the period they apply to, and must not be presented for periods the tool did not compute.
- Unit test: the proration tool returns period boundaries alongside amounts, for a table of cycle configurations including mid-cycle changes and non-calendar periods.
- Integration test: the tool's output is passed to the response construction with the period preserved.
- AI evaluation: a scenario set of proration questions spanning periods, scored on whether the response states the applicable period and declines to extrapolate. This runs against the model and prompt as a unit, and needs the tolerance for variation that any model-based evaluation needs — it is a distribution check, not an equality assertion.
- Telemetry: the proration tool span records the computed period, so the same class of problem is detectable next time without a manual investigation.
The order matters more than the artifacts. Investigate, establish causality or at least a defensible risk argument, then generalize, then test. Skipping to test generation from a correlation produces tests that encode a coincidence.
None of this requires AI
Worth stating plainly, because the AI framing can make the whole approach look like a niche technique for a new class of system.
Trace-driven testing is directly applicable to e-commerce, fintech and payments, telecommunications, B2B SaaS, any microservice architecture, API platforms, and event-driven systems — none of which need a language model anywhere. The techniques that pay off most reliably are the oldest problems in distributed systems: retries, idempotency, fallbacks, partial failure, asynchronous consistency, and state combinations.
What generative AI changes is the degree. When execution paths are determined at runtime by a component whose behavior you cannot fully enumerate in advance, the value of runtime evidence rises, because the alternative sources of truth about execution structure get correspondingly weaker. AI raises the stakes on an argument that was already sound.
Comparing behavior across releases
Release verification usually asks whether error rate and latency got worse. That is a low-resolution question, and it misses an entire class of regression in which the aggregate numbers are stable and the behavior has changed.
Behavioral diffing asks a richer set:
- Has the distribution of trace shapes shifted? Is a shape that was 40% of traffic now 12%?
- Are there new service calls on established paths? Did something start participating that did not before?
- Have tool sequences changed, in agent systems?
- Has retry frequency increased anywhere, including on paths that still succeed?
- Are there new latency hotspots — spans that are individually fine but newly dominant?
- Have paths disappeared? A shape that stopped occurring is as informative as one that started.
- Has the error class mix changed at constant error rate? Fewer timeouts and more validation failures is a real change even at identical totals.
- Has the relationship between attributes and behavior changed? Does a segment that previously took one path now take another?
Each of these can move substantially while the top-line dashboard stays flat.
A new trace shape is a question, not a verdict
The most operationally useful single check in this family: after a release, which trace shapes exist now that did not exist before?
before:   service_A → service_B
after:    service_A → service_C → service_B
Three possible readings, and the evidence alone does not distinguish them:
- Intentional. Service C was added deliberately — a new validation, a new cache, a new authorization check. Correct, and the new shape is the new baseline.
- Unintended coupling. A shared library upgrade introduced a call nobody planned. It works, so nothing alerts, and a new dependency has silently joined the critical path.
- Regression. A configuration change routed traffic through a path meant for a different case.
The right response is detection and investigation, not automated blocking. Automatically failing a deployment on a new trace shape would be unworkable — shapes change constantly for legitimate reasons, and a check that cries wolf gets disabled within two sprints.
What works is generating a short, reviewable list: these five shapes are new since the last release; these two disappeared; this one grew from 3% to 19%. That list takes a few minutes to review and routinely contains something the team did not know.
Figure 8 — Trace-shape distribution before and after a release. Visual brief: Two stacked bar columns side by side, "release N" and "release N+1". Each column segmented by trace shape, segment height proportional to share of traffic, shapes color-matched across columns. In the right column: one segment appears in a distinct hatched fill (new shape), one segment present on the left is absent on the right (dropped shape, marked with a dotted outline at its former position), and one segment is visibly taller with a change annotation. Beside the columns, a summary panel: "error rate: unchanged. p95: +4%. shape distribution: 3 material changes." Placement: After the new-shape discussion. Caption: Aggregate health can be flat while the behavior underneath reorganizes. Shape distribution makes the reorganization visible.
Behavioral baselines
To diff, you need a baseline. To keep the baseline useful, resist the urge to compress it.
A workable baseline is a set of segmented descriptions rather than a single figure:
- Common paths: the dominant trace shapes per key workflow, with their approximate share.
- Latency: percentile distributions per workflow, segmented by the dimensions that matter (region, client type, tenant size class).
- Retry patterns: retry rate per dependency, including retries on successful operations.
- Error classes: the distribution across failure families, not just the total rate.
- Dependency interactions: which services participate in which workflows and at what frequency.
- Fallback rates: how often each degraded path serves traffic.
There is a strong pull toward aggregating this into a single "production behavior score" or "quality index." Resist it. Aggregation destroys exactly the information that makes a baseline useful: a composite that stays at 94 while enterprise-tenant latency doubles and the small-tenant population grows has told you nothing, and has told it to you confidently.
A baseline should preserve enough segmentation to answer which population changed. If it cannot answer that, it is a dashboard number, not a baseline.
Why not just replay production traffic?
There is an obvious shortcut lurking behind everything above: record production traffic and replay it against a pre-production environment. It has real appeal — no scenario design, automatic realism, coverage proportional to actual usage.
It is worth understanding both why it is attractive and why it should not be the primary strategy.
The problems with large raw replay suites
Privacy. Recorded traffic contains everything the privacy section warned about. Replay systems tend to capture full requests, which is the highest-risk possible form of capture, and the sanitization has to be complete rather than best-effort.
Nondeterministic dependencies. Replayed requests hit either real external services (unacceptable — you will authorize real payments, send real emails, and consume real quota) or stubs (in which case the realism you were buying is gone, because dependency behavior is exactly what you stubbed away).
Environment drift. The replay environment's data, configuration, and topology diverge from production immediately and continuously. A replay that passes tells you the request works against that environment.
Assertion difficulty. This is the deepest problem. What do you assert? Comparing the replayed response to the recorded one flags every legitimate change as a failure — new fields, changed formatting, updated pricing, different timestamps. Comparing only status codes catches almost nothing. Meaningful assertions require exactly the scenario-specific reasoning that replay was supposed to avoid.
Cost. Storing, sanitizing, and replaying meaningful volumes of traffic is a substantial ongoing engineering investment, and the run time grows with traffic rather than with risk.
Massive duplication. Ninety-nine percent of production traffic is the same few behaviors. A replay corpus is dominated by redundancy, and the rare cases you most want are the ones most likely to be absent.
No generalization. A replay suite records that a specific request worked. It does not encode why it matters, what invariant it protects, or what a future engineer should preserve when refactoring. It has no explanatory content.
When replay is genuinely useful
The balanced position: replay is a good tool for several specific jobs, and a bad foundation for a regression strategy.
- Debugging and reproduction. Replaying a specific captured request against an instrumented build is one of the fastest ways to reproduce a reported defect. This is replay used as a diagnostic, which is what it is best at.
- Performance and load testing. Realistic workload mix is exactly what synthetic load generation gets wrong, and replaying production traffic patterns at scale is a well-established technique. Here the aggregate is what matters, and individual assertions are not required.
- Compatibility validation. Verifying that a new API version, serializer, or parser handles the real distribution of inputs — including the malformed ones accumulated over years — is a job replay does very well.
- Shadow / dual-run comparison. Sending production traffic to both old and new implementations and comparing outputs is a strong technique during migrations, and it is replay in its most defensible form: real inputs, real dependencies, differential assertions rather than absolute ones.
- Deterministic read-only API behavior. For idempotent, read-only endpoints with stable outputs, replay-and-compare is a reasonable regression mechanism.
When replay is misleading
A replayed request is not necessarily a reproduced scenario, and the difference causes real confusion. The same request can behave differently because:
- The data is different. The account referenced no longer has the state it had at capture time, or does not exist.
- External systems differ. The payment provider is a sandbox. The rate limiter has different thresholds. The third party has changed its API.
- Time has changed. The request referenced a date range, a billing period, an expiring token, or a scheduled window that has passed.
- Configuration has changed. The flags active at capture are not the flags active at replay.
- Concurrency is gone. The original request executed alongside a hundred others touching related state. Replayed in isolation, the race that caused the defect cannot occur.
- The sequence is gone. The request was step six of a journey. Replayed alone, its preconditions are fabricated.
That last point is the general case: replay preserves the request; scenarios are made of state, sequence, timing, and configuration. A technique that captures only one of the five is not capturing the scenario.
Which is why this article favors generalization over replay. The generalization step — from trace to invariant to controlled scenario — is more work up front and produces an artifact that is deterministic, explicable, cheap to run, resistant to refactoring, and comprehensible to whoever inherits it. A replay corpus produces volume.
Bad telemetry produces bad test hypotheses
A dependency worth naming explicitly: every conclusion drawn from production evidence inherits the quality of that evidence.
The common defects, and what each does to test discovery:
| Telemetry defect | Effect on test discovery |
|---|---|
| Missing spans | Behaviors appear simpler than they are; whole dependencies invisible |
| Broken context propagation | One trace becomes several; causality lost; async effects unattributable |
| Inconsistent attribute names | Cross-service analysis becomes manual; clustering degrades |
| Incorrect or skewed timestamps | Latency analysis and ordering conclusions are wrong |
| Duplicate spans | Frequency and call-count analysis inflated; false N+1 findings |
| Unset error status on failure | Failure classes systematically under-counted |
| Uncontrolled cardinality | Aggregation unusable; queries slow or expensive |
| Sensitive payload capture | Evidence becomes legally unusable regardless of technical value |
| Sampling not accounted for | Frequency estimates wrong in a direction nobody has quantified |
The practical stance: before building process on top of trace analysis, spend some time validating that the traces describe reality. Pick a workflow you understand deeply. Trace it end to end. Compare what the trace says against what you know the code does. The discrepancies you find in that exercise are the discrepancies that will otherwise show up as confidently wrong conclusions six months later.
Using production evidence to prioritize and select
Two applications that sit slightly apart from test creation and are worth treating separately because they change how an existing suite is used.
Risk-based prioritization
Suites grow monotonically and run time grows with them. At some point every team faces the question of what runs where — on every commit, on every pull request, nightly, pre-release. Production evidence improves that decision by grounding it in something other than habit.
Signals worth weighing:
- Workflow frequency. How much real usage depends on this area.
- Recent production failures. Where things have actually broken lately.
- Changed trace shapes. Where behavior has recently shifted.
- Dependency instability. Which integrations are currently degrading.
- Business criticality. Which flows carry revenue, regulatory, or safety weight.
- Change frequency. Where the code is actively moving.
Again, no magic score. The goal is a prioritization conversation informed by evidence, held periodically, with an outcome — not a number that pretends to be objective. A composite index here would have the same problem as the composite baseline: it would be stable while the components that mattered moved in opposite directions.
Selective regression
A more advanced application, and one worth flagging as harder than it looks.
Suppose a change touches the pricing service. Static dependency analysis says which services call pricing. Production traces say something more useful — which user-visible workflows actually involve pricing, and in what proportion:
pricing_service participates in:
   checkout ................... very high volume
   subscription_renewal ....... high volume, revenue-critical
   plan_upgrade ............... moderate volume
   invoice_generation ......... low volume, monthly, high impact
   quote_preview .............. moderate volume
   admin_price_override ....... rare, high privilege
That list is a better starting point for "what should we regression test for this change" than either the call graph or intuition, because it is weighted by real usage and it includes the paths a call graph shows as equivalent but production shows as wildly different in consequence.
Two honest caveats. First, dynamic call information is a lower bound: it shows the paths that occurred during the observation window under the sampling policy in force, not all possible paths. Conditional and rare paths can be missing, and those are frequently the risky ones. Second, mapping a code change to the affected trace patterns requires reliable linkage between code units and spans, which most systems do not have out of the box.
Treat trace-informed test selection as an augmentation to conventional impact analysis and a tie-breaker for prioritization — not as a mechanism for deciding what to skip. The failure mode of getting it wrong is asymmetric: you ship the regression you chose not to test for.
The dependency graph production actually has
A related and immediately useful artifact. Architecture documentation says:
A → BProduction says:
A → B                          always
A → C                          when feature X is enabled (18% of traffic)
A → D                          during fallback (0.4% of traffic)
A → B → E                      for enterprise tenants only
A → F                          from the async worker path only
The observed graph is richer, current, and weighted. It informs integration test scoping (which pairs actually interact), blast-radius analysis (what breaks if D is down, and for whom), contract testing priority, and onboarding — a new engineer learns more from the observed graph in ten minutes than from the diagram in an hour.
It also, reliably, contains at least one edge that surprises someone senior.
Contract testing
If traces repeatedly show schema or contract failures at a particular service boundary — deserialization errors, unexpected nulls, enum values the consumer does not recognize, fields that changed type — that is direct evidence of a missing or insufficient pre-production contract.
The useful question production answers is not how to do contract testing but where: which of the fifty integration boundaries in this system deserve the investment. The boundaries generating contract failures at runtime have nominated themselves.
Worth being explicit that this does not mean trace replay substitutes for contract testing. They operate at different times and prove different things. Contract tests prevent incompatible changes from being released; trace evidence tells you which boundaries are already failing and therefore where the prevention is missing. The evidence directs the investment; it does not perform it.
Making it a process rather than a hobby
Everything described so far can be done by one motivated engineer with query access and a free afternoon. Done that way, it produces a handful of good findings and then stops, because the person moves teams or gets busy. Turning it into a capability requires a small amount of structure — and a smaller amount than most process proposals demand.
Observability is not quality
The overclaim to avoid, stated first because it is the one that lets organizations believe they are already doing this.
Having traces, logs, dashboards, and a well-configured collector does not mean the product is well tested. It means the product is observable. Those are different properties, and the gap between them is a set of human and process activities that nothing installs.
Telemetry becomes a quality-engineering capability only when there is a working loop:
observe      evidence is collected and is good enough to reason about
   ↓
interpret    someone looks at it and asks what it means for correctness
   ↓
prioritize   findings are ranked against risk and effort
   ↓
encode       the important ones become durable engineering artifacts
Most organizations do the first step well, the second reactively during incidents, the third informally, and the fourth almost never. The last step is where the value is: without conversion into a durable artifact, every insight expires with the attention of the person who had it.
Dashboard culture versus a learning loop
A dashboard shows error rate, latency, and traffic. It answers "is the system healthy right now," which is the operational question and a good one.
The quality question is different and no dashboard is shaped to answer it:
Which changes in runtime behavior imply a new or missing regression scenario?
That question requires comparison over time, structural analysis rather than aggregate, and a person willing to decide what matters. It is a review activity, not a monitoring activity, and it does not happen incidentally. Watching dashboards more attentively will never produce it.
A recurring production-signal review
The lightweight structure that makes the loop real is a short, recurring session — thirty to sixty minutes, roughly weekly or per release — where a small group looks at production evidence with a testing question in mind.
Inputs, prepared in advance rather than explored live:
- New or significantly changed error clusters since the last review.
- Trace shapes that appeared, disappeared, or materially changed share.
- Workflows that became substantially more common.
- Fallback and retry rates by dependency, with trend.
- Traces linked from support tickets or escalations.
- High-value paths identified as having no test representation.
- Notable latency distribution changes, segmented.
Outputs, and this is what distinguishes the session from a status meeting — every input leaves with a decision:
ignore                  understood, not worth acting on, reason recorded
monitor                 watch it, revisit next time
fix                     defect confirmed, goes to the backlog
instrument better       we could not tell what happened — telemetry gap
add regression test     encode it, at a named level
add performance test    latency or scale concern with a defined budget
add fault-injection     dependency behavior worth simulating
retire coverage         behavior no longer occurs, test is a maintenance cost
Two properties matter more than the agenda. The list of inputs must be short enough to actually get through — six to ten items, prepared, not a live query session. And every item must leave with one of those outputs, including "ignore," which is a legitimate and frequently correct decision that should be recorded so the same signal is not rediscovered monthly.
QA should not become a log-monitoring team
An important boundary. The purpose is not for quality engineers to spend their days scrolling through traces. That is neither scalable nor a good use of the skill set, and a QA team reorganized around telemetry monitoring will do worse at both jobs.
The scalable version pushes mechanical work into tooling and reserves human attention for interpretation:
- Automated clustering produces the candidate shapes; humans do not read individual traces.
- Automated diffing produces the change list; humans do not compare releases manually.
- Saved queries and alerts surface defined conditions — a fallback rate crossing a threshold, a new shape on a critical path, an error class appearing for the first time.
- Support and incident tooling links tickets to trace evidence automatically where identifiers permit.
- Targeted analysis happens only on the short list that survives all of the above.
Human time goes to the questions machines are bad at: is this intended, does it matter, what does it generalize to, and what should we do about it.
Ownership
The loop crosses organizational boundaries, and assigning all of it to QA guarantees it will not work.
| Function | Responsibility in this loop |
|---|---|
| SRE / platform | Telemetry infrastructure, collection pipeline, sampling policy, retention, cost |
| Service developers | Instrumenting their own services, semantic convention compliance, span quality |
| QA / quality engineering | Scenario modeling, behavior coverage analysis, regression strategy, test level decisions |
| Product | Business criticality, intended behavior, what "correct" means |
| Support | User-facing symptoms, recurring complaints, ticket-to-trace linkage |
| Security / privacy | What may be captured, retained, and moved to lower environments |
The pattern that works in practice: the loop has a named owner who convenes it (often quality engineering, sometimes a platform team), each function contributes its input, and the outputs land in the backlog of whichever team owns the affected service. Everything else is variation.
A trace-to-test worksheet
For a single production signal, the questions that need answers before anything is built. This is deliberately a set of questions rather than a template to fill in mechanically — several of them have "no test" as a correct answer.
Signal. What did we observe? One sentence, in behavioral terms rather than symptom terms.
Evidence. Which trace, log, metric, or feedback supports it? Enough specificity that someone else can retrieve it.
Frequency. How common is it — and under which sampling policy? State the policy alongside the number.
Impact. What happens if this is wrong? Money, data, access, availability, trust, compliance. Be concrete.
Intent. Is the observed behavior expected? This is the oracle question, and it usually requires someone outside QA to answer. If the answer is "we don't know," that is the finding, and the next step is a conversation, not a test.
Pattern. What generalizes? State the invariant in domain language, without reference to the specific trace.
Variability. Which details are incidental? Explicitly list the attributes from the evidence that do not affect behavior, so they do not leak into the test.
Risk. What defect class is this? Idempotency, ordering, partial failure, staleness, permission, precision, concurrency, resource scaling.
Test level. Unit, integration, contract, API, end-to-end, performance, resilience, or AI evaluation — with a stated reason for choosing that level over a cheaper one.
Environment. What must be controlled: dependency behavior, clock, feature flags, data volume, concurrency, region.
Assertion. What must remain true? Outcome-level where possible; structural only where the structure is the requirement.
Data. What sanitized, synthetic fixture represents the production condition, and where does it live?
Provenance. Which production signal caused this test to exist? A durable reference, not a memory.
Figure 9 — The trace-to-test worksheet. Visual brief: A single-column form layout, thirteen labeled fields in the order above, with a worked example filled into a second parallel column using the payment-timeout case. Visually separate the fields into three groups with subtle dividers: evidence (signal, evidence, frequency, impact), judgment (intent, pattern, variability, risk), and construction (test level, environment, assertion, data, provenance). Highlight the "intent" field — it is the one that cannot be answered from telemetry. Placement: Immediately after the worksheet section. Caption: The middle group is the work. The first group is available from tooling; the third follows once the middle is settled.
Reference example: one week at a SaaS commerce platform
To make the whole method concrete, here is a full pass over a week of production evidence from a generic multi-tenant commerce platform. No specific company, no invented statistics presented as measurement — every figure below is illustrative and exists to show the reasoning.
The platform serves both self-serve and enterprise tenants, processes payments through two providers, runs a promotion engine, allocates inventory across warehouses, and sends transactional email asynchronously. Eight patterns surfaced from clustering and diffing.
Pattern A — Standard checkout
checkout → auth → cart → pricing → inventory → payment → order → confirmation
volume: dominant; error rate: very low; p95: 1.2 s
Why it matters. This is the platform's core revenue path and the majority of traffic.
Regression asset? Yes, and it almost certainly already exists — but the existing test probably uses a one-item cart and default configuration. The asset that needs to change is the fixture, not the test: align the default checkout fixture with the modal production shape (multi-item cart, returning customer, stored payment method).
Level. One end-to-end test plus the existing API-level coverage.
Controlled. Payment provider stub, deterministic pricing rules, fixed clock, seeded catalog.
Asserted. Order total equals line items minus discounts plus tax; order created once; confirmation event emitted; p95 within budget.
Pattern B — Promotion combined with loyalty discount
checkout → auth → cart → loyalty → pricing → inventory → payment → order → confirmation
volume: high; error rate: low; notable: pricing span duration ~2x Pattern A
Why it matters. Discount stacking is where pricing defects concentrate, and pricing defects are directly financial in both directions — undercharging costs margin, overcharging costs trust and potentially compliance.
Regression asset? Yes, and primarily at the unit level, which is where the combinatorics belong.
Level. Unit tests over the discount engine with a stacking matrix — promotion alone, loyalty alone, both, both with a maximum-discount cap, both where one excludes the other, both applied to a partially out-of-stock cart. Plus one API-level test proving the engine's result reaches the order correctly.
Controlled. Deterministic promotion definitions, fixed loyalty tier, fixed clock (promotions have validity windows).
Asserted. Discount precedence and cap rules; total never negative; discount recorded on the order for reconciliation; no double application.
Pattern C — Payment timeout followed by successful retry
checkout → … → payment_authorize [timeout] → retry [success] → order → confirmation
volume: rare; user-visible errors: none; concentrated in provider B
Why it matters. Ambiguous provider responses can duplicate financial operations. Severity is high; frequency is irrelevant to the decision.
Regression asset? Yes — the highest-value asset in this list.
Level. Unit (idempotency key derivation), integration (retry behavior against a controlled provider stub), one end-to-end (recovery produces a single charge and a single order), telemetry (retry attributes present).
Controlled. Provider stub that accepts then delays past the client deadline; deterministic idempotency key source.
Asserted. At most one authorization per payment intent; one order; matching idempotency key across attempts; retry.count and retry.reason emitted.
Pattern D — Inventory split across two warehouses
inventory → warehouse_reserve[eu-1] + warehouse_reserve[eu-3] → order → fulfillment_split
volume: moderate; error rate: low; notable: partial reservation failures observed twice
Why it matters. Distributed reservation is a partial-failure surface. If one warehouse reserves and the other fails, the system must either compensate or fail cleanly — and "twice this week" means the path is exercised in production without ever being exercised in CI.
Regression asset? Yes, targeted at the failure mode rather than the happy path.
Level. Integration with fault injection.
Controlled. Inventory service stub returning: both reservations succeed; first succeeds and second fails; first succeeds and second times out; both fail.
Asserted. No stranded reservations after any failure combination; order either created complete or not created; user-facing message accurate; compensating release emitted where applicable.
Pattern E — Successful fallback after recommendation-service failure
product_page → recommendations [unavailable] → cached_recommendations [success]
volume: moderate; user-visible errors: none; cache age observed up to 14 h
Why it matters. A degraded path is silently serving real traffic, and the staleness bound is larger than anyone specified — because nobody specified one.
Regression asset? Yes, plus a product decision that has to happen first: what is the acceptable staleness for recommendations, and should stale results be labeled?
Level. Integration with fault injection; a monitoring change is arguably the higher-value output here.
Controlled. Recommendation service unavailable; cache pre-populated at defined ages either side of the agreed bound.
Asserted. Fallback engages; output is schema-valid and non-empty; content beyond the staleness bound is not served; fallback.used=true is emitted so the rate is measurable.
Pattern F — Slow enterprise checkout from entitlement lookup
checkout → … → entitlement_service [p95 1.9 s] → …
volume: low count, high revenue share; correlates with entitlement override count
Why it matters. The slowest experience belongs to the highest-value customers, and the driver is a data-volume characteristic that only enterprise tenants have.
Regression asset? Yes — performance, with a structural assertion alongside the timing one.
Level. Performance test with a large-tenant fixture.
Controlled. Synthetic tenant with an override count at a realistic level (say 400, based on the observed distribution rather than a round number), fixed entitlement rules, warm and cold cache variants.
Asserted. Entitlement resolution within a defined budget at that scale; number of downstream calls does not grow linearly with override count; result correctness at scale, not just speed.
Pattern G — Rare cross-region currency inconsistency
checkout → pricing [currency=CHF] → payment [currency=EUR] → order
volume: very rare (single digits); user impact: incorrect charge amount
Why it matters. Wrong currency is a financial defect with regulatory and refund consequences, and the rarity is exactly what let it persist.
Regression asset? Yes, and the correct level is much lower than the trace's breadth suggests.
Level. Unit tests over currency resolution and conversion; one integration test proving the resolved currency propagates unchanged from pricing to payment.
Controlled. Table of tenant region × customer region × catalog currency × payment provider supported currencies, including the mismatch cases.
Asserted. A single currency is resolved and carried through the whole flow; mismatch is rejected rather than silently converted; conversion, where legitimate, uses the documented rate source and rounding rule.
Pattern H — Asynchronous confirmation email failure
order.created → notification_worker [failed] → (no retry span, no alert)
volume: low but persistent; user-visible errors: none; user impact: no confirmation received
Why it matters. A textbook dark failure. The order is correct, the API returned 201, the UI showed confirmation, and a subset of customers received nothing — which converts directly into support volume.
Regression asset? Yes, plus an instrumentation gap: the worker's failure produced no retry and no alert, which means nobody would have found this without looking at trace shapes.
Level. Integration at the consumer level; monitoring change; telemetry assertion.
Controlled. Email provider stub returning success, transient failure, and permanent failure.
Asserted. Transient failure triggers bounded retry; permanent failure is recorded in a queryable state rather than dropped; the failure is visible in telemetry with a classified reason; the order remains valid regardless of notification outcome.
Figure 10 — Production evidence map for one week. Visual brief: A grid of eight cards, A through H. Each card contains a miniature span-tree glyph at the top, then four compact rows: volume (a small bar), impact (a filled-dot severity scale), has coverage today (yes/partial/no), and proposed level (a short label). Colour-code the "has coverage today" row so the gaps are visible at a glance. Below the grid, a single summary strip: "8 patterns → 3 new tests at unit level, 4 at integration, 1 end-to-end, 2 performance, 3 fault injection, 2 monitoring changes, 1 instrumentation fix." Placement: After Pattern H. Caption: The distribution across levels is the finding. Eight system-wide observations produced one end-to-end test.
The resulting portfolio
Consolidating the eight patterns:
| Level | Assets added | Sourced from |
|---|---|---|
| Unit | Idempotency key derivation; discount stacking matrix; currency resolution table | C, B, G |
| Integration | Payment retry against provider stub; warehouse partial-reservation failures; recommendation fallback; notification consumer retry | C, D, E, H |
| API | Discount engine result reaching the order; currency propagation pricing → payment | B, G |
| Contract | Payment adapter idempotency-key contract | C |
| End-to-end | Checkout recovery after an ambiguous provider response | C |
| Performance | Entitlement resolution at enterprise override scale | F |
| Fault injection | Inventory partial failure; recommendation unavailability; email provider failure | D, E, H |
| Monitoring | Fallback rate by dependency; notification failure rate; retry rate on success | E, H, C |
| Instrumentation | retry.reason on payment; fallback.used on recommendations; notification worker error status |
C, E, H |
| Fixture change | Default checkout fixture aligned with modal production shape | A |
Three observations about this table.
The end-to-end count is one. Eight system-wide production observations produced a single new end-to-end test, because seven of them were better served at a cheaper level. This is the expected distribution when level selection is done deliberately, and it is the opposite of what happens when production evidence is converted to tests naively.
Three of the outputs are not tests at all. Instrumentation fixes and monitoring changes are legitimate, sometimes optimal, responses to a production signal. "Add a test" is not the only valid output of the loop.
The single fixture change to Pattern A may deliver more value than several of the new tests, because it improves the realism of every existing checkout test at once. Fixture realism is an under-considered lever.
No claim is made here about defect reduction, time saved, or return on investment. Those numbers would be invented, and inventing them would undermine the argument.
The production-to-regression record
Tests derived from production should carry their origin. Without it, a test that looks strange gets deleted by the next engineer who encounters it, taking its reason with it.
A concise record, attached to the test as metadata, a docstring, or a linked document:
source_signal:        production trace cluster, payment authorization timeout
                      first observed 2026-03-14, recurring
evidence_reference:   trace pattern PAY-TIMEOUT-RETRY; incident INC-2291
runtime_context:      service.version 4.18.x; payment.provider B;
                      all regions; no flag dependence
observed_behavior:    authorization request exceeded client deadline;
                      client retried; provider recorded two authorizations
                      for one payment intent
expected_behavior:    at most one authorization per payment intent
                      regardless of client retry
pattern:              ambiguous response to a non-idempotent external
                      operation
frequency:            rare (~0.2% of authorizations, tail-sampled corpus —
                      treat as an upper bound)
impact:               duplicate customer charge; manual reconciliation;
                      chargeback exposure
test_target:          payment adapter; checkout orchestration
test_level:           unit (key derivation), integration (retry behavior),
                      e2e (recovery), telemetry (attributes)
controlled_deps:      payment provider stub — accepts request, delays
                      response past client deadline
test_data:            synthetic payment intent; no production data
assertion:            exactly one authorization per intent; one order;
                      identical idempotency key across attempts
provenance:           this test exists because production produced two
                      authorizations for one intent under a timeout
lifecycle:            revisit if the payment adapter is replaced, if the
                      provider adds a native idempotency guarantee, or if
                      the ambiguous-response pattern has not recurred in
                      four quarters
The provenance and lifecycle fields do the work that ordinary test metadata does not.
Provenance answers the question every engineer eventually asks about an unusual test: why does this exist? Without an answer, the choices are to preserve it indefinitely out of superstition or to delete it and rediscover the defect. Both are bad, and the second is worse.
Lifecycle answers a question almost nobody asks and everybody should: when should we reconsider this? Tests accumulate because nothing ever triggers a review. A written condition — a dependency replaced, a feature removed, a period elapsed without recurrence — creates a legitimate opportunity to retire the test with reasoning rather than by attrition.
A regression suite as organizational memory
This suggests a way of thinking about the suite that is more useful than "a set of checks."
Production generates experiences. Most of them are forgotten: the engineer who debugged the timeout moves teams, the incident document is archived, the Slack thread ages out. A regression test is a mechanism for making one of those experiences persist in executable form.
Seen that way, a mature regression suite is a compressed engineering memory of the failures and behaviors the system has already had to survive. Each test is a lesson the organization learned, encoded so that it does not have to be learned again.
Production evidence improves that memory in two ways. It supplies richer raw material — the actual execution, the actual state, the actual dependency behavior, rather than a reconstruction from a bug report. And it supplies the reason, which is the part that decays fastest.
The failure mode is dead knowledge. Over years, tests remain while the reasoning evaporates. Someone encounters a test asserting that a particular service is called exactly once and cannot determine whether that is a safety requirement or an artifact of how the code looked in 2021. They cannot safely change it, so they work around it. The test is now a constraint on the system with no known justification — which is the worst possible state for a test to be in.
A trace-linked record prevents this specific decay by preserving the original behavior, the original risk, the affected component, and the reason for the assertion. That is not documentation for its own sake; it is what makes the future decision to keep, change, or delete the test a decision rather than a guess.
Postmortems should produce artifacts, not only prose
A closing point on process, because it is where the loop most often breaks.
Incident reviews reliably produce narrative: what happened, why, what we learned. They less reliably produce anything that changes the system's behavior under the same conditions.
A useful discipline is to require every incident review to answer one question explicitly:
Which engineering artifact now makes recurrence less likely?
The valid answers include:
- An automated test at a named level.
- A stated invariant, encoded somewhere it will be checked.
- A monitor or alert on the condition that preceded the failure.
- A performance baseline with a defined budget.
- A fault-injection scenario reproducing the dependency behavior.
- An instrumentation change making the condition detectable next time.
- A design change removing the failure mode entirely — the best answer, and the one most often skipped in favor of a test that detects a problem that could have been designed away.
Not every incident needs all of these, and a small incident may legitimately need none. But a review that produces only a document has converted an expensive experience into text, which is the least durable form of engineering knowledge available.
Figure 11 — The closed quality learning loop. Visual brief: A cycle of five nodes, drawn as a loop rather than a linear pipeline. Production → Evidence (traces, logs, metrics, feedback) → Interpretation (clustering, review, judgment — draw this node with a person icon to mark it as the human step) → Regression assets (tests, monitors, fixtures, invariants) → Deployment → back to Production. Add a second, shorter inner arc from Interpretation back to Evidence labeled "instrumentation gaps," showing that the loop also improves its own inputs. Mark the Interpretation → Regression assets arrow as "the conversion step — where observability becomes quality engineering." Placement: Before the final section. Caption: Most organizations have the top half of this loop. The conversion step is what makes it a loop rather than an arc.
QAtronic helps engineering teams turn production failures and runtime behavior into focused automated regression coverage across APIs, distributed workflows, and AI-enabled systems — including the part that is harder than the tooling: deciding which runtime evidence deserves a durable test, and at which level.
The test suite should remember what production has already taught you
Return to where this started.
POST /checkout                            1.91 s   status=200
├── authenticate_user ..................... 31 ms
├── get_cart .............................. 42 ms
├── pricing_service ....................... 84 ms
├── inventory_service .................... 121 ms
├── payment_authorize .................... 604 ms
│    └── retry ........................... 588 ms
├── create_order .......................... 73 ms
└── send_confirmation .................... 214 ms
At the beginning this was operational telemetry: one successful request, one increment to a counter, one sample in a histogram, retained for two weeks and then deleted.
Read with the questions this article has been building, the same eight spans contain a workflow that constitutes a large share of the platform's real usage; a dependency composition no test exercises as a unit; a retry path carrying a third of the request's duration and an unverified idempotency requirement; a data shape — seventeen items — that no fixture reproduces; a feature configuration that determines which code executes; a customer state that no seeded account has; a latency contributor sitting inside the user-visible request for reasons nobody has revisited; and, taken together, a prioritized list of things worth testing that no planning meeting produced, because no planning meeting had access to it.
The trace did not change. What changed is that somebody asked it a different question.
This is the whole argument, and it is deliberately modest. Production traces are not better than tests. They are not a substitute for requirements, for unit testing, for exploratory work, for threat modeling, or for the judgment of an engineer who understands the domain. A trace cannot tell you whether a price was correct, whether a rule was respected, or whether the thing the system did was the thing it should have done. Those questions need an oracle, and the oracle is not in the telemetry.
What production traces offer is a class of evidence that pre-release test design cannot generate on its own: evidence of how the system is actually being used, and how it actually behaves under real combinations of state, data, dependency behavior, timing, and intent. That evidence is produced continuously, at no marginal cost, by the system doing its job. In most organizations it is used to answer one question — what broke — and then discarded.
The larger question it can answer is: what did production teach us that our regression suite still does not know?
A suite that never asks it remains a faithful record of what a group of engineers, at various points in the past, expected users to do. That record was a good-faith effort and it was correct on the day it was written. It ages badly, and it ages invisibly, because nothing inside the suite can tell you how far the system has drifted from the model.
A suite that does ask it becomes something different: a growing account of what the system has actually been asked to survive — every ambiguous response it had to disambiguate, every dependency failure it had to absorb, every data shape it did not anticipate, every path users found that nobody designed. That is a fundamentally more durable thing to own, and the difference between the two is not tooling. It is whether anyone converts evidence into an artifact.
Production should never be where testing begins. It should be, permanently, where testing keeps learning what to ask.
Sources
OpenTelemetry — project and concepts
- OpenTelemetry, What is OpenTelemetry? — https://opentelemetry.io/docs/what-is-opentelemetry/
- OpenTelemetry, Sampling (head and tail sampling concepts) — https://opentelemetry.io/docs/concepts/sampling/
- OpenTelemetry blog, Tail Sampling with OpenTelemetry: why it's useful, how to do it, and what to consider — https://opentelemetry.io/blog/2022/tail-sampling/
- OpenTelemetry blog, OpenTelemetry is a CNCF Graduated Project, May 21, 2026 — https://opentelemetry.io/blog/2026/otel-graduates/
- Cloud Native Computing Foundation, CNCF Announces OpenTelemetry's Graduation, May 21, 2026 — https://www.cncf.io/announcements/2026/05/21/cloud-native-computing-foundation-announces-opentelemetrys-graduation-solidifying-status-as-the-de-facto-observability-standard/
- CNCF project page, OpenTelemetry (maturity history) — https://www.cncf.io/projects/opentelemetry/
OpenTelemetry — semantic conventions
- OpenTelemetry, Semantic Conventions (v1.44.0 index, including the note that Generative AI conventions have moved to a dedicated repository) — https://opentelemetry.io/docs/specs/semconv/
- OpenTelemetry, GenAI attribute registry — https://opentelemetry.io/docs/specs/semconv/registry/attributes/gen-ai/
- OpenTelemetry, semantic-conventions-genai repository — https://github.com/open-telemetry/semantic-conventions-genai
- OpenTelemetry, Semantic conventions for generative client AI spans (status: Development; operation names; token usage attributes; opt-in content capture and the external-storage pattern; attributes recommended at span creation time for sampling) — https://github.com/open-telemetry/semantic-conventions-genai/blob/main/docs/gen-ai/gen-ai-spans.md
- OpenTelemetry, Semantic conventions for GenAI agent spans — https://github.com/open-telemetry/semantic-conventions-genai/blob/main/docs/gen-ai/gen-ai-agent-spans.md
- OpenTelemetry, Semantic conventions for Anthropic client operations (illustrating the
OTEL_SEMCONV_STABILITY_OPT_INtransition mechanism and thegen_ai_latest_experimentalvalue) — https://opentelemetry.io/docs/specs/semconv/gen-ai/anthropic/
Status note: the GenAI semantic conventions were marked Development at the time of writing. Attribute names, span names, metric instruments, and units may change. Verify against the repository before depending on any specific attribute, and inspect an actual exported span rather than inferring the schema from documentation, since instrumentation libraries may emit different generations of the conventions simultaneously.
All numeric examples in this article — traffic proportions, latency figures, error rates, cart sizes, override counts, and pattern volumes — are illustrative and are used to demonstrate reasoning. They are not measurements of any real system.



