
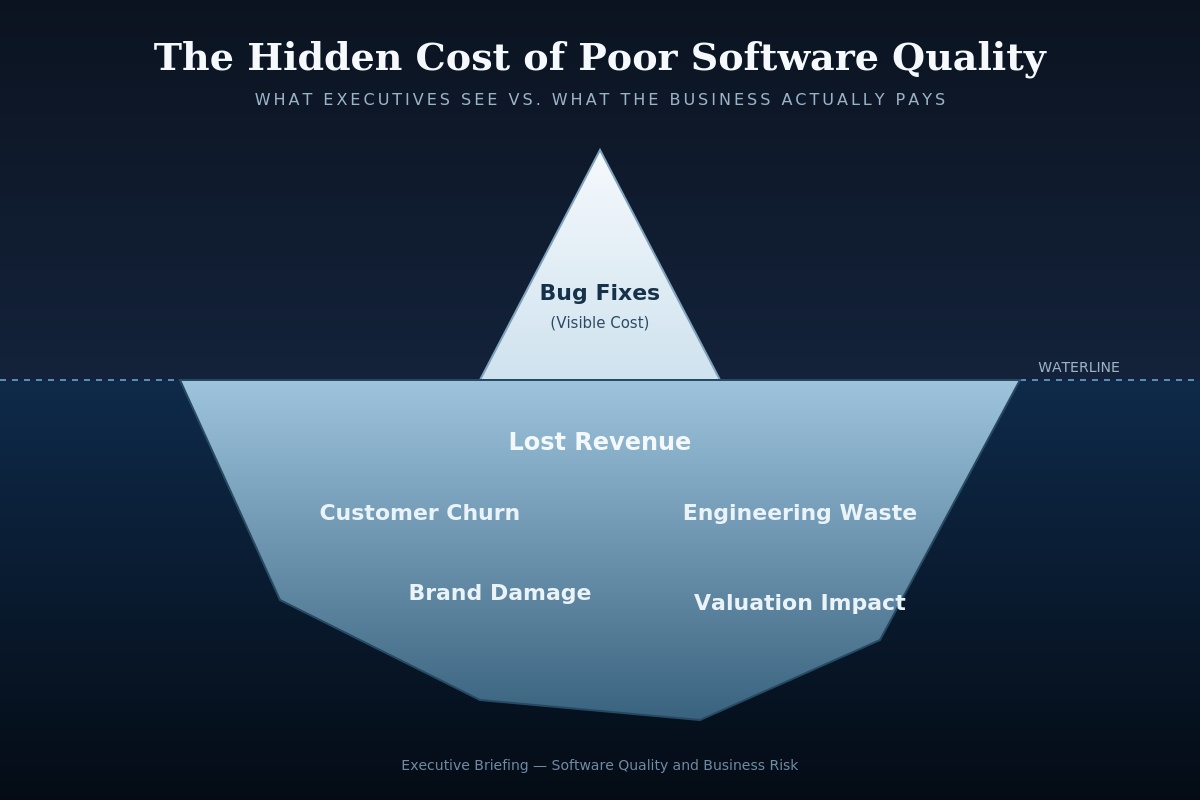
The Hidden Cost of Poor Software Quality
Most companies underestimate software quality costs because they only measure what is visible: the hours spent fixing bugs, the price of a QA team, the line item for testing tools. What they fail to measure is the business damage that occurs around those bugs — the renewal that quietly didn't happen, the enterprise deal that stalled in due diligence, the engineer who spent three days firefighting instead of shipping the feature that would have closed a competitive gap.
This is the defining blind spot in how executives evaluate engineering performance. Quality is treated as a technical attribute, something owned by engineering and reported in sprint retrospectives. In reality, quality is a balance-sheet item. It shows up in churn curves, in sales cycle length, in gross margin, and increasingly, in valuation multiples.
Across the industry, the data is consistent and alarming. Research from the Consortium for Information & Software Quality has put the annual cost of poor software quality in the United States alone in the range of $2.41 trillion, spanning operational failures, unsuccessful development projects, and the accumulated burden of technical debt. Separate analysis from IT operations research consistently finds that unplanned downtime and critical incidents cost large enterprises thousands of dollars per minute, with some studies placing the average cost of a single hour of downtime well above six figures for mid-to-large organizations. Gartner has repeatedly noted that the average cost of IT downtime is in the range of $5,600 per minute, a figure that varies by industry but never trends toward "negligible."
These numbers are not abstractions. They are the aggregate of thousands of small, invisible failures: a checkout flow that times out under load, a sync error that silently corrupts customer data, an API that degrades just enough to push integration partners toward a competitor. None of these events appear as a single dramatic outage. They appear as a slow, compounding tax on growth.
This article is written for the people who carry responsibility for that growth — CTOs, founders, CEOs, VPs of Engineering, product leaders, and engineering directors — and it makes a single argument: poor software quality is not a technical defect. It is a business liability that behaves like compounding debt, and it should be managed with the same discipline as financial risk.
We will move through the full anatomy of that liability: where it hides, how it compounds, which departments absorb the cost, how it erodes valuation, and what a rigorous executive response looks like.
1. Poor Software Quality Is a Business Problem
Engineering organizations tend to frame quality in terms of defect counts, test coverage, and incident frequency. These are legitimate engineering metrics, but they are the wrong primary lens for an executive audience, because they describe symptoms rather than business consequences.
Every technical failure has a translation into a business outcome. The work of a quality-literate executive is to insist on that translation, every time.
Quality affects every function in the company, not just engineering:
- Revenue — Performance degradation and broken flows directly suppress conversion and checkout completion rates.
- Brand — Public-facing failures are now public by default; social platforms turn outages into brand events within minutes.
- Sales — Prospects in evaluation cycles run live trials; a bad demo or trial experience can silently end a deal with no explanation given.
- Marketing — Campaigns that drive traffic into a degraded product convert that spend into churn rather than growth.
- Support — Every unresolved class of bug becomes a recurring ticket category, inflating headcount needs indefinitely.
- Engineering — Defect-driven work crowds out roadmap work, and the best engineers burn out fastest under firefighting conditions.
- Investor confidence — Diligence processes increasingly include technical and security review; quality issues surface as risk flags that affect terms.
Technical Problem → Business Consequence
| Technical Problem | Business Consequence |
|---|---|
| Slow API response times | Lost customers, abandoned transactions |
| Flaky checkout flow | Reduced conversion, revenue leakage |
| Data sync errors | Loss of customer trust, support escalations |
| Inconsistent UI behavior across devices | Increased churn, lower NPS |
| Unhandled edge cases in core workflows | Support cost inflation, brand complaints |
| Fragile third-party integrations | Partner attrition, delayed go-lives |
| Weak monitoring and alerting | Extended outage duration, larger revenue loss per incident |
| Security vulnerabilities discovered late | Compliance risk, deal delays, reputational exposure |
| Poor regression coverage | Recurrent defects, declining release confidence |
| High deployment failure rate | Slower release cadence, delayed competitive response |
The pattern is structural, not incidental: every row in the left column is owned by engineering. Every row in the right column is owned by the business. This is precisely why software quality cannot remain a delegated, invisible concern at the executive level. The translation layer between the two columns is where most companies have no formal process at all — no owner, no metric, no reporting line. That gap is where the hidden cost lives.
2. The Cost Pyramid of Poor Quality
Classic quality-maturity pyramids describe testing process — unit tests at the base, manual exploratory testing at the top. That model is useful for engineering teams. It is useless for executives, because it never touches money.
The Cost Pyramid of Poor Quality replaces that framing entirely. It organizes cost by visibility, not by testing layer. The further down the pyramid, the larger and less measured the cost — and the less likely it is to appear in any board report.
                    ▲
                   / \
                  / 1 \          VISIBLE COSTS
                 /-----\         Bug fixes, hotfix deployments,
                /   2   \        incident response hours
               /---------\
              /     3     \      ENGINEERING WASTE
             /-------------\     Context switching, rework,
            /       4       \    delayed sprints, on-call burden
           /-----------------\
          /         5          \  LOST OPPORTUNITIES
         /----------------------\ Delayed features, stalled deals,
        /            6            \ missed market windows
       /------------------------------\
      /              7                  \  BRAND DAMAGE
     /------------------------------------\ Churn, reputation,
    /__________________________________----\ word-of-mouth erosion
Layer 1–2 — Visible Costs. This is the only layer most finance and engineering reporting captures: the hours spent fixing a defect, the cost of an emergency deployment, the time logged against an incident ticket. It is real cost, but it typically represents less than 20% of the total financial impact of a quality failure.
Layer 3–4 — Engineering Waste. Below the surface, every bug triggers a chain of indirect costs: a developer pulled off planned work, a standup consumed by incident discussion, a sprint that quietly slips. This layer rarely appears in financial reporting because it is distributed across many people in small increments, but in aggregate it is frequently the single largest driver of "low velocity" complaints from product leadership.
Layer 5–6 — Lost Opportunities. This is the layer executives feel most acutely but diagnose least accurately. A feature that ships eight weeks late because the team was absorbing defect load doesn't show up as a "quality cost" anywhere — it shows up as "we lost the deal because we didn't have the integration the competitor had." The causality is almost never traced back to quality.
Layer 7 — Brand Damage. The widest, deepest, and most poorly measured layer. Reputation erosion compounds silently through reduced referral rates, softer renewal conversations, and a general loss of pricing power, long after the underlying incident is technically "resolved."
The strategic insight of this pyramid is simple: the visible cost is the smallest part of the iceberg, and it is the only part most organizations manage. Everything below the waterline is larger, compounding, and currently unowned in most companies.
3. The Financial Impact Across the Entire Software Lifecycle
A single escaped defect does not generate a single cost. It generates a flow of cost across departments, each absorbing a portion of the damage as the defect moves downstream. Visualized as a cost flow, the picture looks like this:
BUDGET
  │
  ▼
DEVELOPMENT  ──────► (cost: rework, missed estimates)
  │
  ▼
TESTING  ──────► (cost: late-cycle fixes, delayed release)
  │
  ▼
PRODUCTION  ──────► (cost: incident response, hotfixes)
  │
  ▼
SUPPORT  ──────► (cost: ticket volume, escalations, headcount)
  │
  ▼
CUSTOMER SUCCESS  ──────► (cost: retention risk, manual workarounds)
  │
  ▼
REVENUE LOSS  ──────► (cost: churn, discounting, lost expansion)
The defining characteristic of this flow is that the cost of a defect grows at every stage it passes through. A defect caught in development might cost a few hours of engineering time. The same defect, if it escapes to production, now costs engineering time plus incident response plus support load plus customer success intervention plus, in the worst case, the customer relationship itself.
This is the financial logic behind the long-standing engineering principle that defects are cheapest to fix at the point of origin. What is less frequently said is the inverse, business-facing version of that principle: every stage a defect travels through adds a new department's labor cost, and a new chance for the customer to notice.
Budget holders rarely see this flow because each department records its piece of the cost separately — support records ticket volume, customer success records churn, finance records discounting — and no single function is responsible for tracing those costs back to their origin. The defect's true cost is never assembled in one place. It is fragmented across cost centers, which makes it invisible at the point where investment decisions are actually made.
4. The Ripple Effect of a Production Bug
If the lifecycle flow shows cost moving through departments, the ripple effect shows how a single bug compounds in time. This is the domino sequence that plays out after almost every meaningful production incident, and it is worth walking through deliberately, because each domino is a decision point where the damage could have been contained — and usually wasn't.
 [1] Bug Released
        │
        ▼
 [2] Customer Support Spike
        │
        ▼
 [3] Engineering Interruptions
        │
        ▼
 [4] Delayed Sprint
        │
        ▼
 [5] Feature Delay
        │
        ▼
 [6] Customer Frustration
        │
        ▼
 [7] Negative Reviews
        │
        ▼
 [8] Lost Revenue
[1] Bug Released. The defect ships, usually because it sat outside test coverage, or because release pressure compressed the testing window. At this point the cost is theoretically still close to zero.
[2] Customer Support Spike. Within hours, ticket volume rises. Support agents, who were not briefed on the issue, spend time diagnosing something engineering already understands, duplicating effort across two teams simultaneously.
[3] Engineering Interruptions. Senior engineers are pulled from planned work to triage. This is the most expensive form of engineering time available, because it interrupts deep work and is, by definition, unplanned.
[4] Delayed Sprint. The sprint's planned scope slips, not because the team is unproductive, but because unplanned defect work consumed the capacity that was allocated to committed deliverables.
[5] Feature Delay. The slipped sprint pushes a roadmap item — sometimes a small one, sometimes one that was contractually promised to a customer or tied to a sales commitment.
[6] Customer Frustration. Customers experience the original bug and the downstream effects of a slower roadmap, compounding dissatisfaction.
[7] Negative Reviews. Public sentiment shifts. In B2B software this rarely shows up as a public review; it shows up as a colder tone in renewal conversations and weaker reference-ability in sales calls.
[8] Lost Revenue. Renewals soften, expansion deals slow, and new logos that relied on a reference customer no longer have one to point to.
The strategic point of this sequence is that the financial damage is rarely caused by the bug itself — it is caused by the chain reaction the bug triggers. Organizations that intervene early in the chain (strong monitoring at step 2, clear incident ownership at step 3) contain the cost. Organizations that only react once the chain reaches step 6 or 7 are managing brand damage, which is far more expensive and far slower to repair than a defect.
5. The Cost of Context Switching
Every domino in the ripple effect above has a quieter cousin that deserves its own treatment, because it is one of the most underpriced costs in software organizations: context switching.
Research on knowledge work consistently shows that recovering full focus after an interruption takes meaningfully longer than the interruption itself — frequently cited estimates put deep-focus recovery time in the 15–25 minute range per interruption, and engineering work is among the most focus-dependent categories of knowledge work in existence. A single production incident does not cost "the time spent fixing it." It costs that time, plus the recovery tax paid by every engineer who was pulled in, plus the second-order delay to whatever those engineers were doing beforehand.
Normal Sprint vs. Bug-Driven Sprint
NORMAL SPRINT
[ Planning ][ Feature Work ─────────────────── ][ Review ][ Ship ]

BUG-DRIVEN SPRINT
[ Planning ][ Feature ][!! Bug !!][ Feature ][!! Bug !!][ Feature ][ Partial Ship ]
In the normal sprint, engineering capacity flows in long, uninterrupted blocks toward committed outcomes. In the bug-driven sprint, the same nominal hours are fragmented into short bursts separated by context switches, and a large share of committed scope simply does not ship — not because the team worked fewer hours, but because fragmented hours produce dramatically less throughput than continuous hours.
This is the mechanism behind a pattern almost every VP of Engineering has observed without being able to fully explain: two teams with identical headcount and identical reported hours can have wildly different delivery output, purely as a function of how much of their time is contiguous versus fragmented. Quality is the primary variable that determines which kind of sprint a team is running.
6. The Opportunity Cost
Direct costs — incident response, hotfixes, support load — are painful but bounded. Opportunity costs are unbounded, and they are almost always larger. They represent the value the company failed to create because engineering capacity was consumed by quality problems instead of growth initiatives.
The Opportunity Cost Matrix maps the two dimensions that determine how severe an opportunity cost becomes: how much capacity was diverted, and how time-sensitive the lost initiative was.
| Low Time-Sensitivity | High Time-Sensitivity | |
|---|---|---|
| Low Capacity Diverted | Minor roadmap slippage; low impact | Missed minor market window; recoverable |
| High Capacity Diverted | Significant roadmap delay; competitive drift | Severe — lost deals, missed launch windows, ceded category position |
The most dangerous quadrant — high capacity diverted, high time-sensitivity — is also the most common failure mode in fast-moving markets. A defect-heavy quarter doesn't just delay a feature; it can delay the exact feature that was meant to close a competitive gap, at the exact moment a competitor ships it first. The roadmap delay is measured in weeks. The competitive consequence can last for years, because category leadership in software is sticky once established.
Three opportunity costs deserve explicit executive attention because they are routinely invisible in reporting:
- Features not delivered. Every sprint absorbed by defect work is a sprint of roadmap value that never gets capitalized.
- Delayed competitive response. Markets do not wait for a team to finish firefighting; competitors ship into the gap.
- Sales cycle delays. Enterprise buyers increasingly run technical due diligence; visible quality issues or unstable trial environments lengthen sales cycles and depress win rates, even when no formal "rejection" is ever recorded.
7. The Executive Dashboard
Most quality reporting is built for engineering managers: defect density, test coverage percentage, mean time to resolution. These are necessary operational metrics, but they are the wrong language for a board or executive staff meeting. What executives need is a dashboard that translates engineering signal into business risk.
The Executive Quality Dashboard
| KPI | What It Measures | Why Executives Should Track It |
|---|---|---|
| Revenue at Risk | Estimated revenue tied to accounts experiencing active quality issues | Quantifies exposure before it becomes realized churn |
| Customer Churn Risk | Accounts showing quality-correlated dissatisfaction signals | Early warning system for retention |
| Engineering Waste | % of engineering time spent on unplanned defect work vs. roadmap | Direct measure of capacity lost to poor quality |
| Incident Cost | Fully loaded cost per incident (response + downstream effects) | Converts technical events into financial events |
| Deployment Risk | Rate of failed or rolled-back deployments | Leading indicator of release-process fragility |
| Support Cost | Cost per ticket and ticket volume by defect category | Identifies which defects are most expensive to leave unresolved |
| Developer Hours Lost | Hours diverted to unplanned work, including context-switch overhead | Quantifies the hidden capacity tax |
| Feature Delay | Average roadmap slippage attributable to quality issues | Links quality directly to competitive timing |
| Recovery Time | Time from incident detection to full resolution and customer communication | Measures organizational resilience, not just technical fix speed |
The unifying design principle of this dashboard is that every metric has a direct dollar or time-to-revenue interpretation. None of them require an engineering background to interpret, and all of them can be reported alongside standard SaaS metrics like ARR, churn, and CAC on the same executive scorecard.
8. Where Companies Actually Lose Money
Quality cost is rarely concentrated in one department. It is distributed — often unevenly, and almost always invisibly — across the entire organization. A heatmap view, scored qualitatively by typical exposure, clarifies where the real financial risk concentrates.
Department Financial Impact Heatmap
| Department | Typical Exposure | Primary Cost Driver |
|---|---|---|
| Engineering | 🔴 Very High | Rework, unplanned work, context switching, on-call burden |
| Support | 🔴 Very High | Ticket volume inflation, escalation handling, headcount growth |
| Customer Success | 🟠 High | Retention risk, manual workarounds, renewal friction |
| Sales | 🟠 High | Extended sales cycles, lost deals, weakened references |
| Finance | 🟡 Medium | Discounting to retain dissatisfied accounts, unplanned spend on incident remediation |
| Marketing | 🟡 Medium | Wasted acquisition spend converting into churn rather than growth |
| Operations | 🟡 Medium | Manual intervention to compensate for unreliable systems |
| Legal | 🟢 Lower (but high severity) | Compliance exposure, contractual SLA penalties, breach-related liability |
Two observations matter more than the individual ratings. First, Engineering and Support are almost always the two highest-exposure departments, yet they are rarely in the same conversation when quality investment decisions are made — engineering reports to the CTO, support reports to a CRO or Head of CS, and the two budgets are never reconciled against the same root cause. Second, Legal sits at lower frequency but disproportionately higher severity, because a single compliance or contractual failure can erase years of accumulated savings from "efficient" engineering operations.
This is the structural argument for treating quality cost as a single enterprise risk category, reviewed centrally, rather than as a set of disconnected departmental line items.
9. The Cost of Technical Debt
Technical debt is the compounding-interest mechanism underneath almost every cost described so far. It is not a single cost; it is a multiplier that increases the cost of every future change to the system.
The Technical Debt Lifecycle
HEALTHY VELOCITY
      │
      ▼
SHORTCUTS UNDER DEADLINE PRESSURE
      │
      ▼
COMPLEXITY ACCUMULATES
      │
      ▼
VELOCITY BEGINS TO DECLINE
      │
      ▼
REFACTORING BECOMES NECESSARY
      │
      ▼
HIRING & ONBOARDING SLOW DOWN
      │
      ▼
LONG-TERM MAINTENANCE COST DOMINATES BUDGET
      │
      └──────────► (without intervention) BACK TO TOP, COMPOUNDING
Each pass through this loop without intervention raises the baseline cost of the next pass. The mechanism is well documented:
- Velocity decline. Every additional unit of complexity in a codebase slows down every future change to that codebase, not just the part that was poorly built.
- Complexity growth. Workarounds accumulate around unresolved problems rather than fixing them, increasing the system's overall surface area for failure.
- Refactoring costs. The cost of fixing a structural problem grows with the amount of code built on top of it; deferral does not reduce the bill, it compounds it.
- Hiring challenges. Complex, poorly documented, defect-prone systems are measurably harder to onboard engineers into, extending time-to-productivity for every new hire.
- Long-term maintenance. Organizations with high accumulated technical debt eventually spend the majority of engineering capacity on keeping existing systems alive rather than building new value — a state from which recovery requires significant, deliberate investment.
The critical executive insight is that technical debt is not a fixed, one-time cost that gets "paid down" — it is a structural tax rate that rises continuously until the organization makes an explicit decision to interrupt the loop. Most companies never make that decision explicitly; they make it implicitly, by default, every time they prioritize a feature over a fix, until the tax rate is high enough to threaten delivery altogether.
10. When Quality Starts Affecting Company Valuation
For founders and CEOs, the most consequential version of this entire discussion is the one that touches valuation directly. Software quality is no longer purely an operational matter once a company enters a fundraising, acquisition, or late-stage growth conversation — it becomes a diligence subject with direct pricing implications.
For SaaS and enterprise software companies, three quality-linked metrics dominate valuation conversations:
- Net Revenue Retention (NRR) and churn. Investors price growth efficiency heavily on retention. Quality-driven churn — the kind caused by reliability problems rather than competitive loss — is viewed especially unfavorably, because it signals a structural weakness rather than a market dynamic.
- NPS and reference-ability. Buyers and investors alike use customer references as a primary diligence tool. A product with a strong feature set but a reputation for instability struggles to produce strong references, which slows both sales and fundraising cycles.
- MRR/ARR quality. Revenue concentrated in accounts with active reliability complaints is treated by sophisticated investors as lower-quality revenue, sometimes explicitly discounted in valuation models, because it is judged more likely to churn.
Technical due diligence has become standard practice in growth-stage and late-stage funding rounds and in most acquisitions above a moderate deal size. These reviews routinely examine code quality, test coverage, incident history, architecture scalability, and security posture. A diligence process that surfaces unresolved technical debt, a thin test suite, or a history of significant outages does not merely raise questions — it frequently translates directly into valuation adjustments, additional escrow terms, or extended timelines that themselves carry cost and risk.
For founders specifically, the implication is direct: the quality decisions made in year one of a company are still being priced by investors in year five. Shortcuts taken to hit an early deadline do not disappear once the immediate deadline passes; they remain in the codebase as a discoverable liability until someone pays explicitly to remove them — either through deliberate investment, or through a lower valuation at the next financing event.
11. Quality Investment vs. Quality Loss
The standard way of comparing manual testing to automation is an engineering question. The executive question is different: for a given investment in quality infrastructure, what business outcome should we expect, and over what time horizon?
The Executive ROI Matrix
| Investment Area | Primary Business Return | Typical Time Horizon |
|---|---|---|
| QA Engineers | Reduced escaped defects, faster release confidence | Short-term |
| Test Automation | Lower regression cost, faster release cadence | Short-to-medium term |
| CI/CD Maturity | Reduced deployment risk, faster time-to-market | Medium term |
| Code Reviews | Lower defect injection rate, knowledge distribution across team | Short term |
| Monitoring & Observability | Reduced incident detection and recovery time | Immediate |
| Security Testing | Reduced breach risk, faster enterprise sales cycles | Medium-to-long term |
| Performance Testing | Higher conversion, reduced infrastructure cost at scale | Short-to-medium term |
The pattern that should guide capital allocation decisions is that monitoring and observability investments tend to have the fastest payback, because they directly shorten the most expensive part of the cost flow described earlier — the time between a defect reaching production and the organization becoming aware of it. Security and architectural investments tend to have the longest payback horizon individually, but the highest tail-risk reduction, since their absence is what produces the rare, catastrophic events that erase years of otherwise-sound financial performance.
A useful executive framing: quality investment should be evaluated the same way a CFO evaluates insurance and infrastructure capital — not by immediate ROI alone, but by the reduction in variance of future outcomes. A portfolio of quality investments that slightly lowers average velocity but meaningfully lowers the probability of catastrophic incidents is, in almost every case, the financially superior choice for a company with real revenue at stake.
12. Real Executive Case Study
Consider a representative mid-market SaaS company, generating roughly $40M in ARR, serving a mix of mid-market and enterprise customers.
Before — Quality as an Afterthought
- Frequent production incidents, averaging several per month, with inconsistent detection and response times.
- Release cadence slowed by repeated last-minute rollbacks and hotfixes.
- Customer complaints concentrated around reliability rather than missing features.
- Support costs rising faster than customer count, driven by recurring ticket categories tied to known, unresolved defects.
- NPS trending downward over consecutive quarters, with reliability cited as the dominant detractor theme.
- Sales cycles for enterprise deals lengthening as prospects requested uptime history and incident reports during evaluation.
The Intervention
Leadership reframed quality as a board-level metric rather than an engineering-only concern. The response combined structural and process changes: a dedicated investment in observability to shrink incident detection time, a disciplined regression suite to reduce escaped defects ahead of releases, explicit incident ownership with defined response protocols, and an executive dashboard reporting quality metrics alongside standard SaaS metrics every month.
After — Quality as a Growth Lever
- Incident frequency reduced substantially, with materially faster detection and resolution when incidents did occur.
- Release cadence increased, since engineering capacity previously absorbed by firefighting returned to roadmap work.
- Support ticket volume in previously chronic categories declined, easing pressure on support headcount growth.
- NPS recovered and stabilized, with reliability shifting from the top detractor theme to a non-issue in customer feedback.
- Enterprise sales cycles shortened as the company was able to proactively present uptime and reliability data rather than defending against it.
- Engineering retention improved, as on-call burden and unplanned interruption decreased — a frequently underweighted but financially material outcome, given the cost of senior engineering attrition and replacement.
The business lesson is not that quality "got better" in an abstract sense. It is that every one of the outcomes above is a standard executive KPI — release velocity, support cost, NPS, sales cycle length, retention — that improved as a direct, traceable consequence of quality investment. This is the case that should be made internally: not "we improved our test coverage," but "we improved the metrics the board already cares about, and quality was the lever."
13. The Five Most Expensive Software Quality Mistakes
Across most organizations, the financial damage from poor quality traces back to a small number of recurring, avoidable patterns.
1. Shipping Too Fast Without Adequate Risk Assessment
Cause: Release pressure overrides risk judgment; deadlines are treated as fixed and quality gates as negotiable. Business Cost: Higher escaped-defect rate, increased incident frequency, and the full downstream cost chain described in the ripple-effect model. How to Prevent: Establish non-negotiable release criteria tied to risk level, not calendar pressure, with explicit executive sign-off required to override them.
2. Skipping Regression Testing Under Time Pressure
Cause: Regression suites are treated as the easiest place to cut time when a release is behind schedule. <br>Business Cost: Previously fixed defects resurface, eroding both customer trust and engineering credibility ("didn't we already fix this?"). How to Prevent: Automate regression coverage for core flows so it cannot be skipped without an explicit, logged decision.
3. Ignoring Monitoring and Observability Investment
Cause: Monitoring is viewed as a cost center with no direct feature output, so it is consistently deprioritized against visible roadmap work. Business Cost: Extended incident detection and resolution times, which — per the cost-flow model — increase the financial damage of every single incident. How to Prevent: Fund observability as infrastructure, not as a discretionary engineering preference, and measure its ROI explicitly through reduced recovery time.
4. No Clear Ownership for Quality Outcomes
Cause: Quality is treated as "everyone's job," which in practice means it is no single person's accountability, and decisions default toward speed. Business Cost: Recurring defect categories never get permanently resolved, because no one owns the outcome end-to-end. How to Prevent: Assign explicit, named ownership for quality outcomes at a level senior enough to make trade-off decisions against roadmap pressure.
5. Poor Release Planning and Change Management
Cause: Releases are bundled, infrequent, and high-risk, rather than small, frequent, and reversible. Business Cost: Each release carries more risk and is harder to diagnose when something fails, increasing both incident frequency and recovery time. How to Prevent: Move toward smaller, more frequent releases with reliable rollback mechanisms, reducing the blast radius of any individual change.
14. How CTOs Can Reduce the Hidden Cost of Poor Quality
The following recommendations are organized for executive action, not engineering process documentation. Each is a decision a CTO or senior engineering leader can make directly.
- Report quality in financial terms, not engineering terms, at every executive and board meeting — revenue at risk, not defect counts.
- Establish a single owner for the entire defect lifecycle, from detection through business-impact resolution, with explicit authority over trade-offs.
- Fund observability as core infrastructure, with a target reduction in mean detection and recovery time tracked quarterly.
- Set non-negotiable release criteria for risk level, and require explicit, logged executive override to bypass them.
- Track engineering time allocation between planned roadmap work and unplanned defect work, and treat a rising unplanned percentage as an executive-level signal, not a team-level inconvenience.
- Reconcile support cost data with engineering defect data on a recurring basis, so the true cost of unresolved defect categories is visible in one place.
- Build a technical debt register with explicit business-impact estimates, reviewed alongside the product roadmap rather than separately from it.
- Treat technical due diligence readiness as an ongoing state, not a fire drill before a fundraising or acquisition event.
- Invest disproportionately in the parts of the system tied to revenue-critical paths — checkout, authentication, core data integrity — rather than spreading quality investment evenly.
- Adopt smaller, more frequent, more reversible releases to reduce the blast radius and recovery time of any individual change.
- Make context-switching cost visible by tracking interruption frequency, not just total hours, as a capacity planning input.
- Build a standing incident-to-business-impact reporting process that estimates the financial cost of every significant incident, not just its technical root cause.
- Align sales, support, and engineering on a shared view of recurring defect categories, so the same issue is not independently "discovered" by three departments.
- Protect senior engineering time from unplanned interruption as a deliberate capacity policy, recognizing that this time is the most expensive and most easily wasted resource in the organization.
- Review quality KPIs with the same cadence and seriousness as revenue KPIs, on the same dashboard, in the same meeting — not as a separate, lower-priority engineering update.
15. Executive Checklist: 25 Questions Every CTO Should Ask About Software Quality
- What percentage of our engineering capacity is going to unplanned defect work this quarter, and is that trend improving or worsening?
- Do we know the fully loaded cost of our last significant production incident, including support, customer success, and sales impact?
- Which customer accounts are currently experiencing repeated reliability issues, and what is our revenue exposure if they churn?
- How long does it take us to detect a production incident, on average — and how has that changed over the last four quarters?
- How long does it take us to fully resolve an incident, including customer communication, not just the technical fix?
- What are our top three recurring defect categories, and who owns permanently resolving each one?
- How much of our support ticket volume is attributable to known, unresolved engineering issues?
- What does our technical debt register currently show, and what is the estimated business impact of the top five items?
- Are our release criteria based on risk level, or based primarily on calendar deadlines?
- How often do we bypass our own quality gates under deadline pressure, and who approves that decision?
- What is our deployment failure and rollback rate, and is it trending in a healthy direction?
- How would our codebase and incident history hold up under a technical due diligence review today?
- Do we have a single, named owner accountable for quality outcomes at a senior level?
- How is engineering time protected from unplanned interruption, and is that policy actually followed under pressure?
- What is our current NPS or CSAT trend, and is reliability a recurring theme in detractor feedback?
- Are sales cycles for our product lengthening, and if so, is quality or reliability part of the explanation?
- How concentrated is our revenue in accounts with active or recent reliability complaints?
- What percentage of our roadmap was delayed last quarter due to defect-driven work, and what was the estimated cost of that delay?
- Do finance and engineering share a common view of the cost of quality, or are these tracked entirely separately?
- How do we currently measure the ROI of our quality and testing investments — and is that measurement tied to business outcomes?
- What would have to be true for us to confidently say our quality posture is improving our valuation rather than discounting it?
- How resilient is our system to a single point of failure in a revenue-critical path, such as checkout or authentication?
- Is our monitoring and observability investment sized to our current scale, or has it lagged behind growth?
- What is our plan if a significant security or reliability incident became public tomorrow?
- If a board member asked us to quantify the hidden cost of poor software quality in our business today, could we answer with confidence?
Conclusion
Software quality is not a development expense. It is an investment that protects revenue, customer trust, and company growth — and like any investment, its absence does not produce zero cost. It produces a compounding, distributed, largely invisible liability that surfaces in churn curves, sales cycle length, engineering attrition, and ultimately, valuation.
The organizations that manage this well are not the ones with the most engineers or the largest test suites. They are the ones that have built a translation layer between technical signal and business consequence — a dashboard, a review cadence, a shared language — so that quality decisions are made with the same rigor, visibility, and accountability as any other capital allocation decision in the business.
The hidden cost of poor software quality is only hidden because most companies have chosen not to measure it. That is a choice every executive team is in a position to reverse.
Call to Action: Before your next planning cycle, assess the true financial impact of software quality in your organization — across engineering, support, sales, and retention — and evaluate honestly whether your current quality strategy is built to protect revenue and long-term company value, or merely to keep pace with the next release deadline.



