
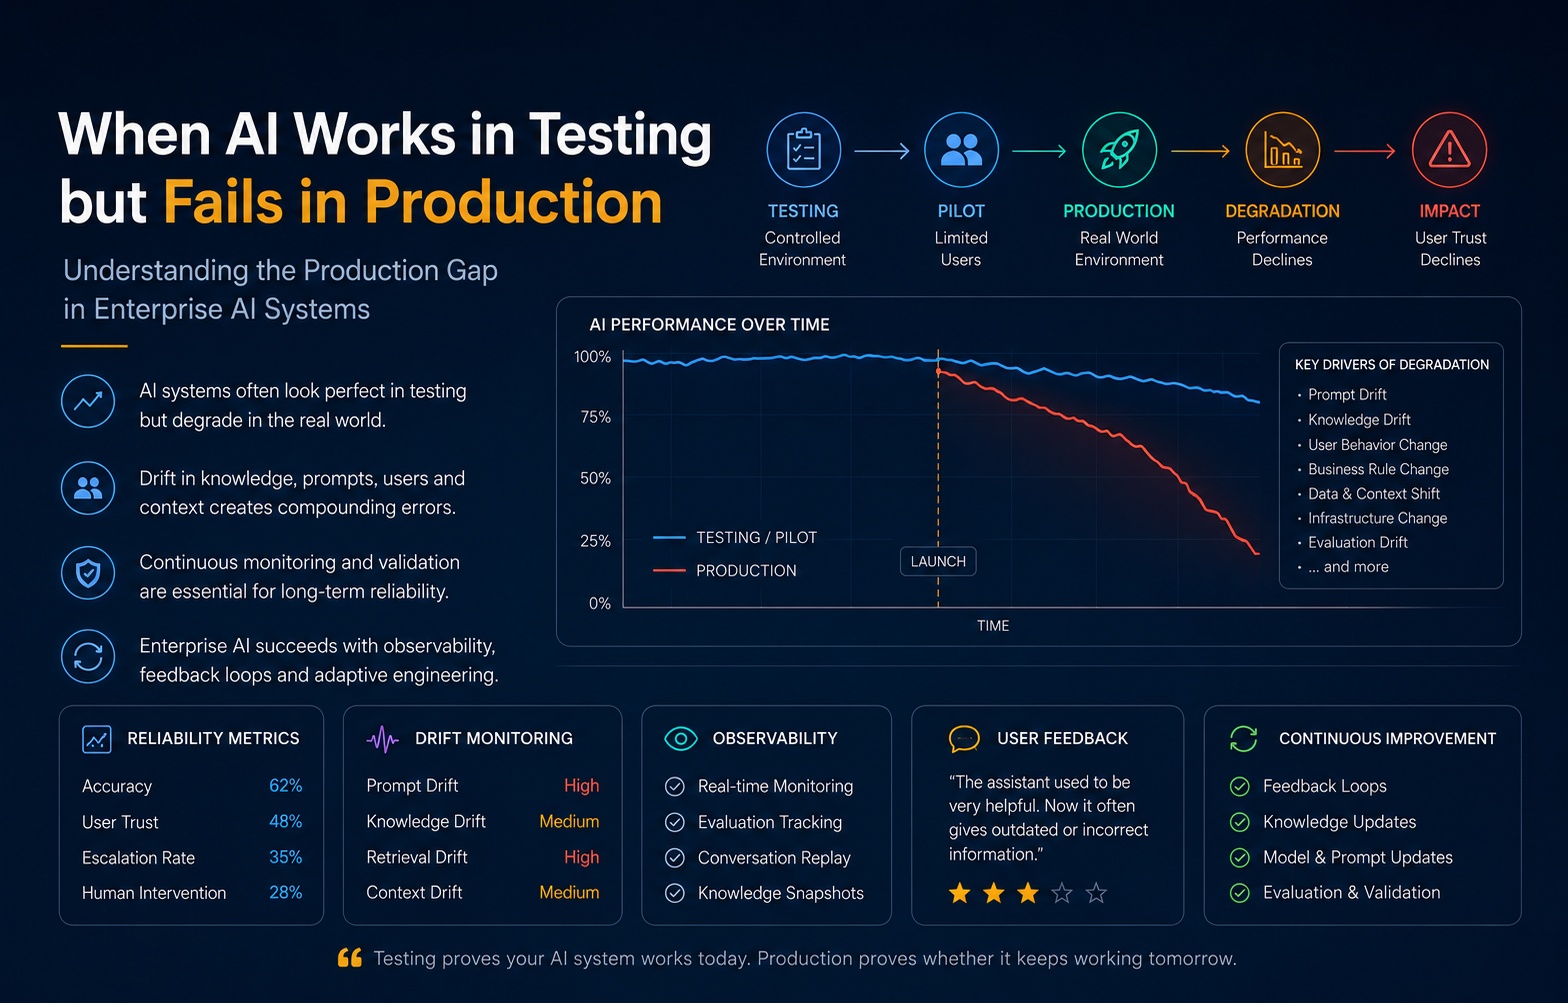
A B2B SaaS company — call it Meridian — ships an AI assistant into its customer platform. The assistant answers product questions, explains billing, walks users through configuration, and files support tickets when it cannot help.
The engineering work is good. Not lucky-good — disciplined-good.
Internal testing. A curated evaluation set of 1,400 questions, written by support leads and solutions engineers, graded by a rubric and a model-as-judge with human spot checks. Result: 98.1% success.
Customer pilot. Twelve design partners, six weeks, roughly 40,000 real conversations. Success drops, as expected, to 95.4%. The team is pleased: a 2.7-point drop from lab to field is a tight seam. They fix the top three failure clusters, ship, and celebrate.
Production, month four. Support tickets tagged "assistant gave wrong answer" are up 340% quarter over quarter. The CSM team has quietly started telling accounts to "just open a ticket instead." An enterprise customer escalates because the assistant confidently described a data-retention policy that had been superseded in February. The NPS verbatims contain a phrase that no engineering team ever wants to read: "It used to be better."
The team does the obvious thing. They pull the evaluation harness and re-run it against the exact same model, the exact same prompt template, the exact same code path.
98.0%.
Within noise of the original number. Nothing regressed. No deployment correlates with the complaints. No infrastructure incident lines up. Git blame produces nothing interesting. The model did not get worse.
The environment moved, and the system did not move with it.
Between launch and month four: the product shipped 31 releases and two pricing changes; the help center gained 214 new articles and deprecated 96; Legal rewrote the data-retention policy; support renamed four ticket categories; the vector index was re-embedded with a newer embedding model during a routine dependency bump; the model provider shipped a minor version that changed refusal behavior on a class of billing questions; and — most consequentially — the user population changed. At launch, the assistant served early adopters who typed careful, complete questions. By month four it served everyone, including the 60% of users who type "billing broke" and hit enter.
Every one of those changes was individually reasonable. Every one was approved. None was flagged as an AI change. Together they produced a system that answers a different distribution of questions, over a different corpus, under different rules, than the one that scored 98%.
This paper calls that divergence the Production Gap.
The Production Gap is the distance between the environment a system was validated in and the environment it currently operates in — and the degradation that distance produces.
Three properties make it dangerous.
It is invisible to the model. Ask the model whether it is drifting and it will answer the question as fluently as it answers anything else. Degradation from environmental divergence does not manifest as lower confidence, higher latency, or an error rate. It manifests as fluent wrongness — the most expensive failure mode in software, because it looks exactly like success.
It is invisible to CI. Every classical quality gate the industry has built — unit tests, integration tests, contract tests, canaries, blue/green — assumes the specification is stable and the code is the variable. In AI systems that assumption inverts. The code is often the most stable component. The specification lives in the help center, the policy PDF, the CRM schema, the promo calendar, and the heads of the users.
It is cumulative and non-linear. No single change breaks the system. The gap widens by fractions of a percent per week, below the noise floor of any dashboard anyone is actually watching, until it crosses the threshold where users stop trusting the output — and trust, once lost, does not recover at the same rate accuracy does.
Production is the longest test your AI system will ever take.
Meridian's mistake was not a modeling mistake or a prompting mistake. It was a category error: they treated a deployed AI system as an artifact to be validated once, when it is in fact a continuously re-specified system whose correctness must be re-established on a schedule.
Testing proves the system worked against a snapshot. Production asks a harder question, and asks it every day: does the system still agree with the world?
The rest of this paper is about how to answer that question with engineering rather than anecdote.
Chapter 1 — Testing Is a Controlled Environment
The instinct when lab and production diverge is to blame sample size: we didn't test enough cases. This is almost always wrong, and it is an expensive wrong because it sends teams off to triple their eval set — which improves the lab number and changes nothing in production.
Lab and production do not differ in volume. They differ in entropy.
1.1 The Environment Entropy Ladder
Every environment an AI system passes through has a characteristic level of disorder across five independent axes. Volume is not one of them.
| Axis | What varies | Lab | Pilot | Production |
|---|---|---|---|---|
| Input entropy | Phrasing, completeness, language, typos, intent clarity | Low — inputs authored by people who know the answer | Medium — real users, but motivated and briefed | High — unmotivated, ambiguous, adversarial, multilingual |
| Knowledge entropy | Rate of change in the ground truth corpus | Zero — frozen fixtures | Low — quarterly-ish | Continuous — daily commits to the truth |
| Rule entropy | Business rules, policies, entitlements | Zero — encoded at build time | Low | High — changed by people with no repo access |
| Path entropy | Workflow branches, tool calls, handoffs, retries | Low — happy paths | Medium | Combinatorial — real workflows fork, abandon, resume |
| Systems entropy | Upstream APIs, latency, partial failures, versions | Zero — mocked | Low — stable window | Ongoing — degraded dependencies are the norm |
Define the Environment Entropy Coefficient (EEC) as the mean normalized entropy across the five axes, scored 0–1. A typical curated eval suite sits at EEC ≈ 0.15. A well-run pilot reaches EEC ≈ 0.40. Production for a mature enterprise assistant runs EEC ≈ 0.85.
The number matters because of what it implies about extrapolation. A 98% score at EEC 0.15 tells you almost nothing about behavior at EEC 0.85 — not because the model is unreliable, but because you measured a different system operating on a different input distribution against a different truth.
A test suite is a photograph of an environment. Production is the weather.
1.2 The Three Environments, Honestly Compared
| Dimension | Testing | Pilot | Production |
|---|---|---|---|
| Users | The team, or personas of the team | Selected, briefed, tolerant | Everyone, unbriefed, impatient |
| Prompts | Synthetic, well-formed, single-intent | Real but self-conscious | Fragmentary, multi-intent, context-dependent |
| Knowledge | Frozen snapshot | Slow-moving | Changes hourly, edited by non-engineers |
| Ground truth | Known and labeled | Mostly known | Frequently contested |
| Failure visibility | Immediate, in a report | Reported by champions | Mostly silent — users leave |
| Feedback latency | Seconds | Days | Weeks to never |
| Success definition | Rubric score | Pilot satisfaction | Business outcome + trust |
| Cost of error | A failing check | A hard conversation | Churn, compliance exposure, brand damage |
The most under-appreciated row is failure visibility. In testing, every failure is captured by construction. In production, the modal response to a bad answer is not a thumbs-down — it is silence. The user shrugs, reformulates, gives up, or opens a ticket through a different channel. The system's own telemetry sees a completed conversation.
Your production failure rate is not what your dashboard shows. It is what your dashboard shows, divided by the fraction of failures a user bothers to report.
For most enterprise assistants that fraction sits between 2% and 10%. A dashboard showing 0.4% negative feedback is consistent with a real error rate anywhere from 4% to 20%. Any monitoring strategy built on explicit user feedback alone is off by an order of magnitude, and off in the flattering direction.
1.3 The Synthetic Prompt Problem
Curated eval sets encode a hidden assumption: the person writing the question knows what a good question looks like. That assumption is exactly the thing production violates.
Real inputs carry properties test sets systematically under-represent:
- Underspecification. "Why is my invoice wrong?" — no invoice ID, no account context, no definition of wrong.
- Compound intent. "Cancel the seat and refund the difference and tell me when it lands" — three operations, two of which require authorization the assistant may not have.
- Stale premise. The user asks about a feature that was renamed nine months ago and does not know it was renamed.
- Conversational carryover. Turn 7 references an entity introduced in turn 2, filtered through an intervening correction.
- Emotional register. Frustration changes phrasing, shortens inputs, and raises the cost of a mediocre answer.
- Channel truncation. Mobile users type a third as many words as desktop users for the same intent.
None of these are exotic. All of them are rare in hand-authored eval sets, because a person writing a test case naturally writes a good test case.
Engineering implication. Eval sets must be harvested, not authored. The highest-value evaluation corpus in any organization is a stratified sample of real production traffic, relabeled continuously — a mechanism we develop in Chapter 7 as the Living Eval Set. Authored cases still have a role: they cover regression risks and rare-but-critical paths. But an eval suite that contains no ugly real traffic is measuring an environment your users do not live in.
Chapter 2 — The Production Gap
The Production Gap is not a mood. It is a decomposable quantity, and decomposing it is what makes it manageable.
2.1 The Eight Mutable Surfaces
A deployed AI system touches eight surfaces that can change independently of the model and independently of your deploy pipeline. Together they constitute the system's effective specification — the real contract the system is judged against, most of which lives outside version control.
                    ┌──────────────────────────────────────┐
                    │           THE MODEL                  │
                    │   (the part you thought was the      │
                    │    system, ~15% of failure surface)  │
                    └──────────────────────────────────────┘
                                     ▲
       ┌──────────────┬──────────────┼──────────────┬──────────────┐
       │              │              │              │              │
  ┌────┴────┐   ┌─────┴─────┐  ┌─────┴─────┐  ┌─────┴─────┐  ┌────┴─────┐
  │KNOWLEDGE│   │   RULES   │  │   USERS   │  │INTEGRATION│  │   DATA   │
  │  S1     │   │    S2     │  │    S3     │  │    S4     │  │    S5    │
  └─────────┘   └───────────┘  └───────────┘  └───────────┘  └──────────┘
       │              │              │              │              │
  ┌────┴────┐   ┌─────┴─────┐  ┌─────┴─────┐
  │ PROMPTS │   │   INFRA   │  │  CONTEXT  │
  │   S6    │   │    S7     │  │    S8     │
  └─────────┘   └───────────┘  └───────────┘

        FIGURE 1 — The Eight Mutable Surfaces of a Production AI System
S1 — Knowledge. The corpus the system reasons over: help center, policy documents, product docs, contracts, tickets, wikis, transcripts. Owned by content, support, legal, and product marketing. Changes daily. Has no CI, no review gate that considers AI impact, and no notion of "breaking change."
S2 — Business rules. Entitlements, pricing, SLAs, refund thresholds, escalation matrices, regional compliance. Owned by finance, legal, and ops. Frequently encoded in three places — a policy PDF, a config table, and a system prompt paragraph — that drift out of agreement with each other.
S3 — Users. Population composition, sophistication, device mix, language mix, intent distribution, tolerance. Changes with every marketing campaign, geographic expansion, and pricing tier. The single largest source of input-distribution shift, and the one almost nobody instruments.
S4 — Integrations. CRM, billing, ticketing, search, identity, internal microservices, and the model provider itself. Each has its own release cadence, deprecation policy, and definition of "backward compatible" — none of which include "the semantics an LLM inferred from this field name."
S5 — Data. The structured state the system reads and writes: catalogs, inventories, account records, entitlement tables, embeddings. Schema changes, backfills, enum additions, and re-indexing all mutate meaning without mutating code.
S6 — Prompts. System prompts, tool descriptions, few-shot exemplars, routing instructions, guardrail text. In most organizations these accumulate by accretion — a clause added after each incident — until nobody can state the current behavioral contract without reading 4,000 tokens of layered patches.
S7 — Infrastructure. Model version, decoding parameters, context window, truncation strategy, caching, rate limits, retries, timeouts, fallback chains. Changes here alter behavior in ways that never appear as errors.
S8 — Context. The assembly logic: what gets retrieved, how it is ranked, how much history is carried, how it is compressed, in what order it is placed. This is the highest-leverage and least-observed surface in most systems.
2.2 The Gap Equation
Not all surfaces are equally dangerous. Danger is a product of three factors:
   Gap_contribution(Sᵢ) = ChangeVelocity(Sᵢ) × DetectionLatency(Sᵢ) × BlastRadius(Sᵢ)
                          └── changes/week ──┘  └──── weeks ────┘   └── 0–1 ──┘

   ProductionGap = Σᵢ Gap_contribution(Sᵢ)          for i = 1..8
The middle term is the one engineering controls most cheaply. You cannot stop Legal from rewriting a policy; you can absolutely detect it within an hour instead of a quarter. Halving detection latency halves the gap, at a fraction of the cost of halving change velocity.
A representative profile for a mature enterprise assistant:
| Surface | Change velocity | Typical detection latency | Blast radius | Relative contribution |
|---|---|---|---|---|
| S1 Knowledge | 15–40 edits/wk | 6–12 weeks | 0.8 | Very high |
| S8 Context | 1–2 changes/wk | 2–6 weeks | 0.9 | Very high |
| S3 Users | Continuous | Rarely measured | 0.7 | High |
| S2 Rules | 2–6/quarter | 4–16 weeks | 0.9 | High |
| S5 Data | 5–20/wk | 1–4 weeks | 0.6 | Medium |
| S4 Integrations | 1–4/mo | Days–weeks | 0.5 | Medium |
| S6 Prompts | 2–8/mo | Hours–days | 0.7 | Medium |
| S7 Infrastructure | 1–3/mo | Days | 0.6 | Medium |
Two entries deserve emphasis. S1 Knowledge ranks highest not because it changes fastest but because detection latency is enormous — a stale article can sit in the index for a quarter before anyone connects it to a bad answer. S3 Users ranks high on pure blindness: most teams cannot answer "has our input distribution shifted since launch?" at all, which makes detection latency effectively infinite.
2.3 Silent Coupling
The mechanism that makes the Production Gap sneaky has a name worth adopting: silent coupling — a dependency the system relies on for correctness but does not declare, cannot version, and will not fail loudly when broken.
Examples an experienced team will recognize immediately:
- A system prompt says "escalate to Tier 2 for enterprise accounts." The CRM later renames the tier to "Strategic." The prompt still parses. The tool still returns 200. Enterprise escalations quietly stop.
- A retrieval chunker was tuned against articles averaging 800 words. The content team adopts a new template with heavy H3 nesting and 200-word sections. Chunk boundaries now split procedures mid-step. Retrieval recall metrics look unchanged; answer completeness collapses.
- A tool description says "returns the customer's active subscriptions." Someone adds trials to the return set for a different consumer. The model now tells trial users they have a paid plan.
- A
statusenum gains a ninth value. The model has never seen it, has no instruction for it, and confabulates a plausible meaning.
In classical software, undeclared dependencies produce exceptions. In AI systems they produce sentences. Nothing throws. The pipeline is green. The answer is wrong.
Traditional systems fail loudly and specifically. AI systems fail quietly and plausibly.
2.4 The Gap Is Structural, Not Optional
It is tempting to read this chapter as a list of hygiene failures. It is not. Every surface above changes because the business is alive. Content teams should publish. Legal should update policy. Marketing should bring new users. Providers should ship better models.
The Production Gap is the cost of operating inside a functioning organization. You do not eliminate it. You budget it, measure it, and close it on a cadence faster than it opens.
Every deployed AI model begins drifting the moment its environment changes — which is to say, immediately.
Chapter 3 — The Hidden Sources of AI Degradation
"Drift" is used loosely enough in industry to have stopped meaning anything. This chapter gives it structure: twelve distinct drift vectors, each with a different cause, a different signature in telemetry, a different detection method, and — critically — a different half-life.
3.1 The Drift Taxonomy
Two properties determine how a drift vector should be handled: how fast it acts, and whether it announces itself.
                        VISIBLE (announces itself)
                                 ▲
                                 │
        API Drift                │   Model Version Drift
        Infrastructure Drift     │   Prompt Drift
                                 │
   FAST ◄─────────────────────────┼─────────────────────────► SLOW
                                 │
        Retrieval Drift          │   Knowledge Drift
        Context Drift            │   Business Drift
        Behavior Drift           │   Workflow Drift
                                 │   Policy Drift
                                 │   Evaluation Drift
                                 ▼
                        SILENT (must be hunted)

         FIGURE 2 — Drift Taxonomy: speed vs. announcement
The bottom-right quadrant — slow and silent — is where enterprise AI systems actually die. Fast-and-visible drift is an incident; someone gets paged and it gets fixed. Slow-and-silent drift is a quarterly business review where nobody can explain why satisfaction fell.
Drift half-life is the useful planning number: the time for a drift vector to consume half of the system's remaining quality headroom if left uncorrected. It tells you re-validation cadence directly — sample at no less than half the shortest relevant half-life.
3.2 Prompt Drift
Definition. The system prompt and its satellite instructions accumulate uncoordinated edits until the behavioral contract is internally inconsistent and nobody can state it.
Mechanism. Every incident ends with a prompt patch. Patches are additive because deletion feels risky. After 40 incidents the prompt contains three overlapping escalation rules written by three engineers in three quarters, two of which contradict the third under conditions nobody enumerated.
Enterprise example. A financial services assistant accumulates: "Never provide tax advice" (added Q1 after Legal review), "Help users understand the tax implications of account types" (added Q2 by product), and "When uncertain about regulatory topics, provide general education and recommend a professional" (added Q3). The model resolves the conflict differently depending on phrasing, user tone, and position in the conversation. Compliance sampling finds a 6% rate of borderline advice. No single line is wrong.
Signature. Rising variance in behavior on a stable input class; identical questions producing categorically different handling; growing prompt token count with flat or declining quality.
Detection. Prompt Drift Index (Chapter 12): contradiction density from automated clause analysis, plus behavioral variance on a fixed probe set.
Half-life: 8–16 weeks in a team with active incident response.
Countermeasure. Treat the prompt as a specification artifact with an owner, a changelog, and a deletion budget: no clause added without reviewing the clauses it interacts with; periodic consolidation passes validated against the eval suite.
3.3 Knowledge Drift
Definition. The corpus the system retrieves from diverges from current truth — through staleness, contradiction, or unreviewed additions.
Mechanism. Content is written for humans, who read the publish date and apply judgment. Retrieval has no such judgment. A superseded article and its replacement are both plausible, both well-written, and both retrievable; ranking may prefer the older one because it has richer keyword coverage from years of SEO editing.
Enterprise example. A telecom's help center publishes a new roaming policy. The old article is not deleted — it is linked from a partner microsite, so removing it would break an external link. Both live in the index. For eleven weeks the assistant quotes both, roughly at random, to different customers. Two of them escalate to a regulator with contradictory written statements from the same brand.
Signature. Answer instability on identical questions across sessions; citations pointing to documents older than the last policy change; rising correction rate concentrated in one content domain.
Detection. Knowledge Freshness Score and contradiction scanning — pairwise entailment checks across retrieved neighbors in the same topic cluster.
Half-life: 6–12 weeks; shorter in fast-moving domains.
Countermeasure. Corpus lifecycle governance: every document carries an authority tier, an effective date, and an expiry; superseded documents are tombstoned (retained, de-indexed, and explicitly marked superseded) rather than left live.
3.4 Context Drift
Definition. The context assembled for the model changes shape — length, ordering, composition, compression — without any change to retrieval or the model.
Mechanism. Context assembly is code, but the inputs to that code are dynamic. Longer documents, longer conversations, more tools, added metadata headers, a new safety preamble — each consumes budget. Something gets truncated. Usually the thing at the boundary, which is usually the conversation history or the last-ranked document, which is disproportionately often the one that mattered.
Enterprise example. A healthcare scheduling assistant adds a 700-token compliance preamble. Total context budget is unchanged. The truncation strategy drops the oldest conversation turns. Multi-turn appointment negotiations — the core use case — begin losing the originally stated constraint ("mornings only, not Tuesdays"). Single-turn evals are unaffected. The eval suite is 80% single-turn. Nothing is caught for two months.
Signature. Quality degradation correlated with conversation length or document size; failures clustering above a specific turn index; performance cliff at a token threshold.
Detection. Context Reliability metric (Chapter 12): the fraction of requests in which every element required by the ground-truth answer was actually present in the assembled context. This is measured against the prompt as sent, not the retrieval result set — the distinction matters, because information is most often lost between retrieval and the model.
Half-life: 4–8 weeks.
Countermeasure. Log the fully assembled prompt (hashed or redacted as policy requires), alert on budget-pressure events, and treat truncation as an error condition with its own rate, not a silent fallback.
3.5 Retrieval Drift
Definition. The retrieval layer returns systematically different results over time for the same queries, due to index growth, embedding changes, chunking changes, or corpus composition shifts.
Mechanism. Retrieval quality is relative, not absolute. A document is retrieved because it beats its competitors. Add 5,000 documents and the competitive landscape changes for every query. Re-embed with a new model and the entire geometry changes at once.
Enterprise example. A manufacturer's internal assistant indexes 40,000 documents at launch. Eighteen months later it indexes 190,000 — mostly meeting notes and Slack exports, ingested because ingestion was easy. Meeting notes are conversational, entity-dense, and semantically close to almost any question. Authoritative specifications, written in dry technical register, lose ranking share. Recall@10 on the canonical eval set is unchanged, because canonical queries are easy. Real queries now surface someone's offhand comment about a tolerance instead of the tolerance specification.
Signature. Rising citation diversity with flat answer quality; authority-tier distribution of citations shifting downward; recall stable while precision decays.
Detection. Retrieval Health (Chapter 12), which combines precision@k on a rolling harvested query set with authority-weighted citation distribution.
Half-life: 10–20 weeks — and near-zero on the day of a re-embedding, which is a step change, not drift.
Countermeasure. Treat any change to embedding model, chunker, or ranking as a model-class change with full re-validation. Ingest on an allowlist with authority tiers, not on availability.
3.6 Business Drift
Definition. The commercial reality — pricing, packaging, entitlements, promotions, SLAs — moves independently of everything the system encodes.
Enterprise example. A SaaS company introduces usage-based pricing alongside seat-based. The assistant's system prompt, written in the seat-based era, contains the sentence "each user requires a license." It is now false for half the customer base. The prompt was never reviewed during the pricing launch because the pricing launch checklist listed website, billing, docs, and sales enablement — not the assistant.
Signature. Failures concentrated in commercially sensitive intents; sales or finance reporting assistant answers that contradict quotes.
Detection. Business Accuracy (Chapter 12), sampled by domain experts on a monthly cadence over commercially sensitive intent classes.
Half-life: 1–2 quarters, punctuated by step changes at every launch.
Countermeasure. Add the AI system to the launch checklist of every function that can change a fact. This is an organizational fix, not a technical one, and it is the highest-ROI intervention in this entire paper.
3.7 Workflow Drift
Definition. The processes the system participates in change shape — new steps, new handoffs, new tools, new approval gates — while the system continues executing the old choreography.
Enterprise example. An insurance claims assistant is built to collect information and create a claim record. Ops later inserts a fraud-screening step between intake and claim creation. The assistant, unaware, still tells customers "your claim has been submitted and will be reviewed in 2–3 days." Screening adds five days. Every promise the assistant makes is now wrong, and it is wrong in writing, at scale.
Signature. Rising gap between what the assistant states and what systems do; complaints about timelines rather than answers; escalation reasons shifting from "wrong answer" to "wrong expectation."
Detection. Workflow conformance checks: periodic comparison of the assistant's stated process against the current documented process, plus outcome tracing from conversation to final business record.
Half-life: 1–2 quarters.
Countermeasure. Externalize process descriptions into a versioned source that both the workflow engine and the assistant read. Never let a process exist in prose in two places.
3.8 Policy Drift
Definition. Governance rules — privacy, security, regulatory, brand, tone — change while the enforcing text does not.
Enterprise example. A bank's assistant is permitted to disclose the last four digits of an account number after identity verification. A revised control requires step-up authentication for any account identifier. The guardrail layer is updated. The system prompt still contains the original permission. Under conversational pressure the model complies with the prompt, and the guardrail's regex — written against a formatted pattern — misses the model's natural-language rendering of the digits.
Signature. Guardrail and prompt disagreeing; policy-sensitive failures appearing only under paraphrase or pressure; audit findings that the team cannot reproduce.
Detection. Policy conformance suites executed as adversarial probes, not as static string checks; every policy change triggers a mandatory probe run.
Half-life: 2–3 quarters, but blast radius approaches 1.0 — a single policy failure can be materially more expensive than a year of ordinary errors.
Countermeasure. Single source of policy truth, compiled into both prompt text and guardrail configuration, with a test that fails if they disagree.
3.9 Behavior Drift
Definition. The system's style of operation shifts — verbosity, hedging, tool-calling frequency, refusal propensity, confidence — without a change in factual accuracy.
Mechanism. Behavior is the emergent product of prompt, context length, model version, decoding parameters, and input distribution. Change any one and the personality moves. Behavior drift is frequently the first observable symptom of other drifts.
Enterprise example. After a provider minor-version update, an assistant becomes measurably more cautious: hedged language rises from 8% to 23% of answers, and tool-call rate on ambiguous requests drops as the model asks clarifying questions instead. Factual accuracy is unchanged or slightly better. Task completion falls 11% because users abandon at the clarifying question. The accuracy dashboard shows nothing.
Signature. Shifts in response length distribution, hedge-phrase frequency, refusal rate, tool-call rate, or clarifying-question rate — all measurable without any ground truth.
Detection. Behavioral fingerprinting: a vector of distributional statistics computed daily and compared against a baseline window. This is the cheapest high-value monitor in the entire stack because it requires no labels.
Half-life: Instant on version change; 6–12 weeks under gradual input-distribution shift.
Countermeasure. Maintain a behavioral baseline as an explicit artifact. Alert on distributional distance, not just on accuracy.
3.10 Evaluation Drift
Definition. The measurement apparatus itself degrades — eval sets go stale, labels become wrong, judge models change, and the metric stops tracking the phenomenon.
This is the most dangerous vector in the taxonomy, because it disables the instruments you would use to detect the other eleven.
Mechanisms.
- Label rot. Ground-truth answers were correct when written. Policy changed. The eval set now penalizes correct answers and rewards obsolete ones.
- Overfitting by iteration. Twenty prompt revisions tuned against the same 1,400 cases have produced a system optimized for those cases.
- Distribution divergence. The eval set reflects launch-era traffic; production traffic has moved.
- Judge drift. The LLM-as-judge is itself a model on a version cadence, with its own prompt, subject to every vector in this chapter.
Enterprise example. A logistics company reports 96% assistant accuracy for four consecutive quarters while support escalations triple. Investigation finds 31% of eval cases have ground-truth answers contradicted by current policy, and the judge prompt rewards fluency and citation presence rather than citation correctness. The system had been optimized against a corrupted oracle for a year.
Signature. Divergence between offline scores and any business signal. Any time your eval says one thing and your escalation rate says another, assume the eval is wrong until proven otherwise.
Detection. Evaluation Confidence (Chapter 12): label freshness, human–judge agreement on a rolling sample, eval–production distribution distance, and correlation between eval score and business outcome.
Half-life: 2 quarters — and effectively zero after any significant policy change.
Countermeasure. Version and re-certify eval sets like code. Re-label a rolling sample every cycle. Audit the judge against humans monthly. Hold out a sealed set never used for tuning.
An eval suite that never fails is not a quality gate. It is a mirror.
3.11 Infrastructure Drift
Definition. The execution environment changes: timeouts, retries, caching, rate limits, fallback routing, context window, decoding parameters, load balancing across regions or providers.
Enterprise example. An SRE team adds a 20-second timeout with a fallback to a smaller, cheaper model. Under normal load the fallback fires on 0.3% of requests. During a Monday-morning peak it fires on 14%. Complex multi-step reasoning requests — the slow ones — are exactly the ones that time out, so the fallback model receives a traffic sample biased toward the hardest questions. Quality collapses for two hours every Monday. The incident is invisible because both paths return 200 and the aggregate weekly metric absorbs it.
Signature. Quality correlated with time of day, region, or load; bimodal latency; fallback rate uncorrelated with fallback-quality measurement.
Detection. Segment every quality metric by execution path, model, region, and hour. A single aggregate number is a place for problems to hide.
Half-life: Immediate on change.
Countermeasure. Fallbacks are a quality decision, not an availability decision. Measure the fallback path independently and alert on its share of traffic.
3.12 API Drift
Definition. Upstream services change semantics, schemas, defaults, or availability in ways that are formally compatible but semantically consequential.
Enterprise example. A CRM adds "pending_verification" to an account-status enum. The API contract is additive and backward compatible; no integration test fails. The model has no instruction covering the value, infers from the string that the account is probably fine, and grants access to a self-service action that should have been blocked. The bug is found in an audit five weeks later.
Signature. Novel values appearing in tool responses; rising rate of tool outputs the model has never encountered; failures clustered on a single integration.
Detection. Schema-and-value monitoring on every tool boundary: alert on new enum values, new fields, distribution shifts in existing fields, and null-rate changes. Additive changes are non-breaking for code and frequently breaking for models.
Half-life: Instant on change, discovery lag of weeks.
Countermeasure. Contract tests that assert on value domains, not just shapes. An unknown enum value should raise a handled condition, not flow into a prompt.
3.13 Model Version Drift
Definition. The model itself changes — a provider update, a deprecation-forced migration, a self-hosted retrain, a quantization change, or a routing change between model tiers.
Enterprise example. A provider deprecates a version with 90 days' notice. The team migrates, runs the eval suite, sees 97.8% versus 98.1%, and ships. In production, task completion falls 9%. The new model formats structured outputs slightly differently; a downstream parser silently drops malformed records; and the model's instruction-following on a rarely-tested tool sequence is different. The eval suite, being answer-centric, tested none of it.
Signature. Step changes coincident with migration; format/parse error rates; tool-call sequence distributions.
Detection. Migration validation must include: behavioral fingerprint comparison, tool-call sequence distributions, format conformance, latency-and-cost profile, and side-by-side shadow traffic for at least one full business cycle. An aggregate accuracy comparison is necessary and radically insufficient.
Half-life: Instant.
Countermeasure. Shadow evaluation as standard practice. Never migrate a model on the strength of an aggregate score.
3.14 Drift Summary
| # | Vector | Speed | Visibility | Half-life | Primary owner |
|---|---|---|---|---|---|
| 1 | Prompt | Slow | Semi | 8–16 wk | AI Eng |
| 2 | Knowledge | Slow | Silent | 6–12 wk | Content / KM |
| 3 | Context | Medium | Silent | 4–8 wk | AI Eng |
| 4 | Retrieval | Slow | Silent | 10–20 wk | ML Platform |
| 5 | Business | Slow | Silent | 1–2 qtr | Product / Finance |
| 6 | Workflow | Slow | Silent | 1–2 qtr | Ops |
| 7 | Policy | Slow | Silent | 2–3 qtr | Legal / Risk |
| 8 | Behavior | Medium | Silent | 6–12 wk | AI Eng |
| 9 | Evaluation | Slow | Silent | 2 qtr | QA / AI Eng |
| 10 | Infrastructure | Fast | Semi | Instant | SRE |
| 11 | API | Fast | Semi | Instant | Platform |
| 12 | Model version | Fast | Visible | Instant | AI Eng |
Nine of twelve are silent. Seven of twelve are owned outside the AI engineering team. That combination — invisible failures owned by people who do not know they own them — is the structural explanation for why AI systems degrade in organizations that are otherwise operationally excellent.
Chapter 4 — Production Is a Living System
Classical software engineering rests on an assumption so foundational it is rarely stated: the specification is stable, and the code is the variable. Requirements are captured, encoded, tested, shipped. Change enters through the repository. Version control is therefore a sufficient record of what the system is.
AI systems invert this. The code may go untouched for months while the system's actual behavior changes continuously — because the specification is distributed across the organization and edited by people who do not know they are editing a specification.
4.1 The Ambient Specification
Call the aggregate of everything that determines correct behavior the ambient specification. For a typical enterprise assistant:
| Specification component | Where it lives | Who edits it | Versioned? | Reviewed for AI impact? |
|---|---|---|---|---|
| What is true about the product | Help center, docs | Content, PMM | Partially | No |
| What the company promises | Policy PDFs, ToS | Legal | Yes, elsewhere | No |
| What customers are entitled to | Billing config, CRM | Finance, RevOps | Partially | No |
| What the process is | Ops runbooks | Support ops | Rarely | No |
| What the data means | DB schemas, enums | Engineering | Yes | No |
| How the system should behave | System prompt | AI Eng | Yes | Yes |
| What good looks like | Eval set | QA | Sometimes | Sometimes |
Two rows out of seven are under AI engineering's control. Roughly 25% of the specification is inside the repository. The rest is ambient: real, binding, load-bearing, and outside CI.
Your AI system has a specification. Most of it is not in your repository, and most of its authors do not know they are writing it.
This reframes the job. AI reliability engineering is substantially the practice of importing the ambient specification into engineering visibility — not by seizing control of it, which is neither possible nor desirable, but by observing it, versioning it, and reacting to its changes.
4.2 The Three Clocks
Three clocks run simultaneously in a production AI system, and misalignment between them is the Production Gap made concrete.
   ORGANIZATION CLOCK   ████████████████████████████████████  daily
   (knowledge, rules, users, processes change)

   SYSTEM CLOCK         ████        ████        ████          per deploy
   (prompt, code, retrieval config change)

   VALIDATION CLOCK     ██                              ██    quarterly (if lucky)
   (eval sets, labels, judges, baselines refresh)

        FIGURE 3 — The Three Clocks. The gap is the area between them.
Most organizations run the organization clock at daily speed, the system clock at sprint speed, and the validation clock at "when someone complains" speed. The engineering objective is not to slow the organization. It is to raise the validation clock to at least the frequency of the fastest surface that materially affects correctness.
4.3 Users Teach the System — Including the Wrong Lessons
A deployed assistant does not encounter a fixed population. It encounters a population that adapts to it.
- Successful patterns propagate. Users who discover an effective phrasing share it. Traffic concentrates on the paths the system handles well, which inflates measured success while masking growing weakness elsewhere.
- Failure modes get routed around. Users who hit a bad path stop using it. The intent disappears from telemetry — not because it was solved, but because it was abandoned. Declining volume in an intent class is an ambiguous signal and must be investigated, never celebrated.
- Capability expectations expand. As trust grows, users bring harder problems. The system's job difficulty rises even with a fixed model.
- Feedback is not representative. The users who rate are disproportionately the delighted and the furious. The vast middle is silent.
The practical consequence: input distribution must be monitored as a first-class signal, with the same rigor applied to output quality. Cluster incoming requests weekly, track cluster mass over time, and alert on both emergence and disappearance.
4.4 The Compounding Property
Traditional software degrades in discrete steps: a bug is introduced, it exists until fixed. AI systems degrade compoundingly, because drift vectors interact.
Knowledge drift adds contradictory documents → retrieval drift surfaces the wrong one more often → context drift means the corrective document is truncated → behavior drift means the model hedges instead of flagging the conflict → evaluation drift means none of it shows up in the score → business drift means the correct answer changed anyway.
Six individually minor deviations compose into a system that is confidently, articulately wrong about a policy that generates regulatory exposure.
AI reliability is not a property of the model. It is a property of the entire production system — and properties of systems must be maintained, not achieved.
Chapter 5 — Monitoring AI Beyond Accuracy
Accuracy is a lab instrument. It requires ground truth, which production does not provide, and it collapses a multi-dimensional system into a scalar that hides everything interesting.
What follows is a Reliability Telemetry Stack: four layers of signal, each answering a different question, each with a different labeling cost.
   ┌───────────────────────────────────────────────────────────┐
   │  L4 — BUSINESS      Did it produce value?                 │  slow, expensive, decisive
   ├───────────────────────────────────────────────────────────┤
   │  L3 — KNOWLEDGE     Was it grounded in current truth?     │  medium cost, high diagnostic value
   ├───────────────────────────────────────────────────────────┤
   │  L2 — INTERACTION   Did the human accept it?              │  free, high volume, leading indicator
   ├───────────────────────────────────────────────────────────┤
   │  L1 — OUTPUT        Was it well-formed and consistent?    │  free, unlabeled, fastest alarm
   └───────────────────────────────────────────────────────────┘

        FIGURE 4 — The Reliability Telemetry Stack
The design principle: L1 and L2 require no labels and are therefore continuous; L3 and L4 require judgment and are therefore sampled. Teams that start at L4 measure the right thing too slowly. Teams that stay at L1 measure quickly and learn nothing. You need all four, at different cadences.
Layer 1 — Output signals (continuous, unlabeled)
Answer Stability. Semantic agreement across n independent generations of the same input, plus agreement of the same input across time windows. Formally, the mean pairwise semantic similarity of n samples. Falling stability is the earliest available warning of context, retrieval, or model drift — and it needs no ground truth at all. Track at p50 and p10; the tail matters more than the mean.
Decision Consistency. For decision-shaped outputs (approve/deny, route/escalate, tier assignment), the rate at which equivalent cases receive equivalent decisions. Enterprise systems are judged on fairness as much as correctness; two customers with identical situations receiving different answers is a compliance event, not a quality nit.
Prompt Stability. A composite of contradiction density in the instruction set and behavioral variance on a fixed probe set. See Chapter 12.
Hallucination Frequency. Rate of claims not entailed by retrieved context, measured by automated entailment checking on a continuous sample. Report as unsupported claim rate per response, not as a binary per-response flag — a response with one unsupported clause among nine supported ones is a different failure than a fabricated response.
Layer 2 — Interaction signals (continuous, free)
These are the highest-value signals in production because users generate them without being asked.
Correction Rate. The fraction of conversations in which the user corrects, contradicts, or restates after an assistant response. Detected via classifier on the following turn ("no, I meant…", "that's not right", verbatim restatement). Correction Rate is the single best free proxy for real error rate, and it responds to drift weeks before satisfaction scores do.
Escalation Rate. Fraction of conversations reaching a human. Track alongside escalation reason, and separate appropriate escalation (the system correctly recognized its limits — a success) from failure escalation (the user gave up). Conflating these makes the metric useless.
Human Intervention Rate. In agentic or approval-gated systems, the fraction of proposed actions a human modifies or rejects. Rising intervention rate with stable acceptance means humans are compensating for degradation — a silent transfer of cost from the system to the staff.
Recovery Rate. When a conversation goes wrong, how often does the system recover within the same session without human help? Production quality is not the absence of errors; it is the ability to detect and repair them mid-flight. Systems with high error rates and high recovery rates outperform systems with low error rates and zero recovery.
User Trust Index. A composite behavioral measure, not a survey: return rate, task delegation depth (do users bring harder problems over time?), verification behavior (do they check the answer elsewhere?), and channel-abandonment rate. Trust is a lagging indicator that decays slowly and recovers slowly — which is exactly why it must be tracked separately from accuracy.
Accuracy is what your system does. Trust is what your users believe it does. They diverge, and the second one determines adoption.
Layer 3 — Knowledge signals (sampled)
Knowledge Freshness. Age-weighted currency of retrieved documents relative to the last change in their domain. A three-year-old article on a stable API is fresh; a six-week-old article on a policy revised last month is stale. Freshness must be measured against domain change rate, not calendar age.
Retrieval Precision. Precision@k on a rolling, harvested query set — not the launch-era canonical set, which is now a memorized benchmark. Weight by document authority tier.
Citation Quality. A three-part measure that most systems collapse into one: (a) presence — is there a citation; (b) support — does the cited passage actually entail the claim; (c) authority — is the cited source the correct one, given a better source exists. Most citation metrics measure only (a), which is why cited hallucination is common.
Context Reliability. Fraction of requests where all information required for a correct answer was present in the assembled prompt. Distinguishes retrieval failure from reasoning failure — a distinction that determines which team owns the fix.
Layer 4 — Business signals (sampled, decisive)
Production Accuracy. Expert-graded correctness on a stratified random sample of real production traffic, re-drawn every cycle. This is the number that means what everyone thinks the eval score means. It is expensive, and 200 well-stratified cases per cycle is usually enough to detect the movements that matter.
Evaluation Drift Score. The measured divergence between offline eval performance and Production Accuracy. When this exceeds a threshold, your instruments are lying and everything above is suspect.
Business outcome metrics. Containment rate, resolution rate, handle-time delta, conversion effect, cost per resolved contact. These are the only metrics an executive will act on, and they lag by weeks — which is precisely why the leading indicators above exist.
5.1 Cadence Design
| Signal class | Cadence | Cost | Role |
|---|---|---|---|
| L1 Output | Continuous | ~0 | Alarm |
| L2 Interaction | Continuous | ~0 | Leading indicator |
| L3 Knowledge | Weekly sample | Low–medium | Diagnosis |
| L4 Business | Monthly sample | High | Truth |
A working rule: anything you cannot measure without labels, you will measure too rarely to catch drift. Invest disproportionately in L1 and L2 instrumentation; they are what turn a quarterly surprise into a Tuesday alert.
Chapter 6 — Enterprise Case Study: The Assistant That Aged
Organization. A multi-category e-commerce marketplace. Roughly 2.4M SKUs across 40,000 sellers, four regions, three languages.
System. A customer-facing shopping assistant handling product discovery, comparison, availability, promotions, and order status. Retrieval over the catalog plus a merchandising knowledge base; tool access to inventory, pricing, promotions, and order services.
6.1 Launch
Pre-launch validation was thorough by any standard: 3,200 curated queries across intent classes, human-graded; a 5% shadow-traffic pilot for three weeks; adversarial red-teaming for pricing and availability claims.
| Metric | Pre-launch | Target |
|---|---|---|
| Offline eval accuracy | 96.4% | ≥ 95% |
| Product recommendation relevance (human-graded) | 92.1% | ≥ 90% |
| Availability claim accuracy | 99.1% | ≥ 99% |
| Escalation rate | 4.2% | ≤ 8% |
| Median latency | 1.8 s | ≤ 3 s |
Launch went well. Month-one business results beat plan: assisted conversion up, contact rate down.
6.2 Month Six
| Metric | Launch | Month 6 | Δ |
|---|---|---|---|
| Offline eval accuracy | 96.4% | 96.1% | −0.3 pt |
| Production Accuracy (sampled) | 94.0% | 81.2% | −12.8 pt |
| Correction Rate | 6.1% | 17.4% | +11.3 pt |
| Escalation rate | 4.2% | 11.9% | +7.7 pt |
| Assisted conversion (index) | 100 | 78 | −22% |
| User Trust Index | 0.71 | 0.44 | −0.27 |
The offline suite moved 0.3 points. Production moved 12.8. The instrument had decoupled from the system it was measuring — evaluation drift, hiding five other drift vectors behind it.
6.3 Root Cause Decomposition
Post-incident analysis attributed the degradation across surfaces:
| Contributing vector | Share of degradation | Mechanism |
|---|---|---|
| Retrieval drift (catalog growth) | ~31% | Catalog grew 2.4M → 3.9M SKUs. Long-tail listings with keyword-stuffed titles out-competed curated merchandising content. Precision@10 fell from 0.81 to 0.62 while recall stayed flat. |
| Business drift (promotions) | ~24% | Promo engine moved from weekly campaigns to continuous personalized offers. The assistant's promo context was assembled from a weekly snapshot. Quoted prices were wrong for 19% of personalized sessions. |
| User drift (traffic mix) | ~18% | Mobile share 38% → 67%; median query length 8.4 → 3.1 words. The assistant, tuned on descriptive queries, had no strategy for three-word underspecified intents beyond guessing. |
| Data drift (schema) | ~14% | A seller-onboarding change made availability_region nullable. Nulls reached the model as absent rather than unknown; it defaulted to "available." |
| Knowledge drift (merch content) | ~9% | 2,100 seasonal merchandising documents accumulated without expiry. Winter guides were retrieved in June. |
| Model version drift | ~4% | A routine provider upgrade shortened responses; comparison answers lost the trade-off framing that drove conversion. |
Not one of these is a model defect. Every one is an environmental change that the validation system was structurally unable to see.
6.4 The Detection Failure
The deeper finding was not why quality fell but why it took six months to notice. Three structural gaps:
- No unlabeled leading indicators. Correction Rate and Answer Stability were computable from data already being logged, but were not computed. Retrospective analysis showed Correction Rate crossed its natural threshold in week 7 — nineteen weeks before anyone raised an alarm.
- Aggregate-only reporting. Mobile-segment accuracy fell below 70% by month three. The blended number stayed above 88% until month five.
- A frozen oracle. The eval set was never re-drawn from production traffic, so it continued to measure launch-era desktop users asking well-formed questions — a population that no longer existed.
6.5 Instrumented Remediation
Post-remediation reporting was rebuilt around the metric system in Chapter 12. (Values below are illustrative placeholders for the QAtronic reporting layer; replace with live instrumentation output.)
| QAtronic metric | Pre-remediation | Post-remediation (90 days) | Target |
|---|---|---|---|
| Production Gap Score | {{PGS_BEFORE}} — 0.61 |
{{PGS_AFTER}} — 0.19 |
≤ 0.25 |
| Production Stability Index | {{PSI_BEFORE}} — 0.52 |
{{PSI_AFTER}} — 0.87 |
≥ 0.85 |
| Knowledge Freshness Score | {{KFS_BEFORE}} — 0.44 |
{{KFS_AFTER}} — 0.91 |
≥ 0.90 |
| Retrieval Health | {{RH_BEFORE}} — 0.62 |
{{RH_AFTER}} — 0.84 |
≥ 0.80 |
| Evaluation Confidence | {{EC_BEFORE}} — 0.38 |
{{EC_AFTER}} — 0.88 |
≥ 0.85 |
| Prompt Drift Index | {{PDI_BEFORE}} — 0.47 |
{{PDI_AFTER}} — 0.12 |
≤ 0.20 |
| Context Reliability | {{CR_BEFORE}} — 0.71 |
{{CR_AFTER}} — 0.93 |
≥ 0.90 |
| AI Reliability Index | {{ARI_BEFORE}} — 0.55 |
{{ARI_AFTER}} — 0.86 |
≥ 0.85 |
| Mean time to drift detection | {{MTTD_BEFORE}} — 19 wk |
{{MTTD_AFTER}} — 6 days |
≤ 14 days |
The interventions were unglamorous: authority-tiered retrieval with expiry on merchandising content, real-time promotion context, explicit null semantics at the tool boundary, a mobile-specific clarification strategy, continuous Correction Rate monitoring with segment-level alerting, and a monthly-refreshed Living Eval Set drawn from production.
Recovery took eleven weeks. Trust took twenty-two. Production Accuracy returned to 93.1% by week 11; the User Trust Index did not return to 0.70 until week 22. Trust is a slower variable than quality, and that asymmetry should shape how aggressively teams protect it.
Chapter 7 — Continuous AI Validation
Validation in classical software is an event: a gate the artifact passes on its way to production. Validation in AI systems must be a process: a control loop that runs for the lifetime of the system, because the thing being validated against — the environment — will not hold still.
7.1 The AI Validation Pipeline
   ┌─────────────┐   ┌─────────────┐   ┌─────────────┐   ┌─────────────┐
   │ 1. HARVEST  │──▶│ 2. STRATIFY │──▶│ 3. GROUND   │──▶│ 4. EXECUTE  │
   │ prod traffic│   │  by risk &  │   │  truth via  │   │  candidate  │
   │  + signals  │   │   segment   │   │ expert+judge│   │   configs   │
   └─────────────┘   └─────────────┘   └─────────────┘   └──────┬──────┘
          ▲                                                      │
          │                                                      ▼
   ┌──────┴──────┐   ┌─────────────┐   ┌─────────────┐   ┌─────────────┐
   │ 7. FEED BACK│◀──│ 6. CERTIFY  │◀──│ 5. COMPARE  │◀──│   scoring   │
   │ into corpus │   │  or block   │   │ vs baseline │   │             │
   └─────────────┘   └─────────────┘   └─────────────┘   └─────────────┘

        FIGURE 5 — The AI Validation Pipeline (continuous, not gated)
1. Harvest. Continuously sample production traffic, weighted toward high-risk intents, negative interaction signals, novel input clusters, and low-stability responses. Harvesting is not logging; it is selection, and selection quality determines everything downstream.
2. Stratify. Partition by intent class, risk tier, channel, segment, and language. Every reported metric is computed per stratum. Aggregate figures are for executives; strata are for engineers.
3. Ground truth. Establish correct answers through a hybrid: automated judge for volume, human expert for the risk-weighted subset, with a mandatory overlap sample used to measure judge–human agreement. When agreement drops below threshold, the judge is retired, not the humans.
4. Execute. Run current production config, candidate configs, and the previous baseline over the same stratified set. Always three, never two — you need to know both whether the candidate is better and whether the environment has moved under the baseline.
5. Compare. Report per-stratum deltas with confidence intervals. A 0.4-point aggregate gain that hides an 8-point loss in the highest-risk stratum is a regression.
6. Certify or block. Certification is time-bounded: a configuration is certified for a window, not forever. When the window expires without re-validation, the system is running uncertified — and dashboards should say so, in the same tone infrastructure dashboards use for expired certificates.
7. Feed back. Newly labeled cases enter the Living Eval Set; resolved failures become regression cases; novel clusters become new strata.
7.2 The Living Eval Set
A static eval set has a shelf life of roughly two quarters. The alternative is an eval corpus with explicit lifecycle management:
- Composition target: ~50% harvested production traffic (rolling, refreshed monthly), ~30% authored regression cases from resolved incidents, ~15% adversarial and policy probes, ~5% sealed holdout never used for tuning.
- Expiry: every case carries a label date and a domain; cases whose domain has changed since labeling are quarantined for re-labeling automatically.
- Contamination control: cases used more than k times in tuning move to a "burned" pool and stop counting toward the headline number.
- Freshness SLO: median case age below one quarter.
Passing QA is the beginning of AI engineering — not the end.
7.3 Validation Triggers
Continuous does not mean uniform. Full re-validation is triggered by any of:
| Trigger | Scope |
|---|---|
| Model version change | Full + shadow traffic ≥ 1 business cycle |
| Embedding or chunker change | Full retrieval + end-to-end |
| Prompt change | Affected strata + policy probes |
| Policy or pricing change | Policy probes + business-accuracy sample |
| Knowledge base bulk change (>2% of corpus) | Retrieval + freshness audit |
| Tool schema or enum change | Integration strata + value-domain probes |
| Input distribution shift beyond threshold | Re-stratify + harvest new cases |
| Certification window expiry | Full |
Chapter 8 — The AI Production Lifecycle: A Maturity Model
Maturity models are often vanity ladders. This one is defined by a single functional question at each level: what class of change can the organization absorb without silent degradation?
Level 1 — Demo
Absorbs: nothing.
The system works on curated inputs in front of an audience. Prompts live in notebooks or a config file with no owner. Evaluation is a person deciding it looked good. There is no logging beyond request/response. Every environmental change degrades it, and nobody would know.
Typical Production Gap Score: 0.7–0.9. Appropriate for: proving feasibility. Dangerous when: someone shows it to a customer.
Level 2 — Pilot
Absorbs: obvious breakage.
Real users, bounded scope, a curated eval set, and a human in the loop who notices when things go wrong. Failures are caught socially, by champions who report them. Prompts are versioned. Logs exist and are occasionally read.
Typical PGS: 0.4–0.7. The characteristic Level 2 failure is mistaking champion satisfaction for reliability. Pilot users are tolerant, briefed, and motivated; they are not a sample of your production population.
Level 3 — Production
Absorbs: single, visible changes.
Continuous quality monitoring, alerting on interaction signals, defined incident response, staged rollout, segment-level reporting. When the model version changes or an API breaks, the team detects and responds within days.
Typical PGS: 0.2–0.4. The characteristic Level 3 failure is the silent, slow vector — knowledge, retrieval, evaluation drift — which passes under alerting thresholds because each week's movement is within noise.
Level 4 — Continuous Learning
Absorbs: gradual, silent drift.
The Validation Pipeline runs continuously. The eval set is living. Correction and feedback loops route real failures back into knowledge, prompts, and regression suites on a defined SLA. Drift metrics are dashboarded and owned. Knowledge freshness is governed. Certification windows are enforced.
Typical PGS: 0.1–0.2. The organization now measures the gap rather than discovering it. The characteristic Level 4 failure is organizational: engineering has closed its loops, but Legal, Content, and Finance still change the ambient specification without notifying anyone.
Level 5 — Adaptive Enterprise AI
Absorbs: structural change.
The AI system is a first-class participant in organizational change management. Content, policy, pricing, and process changes emit events the AI platform consumes. Launch checklists in every function include AI impact review. Validation is automatic on ambient-specification change, not on calendar. Model, retrieval, and prompt configurations are portable and re-certifiable within days. The organization can swap a foundation model in a fortnight without a quality incident.
Typical PGS: < 0.1. Level 5 is not about better models. It is about an organization that has internalized the fact that it is continuously re-specifying its AI systems, and built the plumbing to say so out loud.
Level Comparison
| L1 Demo | L2 Pilot | L3 Production | L4 Continuous | L5 Adaptive | |
|---|---|---|---|---|---|
| Eval set | Ad hoc | Curated, static | Curated + regression | Living, refreshed | Living + ambient-triggered |
| Monitoring | None | Manual review | Automated quality alerts | Full telemetry stack | Telemetry + org change feeds |
| Drift detection | — | Anecdotal | Fast vectors only | All 12 vectors | Predictive / pre-emptive |
| Feedback loop | — | Ad hoc bug reports | Ticket-driven | SLA'd correction loop | Closed-loop with owners |
| Incident response | — | Best effort | Defined runbook | AI-specific severity model | Cross-functional, rehearsed |
| Ownership of ambient spec | None | None | AI team, informally | AI team, explicitly | Distributed, accountable |
| Model migration cost | Unknown | Weeks + risk | Weeks | Days | Days, routine |
| Typical PGS | 0.7–0.9 | 0.4–0.7 | 0.2–0.4 | 0.1–0.2 | < 0.1 |
Most enterprises with a deployed assistant sit at Level 2.5 — production traffic, pilot-grade validation. That mismatch is the Production Gap's natural habitat.
Chapter 9 — Production Observability
Observability for AI systems has a stricter requirement than observability for services. For a service, you need to know what happened. For an AI system, you need to be able to reconstruct why a specific answer was produced, months later, when every input has changed.
Call this property reconstructability. It is the design constraint that distinguishes AI observability from logging.
9.1 The Reconstructability Test
Pick a conversation from four months ago. Can you answer, from stored data alone:
- What exact prompt was sent — after templating, retrieval injection, history compression, and truncation?
- Which documents were retrieved, at what scores, in what order, and what those documents said at that time?
- Which model version, decoding parameters, and execution path served it?
- Which tools were called, with what arguments, and what they returned?
- What the applicable business rules and policies were on that date?
- What the user did next?
If any answer is no, you cannot diagnose drift — you can only speculate about it. Most teams fail on the third question in the first bullet (post-truncation prompt) and on the "at that time" clause in the second.
If you cannot reconstruct the decision, you cannot debug the drift. You can only re-guess it.
9.2 The Observability Surfaces
| Surface | Captures | Retention | Primary use |
|---|---|---|---|
| Structured logs | Request, response, latency, cost, path, model, config hash | 90 d hot / 13 mo cold | Volume analysis, segmentation |
| Distributed tracing | Full span tree: retrieve → assemble → generate → tool → post-process | 30 d | Latency, failure localization |
| Prompt archive | Fully assembled prompt as sent, hashed or redacted | 13 mo | Context drift diagnosis |
| Knowledge snapshots | Content-addressed corpus state per index build | Per build, 13 mo | "What did the doc say then?" |
| Retrieval records | Query, candidates, scores, ranks, filters applied | 90 d | Retrieval drift |
| Evaluation results | Per-case, per-stratum, per-config, with judge rationale | Indefinite | Trend, regression, judge audit |
| User feedback | Explicit ratings + implicit signals (corrections, abandonment, reformulation) | Indefinite | Trust, leading indicators |
| Human review | Expert grades with reason codes | Indefinite | Ground truth, calibration |
| Business KPIs | Containment, resolution, conversion, handle time | Indefinite | Outcome linkage |
| Version manifest | Model + prompt + retrieval + policy + corpus versions per request | 13 mo | Version comparison, blame |
The last row is the one that turns a pile of logs into an instrument. Every request should carry a composite configuration fingerprint — a hash over model version, prompt version, retrieval config, index build ID, policy version, and feature flags. With it, every metric becomes sliceable by configuration and every regression becomes bisectable. Without it, you are correlating quality against deploy timestamps and hoping.
9.3 Conversation Replay and Counterfactual Diffing
Replay is the workhorse diagnostic. Three modes, each answering a different question:
- Faithful replay — re-execute against the historical snapshot (same index build, same documents, same config). Question: was this a system error at the time?
- Current replay — re-execute the historical input against today's system. Question: have we fixed it, or broken it further?
- Counterfactual diff — hold everything constant except one surface (corpus, prompt, model, retrieval config) and re-execute. Question: which surface caused it?
Counterfactual diffing over a batch of failures is the single most efficient method for attributing degradation to a specific drift vector — it converts a debate into an experiment, and it is what produced the attribution table in Chapter 6.
9.4 Error Analysis as a Standing Function
Automated metrics tell you that quality moved. Only structured human error analysis tells you what kind of wrong it is.
Maintain a stable failure taxonomy with reason codes — retrieval miss, context truncation, stale knowledge, policy conflict, tool error, unsupported claim, misunderstood intent, correct-but-unhelpful — and require every sampled failure to be coded. Track the distribution over time. A shifting failure mix is a drift signature even when the total rate is flat: 8% error that has migrated from "misunderstood intent" to "stale knowledge" is a different system than it was last quarter, with a different owner and a different fix.
Chapter 10 — Human Feedback: The Correction Economy
Feedback in AI systems is usually discussed as a data-collection problem. It is better understood as an economy: corrections are produced at a cost by humans and consumed at a benefit by the system, and most enterprises run this economy at a catastrophic loss — collecting corrections that never change behavior.
10.1 The Feedback Ladder
Five rungs, ordered by cost per signal and by leverage.
| Rung | Signal | Cost | Volume | Latency to fix | Leverage |
|---|---|---|---|---|---|
| 1 | Implicit — reformulation, abandonment, copy events, dwell | Free | Very high | — | Detection only |
| 2 | Explicit ratings — thumbs, stars | Free | Low (2–10% of failures) | Days | Weak, biased |
| 3 | Corrections — user states the right answer inline | Free | Medium | Days | Highest value per unit cost |
| 4 | Agent edits — human operator rewrites before sending | Cheap | Medium | Hours | Very high, directly labeled |
| 5 | Expert review — SME grades with reason codes | Expensive | Low | Weeks | Authoritative ground truth |
The chronic mistake is building the entire feedback strategy on rung 2, which is the lowest-yield rung on the ladder: low volume, self-selected, and uninformative about what the right answer was. Rungs 3 and 4 are nearly free and carry the answer inside them.
Rung 4 deserves specific attention. In any human-in-the-loop configuration, the operator's edit is a labeled correction generated as a byproduct of work already being paid for. Capturing the diff between proposed and sent — and coding it — is the cheapest high-quality training and evaluation signal available to an enterprise. Most organizations discard it.
10.2 Correction Routing
A correction is worthless until it is routed to the surface that caused the failure. Route by reason code:
   CORRECTION ──▶ triage & reason code ──┬──▶ KNOWLEDGE  (stale/missing doc)  ──▶ content owner, SLA 5d
                                         ├──▶ RETRIEVAL  (present but unfound) ──▶ ranking/chunking backlog
                                         ├──▶ PROMPT     (instruction gap)     ──▶ prompt change + probe
                                         ├──▶ TOOL/DATA  (bad input)           ──▶ integration owner
                                         ├──▶ POLICY     (rule conflict)       ──▶ policy owner + probe suite
                                         └──▶ MODEL      (reasoning failure)   ──▶ regression case + tuning
                          ALL PATHS ─────────────────────▶ LIVING EVAL SET

        FIGURE 6 — Correction routing: every failure has an owner and an exit
Two rules make this work. Every correction gets a reason code and an owner — unrouted feedback accumulates in a queue and expires. Every correction becomes a regression case, regardless of route, so the same failure cannot silently return after a knowledge edit is reverted by a content refresh.
10.3 Knowledge Updates as the Primary Repair Path
In retrieval-based enterprise systems, the majority of production failures are correctly fixed by editing the knowledge base, not the model or the prompt. This has an organizational consequence teams consistently underestimate: your content team is now part of your incident response. They need an intake channel, an SLA, and visibility into which documents are generating failures.
A ranked "documents implicated in failures" report, refreshed weekly and delivered to content owners, typically produces more measurable quality improvement per engineering hour than any prompt work.
10.4 Approval Workflows and the Autonomy Ratchet
Approval gates are a quality control and a data source, but they carry a trap: gates that never open produce cost without learning, and gates that open too fast produce incidents.
Govern autonomy with an explicit ratchet: an action class graduates from human approves each → human samples → autonomous with audit only when it meets a pre-declared threshold — for example, ≥ 98% approval rate over ≥ 500 consecutive actions with zero severity-1 events. Equally important, the ratchet must turn backward automatically when approval rate falls below threshold. Autonomy that can only increase is not governance.
Chapter 11 — AI Incident Response
AI failures are treated as quality issues when they should be treated as incidents. The reason they usually aren't is that they don't look like incidents: nothing is down, error rates are normal, and the pager is quiet.
Three properties make AI incidents structurally different from service incidents:
- Diffuse onset. They begin gradually and lack a clear start time.
- Silent failure. The system reports success while producing wrong output.
- Retroactive blast radius. By the time you detect it, thousands of users have already received wrong answers — and some acted on them. Unlike an outage, an AI incident's damage is already distributed when you find it.
That last property changes the response: containment is necessary but not sufficient. AI incident response must include a retroactive phase that service incident response has no analogue for.
11.1 The DDCRVL Framework
   DETECTION ──▶ DIAGNOSIS ──▶ CONTAINMENT ──▶ RECOVERY ──▶ VALIDATION ──▶ LEARNING
       │             │              │              │             │             │
   TTD < 7d      attribute      stop the      fix + notify   prove it's    close the
   (the term     to surface     bleeding      affected       fixed under    detection
   that matters) via replay     (not always   users          real traffic   gap
                 + counterfac.  a rollback)
Detection. The dominant term in total AI incident cost is not time-to-repair but time-to-detection. A four-hour repair after a nineteen-week detection is a nineteen-week incident. Detection must be driven by unlabeled leading indicators (Chapter 5, L1/L2) with segment-level thresholds, because aggregate thresholds are where slow incidents hide.
Diagnosis. Attribute to a surface using counterfactual diffing over a batch of recent failures. Resist the reflex to open the prompt first; the prompt is the most visible surface, not the most probable cause. Order of investigation should follow the gap-contribution table in Chapter 2: knowledge, context, retrieval, then everything else.
Containment. Rollback is often unavailable — you cannot roll back the world. The containment toolkit for AI is different: narrow scope (disable affected intent classes), raise abstention (route uncertain cases to humans), lower autonomy (re-engage approval gates), pin configuration (freeze the index build), or degrade gracefully to a constrained mode. Abstention is a first-class containment primitive and should be built before it is needed.
Recovery. Fix the surface, then handle the retroactive tail: identify affected conversations from logs, assess which produced consequential action, and notify or correct where warranted. Enterprises regularly skip this and are surprised when a regulator asks for the list.
Validation. Prove the fix under production conditions, not in the harness that missed it. If the eval suite passed throughout the incident, the eval suite is also a defect and gets its own remediation item.
Learning. Two mandatory questions in every AI post-incident review, beyond the standard ones:
- Which drift vector was this, and what is our detection latency for that vector now?
- What change in the ambient specification triggered it, and who could have told us it was coming?
The second question is what upgrades an organization from Level 4 to Level 5.
11.2 AI Incident Severity
Severity should be driven by consequence and reversibility, not by volume.
| Sev | Definition | Examples | Response |
|---|---|---|---|
| 1 | Wrong output with irreversible or regulated consequence | Policy misstatement to a regulator, unauthorized disclosure, incorrect financial/medical guidance acted upon | Page immediately; contain within 1 h; legal notified; retroactive audit mandatory |
| 2 | Systematic wrong output in a business-critical path | Pricing errors, availability errors, wrong entitlements | Contain within 4 h; affected-user analysis |
| 3 | Broad quality degradation without consequential error | Relevance decline, rising correction rate | Ticket within 24 h; standard remediation |
| 4 | Localized or intermittent quality issue | Single intent class, single segment | Backlog with owner |
Note the asymmetry: a Sev-1 can affect eleven users and outrank a Sev-3 affecting eleven thousand. In AI systems, consequence dominates volume, and severity models inherited from service reliability get this backwards.
Chapter 12 — Engineering Metrics: The AI Reliability Index
This chapter specifies the metric system referenced throughout the paper. Every metric is normalized to [0, 1] where 1 is healthy, so that composites are meaningful and dashboards are readable at a glance.
12.1 Component Metrics
Production Gap Score (PGS) — inverted: lower is better. The normalized sum of gap contributions across the eight surfaces (Chapter 2), where each surface contributes the product of its change velocity, detection latency, and blast radius, scaled against a reference envelope.
PGS = Σᵢ (vᵢ · lᵢ · bᵢ) / Σᵢ (v_maxᵢ · l_maxᵢ · bᵢ)Interpretation: the fraction of your maximum plausible exposure you are currently carrying. Target ≤ 0.25. The fastest lever is l (detection latency), not v.
Production Stability Index (PSI). Consistency of quality over rolling windows: PSI = 1 − (σ_w / μ_w) where σ and μ are the standard deviation and mean of weekly Production Accuracy over a 12-week window, per stratum, aggregated by risk weight. A system oscillating between 91% and 78% is worse than a steady 84%, because users calibrate on the worst experience. Target ≥ 0.85.
Knowledge Freshness Score (KFS). KFS = Σ_d w_d · f(age_d / halflife_domain(d)) / Σ_d w_d, over retrieval-weighted documents, where f decays from 1 to 0. Age is scaled by domain change rate, not calendar time. Target ≥ 0.90.
Prompt Drift Index (PDI) — inverted. PDI = α · contradiction_density + β · behavioral_variance + γ · unreviewed_clause_ratio. Contradiction density comes from automated pairwise clause analysis; behavioral variance from a fixed probe set run against successive prompt versions; unreviewed clause ratio from the fraction of instruction tokens with no owner or review date. Target ≤ 0.20.
Retrieval Health (RH). RH = 0.4 · precision@k + 0.3 · authority_weighted_share + 0.3 · (1 − stale_retrieval_rate), computed on a rolling harvested query set. Recall is deliberately excluded from the headline: in mature corpora, recall is rarely the binding constraint and its stability masks precision decay. Target ≥ 0.80.
Evaluation Confidence (EC). EC = 0.3 · label_freshness + 0.3 · judge_human_agreement + 0.2 · (1 − eval_prod_distribution_distance) + 0.2 · outcome_correlation. This metric gates all others. When EC < 0.7, no other number in this chapter should be trusted or reported without a caveat. Target ≥ 0.85.
Context Reliability (CR). Fraction of requests in which every element required by the ground-truth answer was present in the assembled prompt as sent. Measured on the sampled evaluation stream. Separates retrieval failure from reasoning failure. Target ≥ 0.90.
Citation Accuracy (CA). CA = presence_rate · support_rate · authority_rate. Multiplicative by design — a cited claim that the citation does not support is worse than an uncited claim, because it manufactures unearned confidence. Target ≥ 0.92.
Escalation Cost (EscC). EscC = (failure_escalations × cost_per_human_contact) + (missed_escalations × cost_per_incident). Reported in currency, not ratio. Its purpose is to make abstention economically legible: over-escalation and under-escalation both cost money, and the optimum is rarely at either extreme.
Human Trust Index (HTI). HTI = 0.3 · return_rate + 0.25 · delegation_depth + 0.25 · (1 − verification_rate) + 0.2 · (1 − abandonment_rate), all normalized against a launch baseline. Behavioral, not survey-based. Recovers at roughly half the rate it declines — treat as a capital asset, not a metric.
Business Accuracy (BA). Expert-graded correctness restricted to commercially and legally consequential intent classes, sampled monthly. Weighted by consequence, not frequency. Target ≥ 0.97 for regulated domains.
Operational Confidence (OC). OC = certified_traffic_share × (1 − uncertified_config_drift) — the fraction of production traffic served by a configuration currently inside its certification window, discounted by how far live configuration has moved from the certified one. A system with excellent quality metrics and OC = 0.3 is lucky, not reliable.
AI Reliability Index (ARI). The composite:
ARI = EC × [ 0.25·PSI + 0.15·(1−PGS) + 0.15·KFS + 0.15·RH
           + 0.10·CR + 0.10·CA + 0.10·(1−PDI) ]
Evaluation Confidence multiplies rather than adds. This is the central design decision of the whole system: if you cannot trust your measurement, you do not have reliability — you have an unverified claim. A system with perfect component scores and EC = 0.4 reports ARI ≤ 0.4, and that is the correct answer.
12.2 Reading the Index
| ARI | State | Meaning |
|---|---|---|
| ≥ 0.90 | Governed | Drift detected before users notice |
| 0.80–0.90 | Healthy | Drift detected within one cycle |
| 0.65–0.80 | Exposed | Degradation is happening and partially invisible |
| 0.45–0.65 | Blind | Quality is unknown; reported numbers unreliable |
| < 0.45 | Uninstrumented | Production behavior is anecdote |
Most enterprise assistants, honestly measured in their second quarter of production, land between 0.55 and 0.75 — not because the engineering is bad, but because the measurement system was built for launch and never rebuilt for operation.
12.3 Implementation Order
You do not build thirteen metrics. You build them in the order of cost-to-value:
- Correction Rate + Answer Stability (free, unlabeled, fastest warning).
- Configuration fingerprinting (makes everything else sliceable).
- Evaluation Confidence (tells you whether your existing numbers mean anything).
- Knowledge Freshness + Retrieval Health (the two highest-contribution surfaces).
- Context Reliability + Citation Accuracy (diagnostic separation).
- PSI, PGS, ARI (composites, once components are stable).
Teams that build in this order have a working early-warning system in about six weeks. Teams that start with the composites spend a quarter building a dashboard nobody trusts.
Chapter 13 — The First 180 Days After Launch
The failure pattern in Chapter 6 is not random. It has a schedule, and the schedule is predictable enough to plan against. Each phase has a dominant risk and a primary question.
Month 1 — Distribution Shock
Dominant risk: the real input distribution is nothing like the eval set.
Expect a step-change in input entropy on day one: shorter queries, unanticipated intents, languages you did not plan for, and a long tail of requests that are out of scope but phrased as if in scope.
Instrument: input clustering (weekly), Correction Rate by cluster, coverage gap rate (requests with no confident intent match), abstention rate. Act on: the top five uncovered clusters. Harvest them into the eval set immediately. Primary question: Who is actually using this, and what are they actually asking?
Month 2 — Trust Formation
Dominant risk: early failures set durable expectations in specific user segments.
Trust is being established now, per segment, and it is path-dependent. A segment that experiences three failures in its first five interactions may never return, and its disappearance will look like low demand.
Instrument: cohort retention by first-week experience; segment-level accuracy; escalation reason mix; delegation depth trend. Act on: any segment whose return rate is below cohort baseline. Fix segment-specific failures before general ones — the general ones are being averaged into acceptability. Primary question: Which users are quietly leaving, and why?
Month 3 — First Drift
Dominant risk: the first environmental changes since launch have landed, unnoticed.
By now the knowledge base has moved, at least one policy or price has changed, and the input distribution has shifted. This is when the offline/production divergence first becomes measurable — and the last cheap moment to catch it.
Instrument: Evaluation Drift Score (offline vs. sampled Production Accuracy), Knowledge Freshness, Retrieval Health, behavioral fingerprint vs. launch baseline. Act on: the first full re-validation cycle. Re-harvest the eval set. Re-certify. Primary question: Do our instruments still agree with reality?
Month 4–5 — Compounding
Dominant risk: interaction between drift vectors, and the organizational gap.
Individually acceptable deviations begin composing (Chapter 4.4). Simultaneously, the honeymoon ends: other functions have shipped changes without considering the AI system, and nobody has told anyone.
Instrument: counterfactual diffing on failure batches; failure-mode distribution shift; ambient-specification change log (manual, if necessary). Act on: establish the cross-functional change feed. Add the AI system to launch checklists in content, pricing, policy, and ops. This is the Level 4 → Level 5 transition, and month four is when the pain is fresh enough to get it approved. Primary question: What changed around us that we did not hear about?
Month 6 — Verdict
Dominant risk: trust has diverged from quality, and only one of them is on the dashboard.
At month six the business decides, informally, whether the system is trusted. This decision is made by CSMs, support leads, and users — not by the metrics review.
Instrument: full ARI baseline; HTI vs. Production Accuracy divergence; business outcome attribution; cost per resolved interaction. Act on: if HTI is falling while accuracy is stable, you have a communication and consistency problem, not an accuracy problem — usually inconsistency (low PSI) or confident wrongness (low CA). Fix stability before chasing points of accuracy. Primary question: Do people believe this system, and are they right to?
The first 180 days do not test the model. They test whether the organization noticed the world moving.
Chapter 14 — The AI Production Readiness Checklist
Forty questions, grouped by surface. Score each 0 (no), 1 (partial), 2 (yes, with evidence). Maximum 80. Below 40, the system is running on hope; 40–59 is Level 3; 60–71 is Level 4; 72+ is Level 5.
The questions are written to be un-bluffable: each asks for a mechanism, not an intention.
Knowledge & Retrieval
- Can you produce, on demand, the exact text of every document retrieved for a conversation four months ago?
- Does every document in the corpus carry an authority tier, an effective date, and an expiry?
- What is the median age of documents retrieved in the last 7 days, scaled by domain change rate?
- When a document is superseded, is the predecessor tombstoned and de-indexed automatically?
- Do you re-measure retrieval precision against harvested queries rather than the launch-era benchmark?
Context & Prompting
- Do you log the fully assembled prompt as sent, after truncation?
- Is truncation an alerted error condition with a measured rate, or a silent fallback?
- Can you state your system's current behavioral contract in one page, and does it match the prompt?
- Does every instruction clause have a named owner and a review date?
- When was the last time a clause was deleted from the system prompt?
Evaluation
- What percentage of your eval set is harvested from real production traffic in the last quarter?
- What is the measured agreement between your LLM judge and human experts, and when was it last measured?
- Do you maintain a sealed holdout set never used for tuning?
- What is the gap between your offline eval score and expert-graded Production Accuracy?
- Are eval cases automatically quarantined when their domain changes?
Monitoring & Detection
- Do you compute Correction Rate continuously, without relying on explicit user ratings?
- Are all quality metrics reported by segment, channel, language, and execution path — not just in aggregate?
- Do you maintain a behavioral fingerprint baseline and alert on distributional distance?
- Do you monitor the input distribution and alert on cluster emergence and disappearance?
- What is your measured mean time to drift detection, by vector?
Configuration & Change
- Does every request carry a composite configuration fingerprint (model, prompt, retrieval, index build, policy)?
- Can you bisect a quality regression to a specific configuration change?
- Is a fallback model's output quality measured independently of the primary path?
- Do you validate model migrations with shadow traffic over a full business cycle, not just an eval run?
- Are embedding-model and chunking changes treated as model-class changes requiring full re-validation?
Integrations & Data
- Do you alert on new enum values, new fields, and null-rate shifts at every tool boundary?
- Does an unrecognized upstream value raise a handled condition, or does it flow into a prompt?
- Are tool descriptions versioned and reviewed when the underlying service changes semantics?
- Do you know which upstream teams can change the meaning of data your system reasons over?
- Is there a contract test that fails when the policy document and the guardrail configuration disagree?
Human Loop & Incident Response
- Are human operator edits captured as labeled corrections and routed by reason code?
- Does every correction produce a regression case, regardless of which surface fixed it?
- Is there an SLA for knowledge-base corrections, owned by the content team?
- Do you have an abstention/degraded mode that can be engaged without a deployment?
- Does your incident severity model rank consequence above volume, and include a retroactive-notification phase?
Organizational
- Is the AI system on the launch checklist for pricing, policy, content, and process changes?
- Can you enumerate who, outside engineering, is authorized to change your system's effective specification?
- Is there a named owner for each of the eight mutable surfaces?
- Does any configuration in production have an expired certification window, and does a dashboard say so?
- If your foundation model were deprecated with 60 days' notice, what would your migration take — and what would you not be able to validate?
Question 40 is the compression of the entire paper. A team that can answer it precisely has built everything in the preceding chapters. A team that cannot has a Production Gap it has not measured.
Chapter 15 — Recommended Visual Assets
For teams adapting this material into internal documentation, architecture reviews, or board reporting.
15 Diagrams
- The Eight Mutable Surfaces (Figure 1) — model at center, surfaces orbiting.
- Drift Taxonomy quadrant: speed × visibility (Figure 2).
- The Three Clocks: organization / system / validation, with the gap shaded (Figure 3).
- Reliability Telemetry Stack, four layers with cadence and cost annotations (Figure 4).
- AI Validation Pipeline, seven stages with the feedback loop closed (Figure 5).
- Correction routing map, reason code → owner → SLA (Figure 6).
- DDCRVL incident flow with TTD emphasized as the dominant cost term.
- Environment Entropy Ladder: lab → pilot → production across five axes.
- Silent coupling illustration: green pipeline, 200 responses, wrong answer.
- Counterfactual diffing: one surface varied, five held constant.
- Reconstructability chain: request → prompt archive → index snapshot → version manifest.
- Autonomy ratchet with forward and backward transitions.
- Compounding drift cascade: six minor deviations composing into one regulatory event.
- Eval set composition and lifecycle, with the burned-case pool.
- Trust vs. accuracy recovery curves after an incident (asymmetric slopes).
10 Comparison Tables
- Testing vs. pilot vs. production across eight dimensions.
- Traditional software vs. AI system failure characteristics.
- The eight surfaces: velocity × latency × blast radius.
- Twelve drift vectors: speed, visibility, half-life, owner.
- Ambient specification ownership map.
- Telemetry layers: cadence, cost, labeling requirement.
- Feedback ladder: cost, volume, leverage.
- AI incident severity vs. classical severity.
- Maturity level comparison matrix.
- Metric definitions, formulas, targets, and owners.
5 Maturity Models
- The AI Production Lifecycle (Levels 1–5, Chapter 8).
- Evaluation maturity: ad hoc → curated → living → ambient-triggered.
- Observability maturity: logs → traces → replay → reconstructable.
- Feedback maturity: ratings → corrections → routed → closed-loop.
- Organizational maturity: AI team owns everything → distributed accountable ownership.
5 Dashboards
- Executive: ARI, PGS, Production Accuracy, HTI, business outcome, with trend arrows only.
- Engineering: L1/L2 signals live, segmented by configuration fingerprint.
- Knowledge: freshness heatmap by domain, documents implicated in failures, correction SLA burn-down.
- Validation: certification windows, EC, eval set composition and age, per-stratum deltas.
- Incident: TTD by vector, open incidents by severity, retroactive notification status.
10 Infographics
- "98% in testing, 81% in production" — the divergence chart.
- Nine of twelve drift vectors are silent.
- Only 25% of your specification is in your repository.
- Your reported failure rate vs. your real failure rate.
- Detection latency is the cheapest lever.
- Half-life table as a re-validation calendar.
- The first 180 days, one panel per phase.
- What a Sev-1 AI incident looks like (small volume, large consequence).
- Trust falls fast, returns slowly.
- Six weeks to an early-warning system: the implementation order.
Conclusion
The Meridian assistant from the introduction was never broken. It was abandoned in place — left pointing at a world that had moved on while everyone assumed that a passing test suite meant a working system.
This is the reframe worth carrying out of this paper: an AI system in production is not an artifact. It is a continuously re-specified system whose correctness is a joint property of the model, the knowledge, the rules, the users, the integrations, and the organization's ability to notice when any of those change.
Which means reliability work is largely not model work. It is detection latency, ambient specification ownership, eval set lifecycle, configuration fingerprinting, correction routing, certification windows, and the unglamorous organizational plumbing that lets a policy change in Legal reach an engineer's dashboard before it reaches a customer's screen.
The organizations that succeed with enterprise AI are not the ones with the best models. Models are increasingly a commodity, swapped on a provider's deprecation schedule. The winners are the ones that built the instruments to know, on any given Tuesday, whether their system still agrees with the world — and the loops to close the gap when it does not.
Testing proves the system works today. Production proves whether it can keep working tomorrow.
Enterprise AI does not succeed because the model is accurate. It succeeds because the organization continuously validates everything surrounding the model.
The model is one component of an evolving production system. Engineer the system.
Frequently Asked Questions
What is the Production Gap in AI systems? The Production Gap is the distance between the environment an AI system was validated in and the environment it currently operates in, plus the degradation that distance produces. It is measurable as the product of change velocity, detection latency, and blast radius across eight mutable surfaces: knowledge, business rules, users, integrations, data, prompts, infrastructure, and context.
Why does an AI system degrade when the model has not changed? Because the model is only one input to correctness. The knowledge base, business rules, user population, upstream APIs, and context assembly all change independently of the model. When they change and the system does not adapt, the model produces confident answers based on a specification that is no longer current.
Why do offline evaluations stay high while production quality falls? Evaluation drift. Eval sets are frozen snapshots of launch-era traffic with labels that become obsolete as policy changes, judges that drift with their own model versions, and cases that have been implicitly optimized against through repeated tuning. When offline scores and business signals disagree, assume the evaluation is wrong first.
What should we monitor besides accuracy? Start with signals that need no labels: Correction Rate, Answer Stability, escalation reason mix, and behavioral fingerprints. Add sampled knowledge-layer metrics (Knowledge Freshness, Retrieval Health, Context Reliability, Citation Accuracy) and monthly expert-graded Production Accuracy. Accuracy alone is a lagging, label-expensive scalar that hides segment-level collapse.
How often should AI systems be re-validated? At least as often as half the shortest relevant drift half-life — typically every two to four weeks for retrieval and context, immediately on model, embedding, policy, or pricing changes, and continuously through a harvested evaluation stream. Certification should be time-bounded, so an un-revalidated configuration is visibly uncertified rather than silently trusted.
What is a realistic first step for a team already in production? Compute Correction Rate and Answer Stability from data you already log, add a configuration fingerprint to every request, and measure Evaluation Confidence. Those three take roughly six weeks and convert a quarterly surprise into a weekly signal.



