
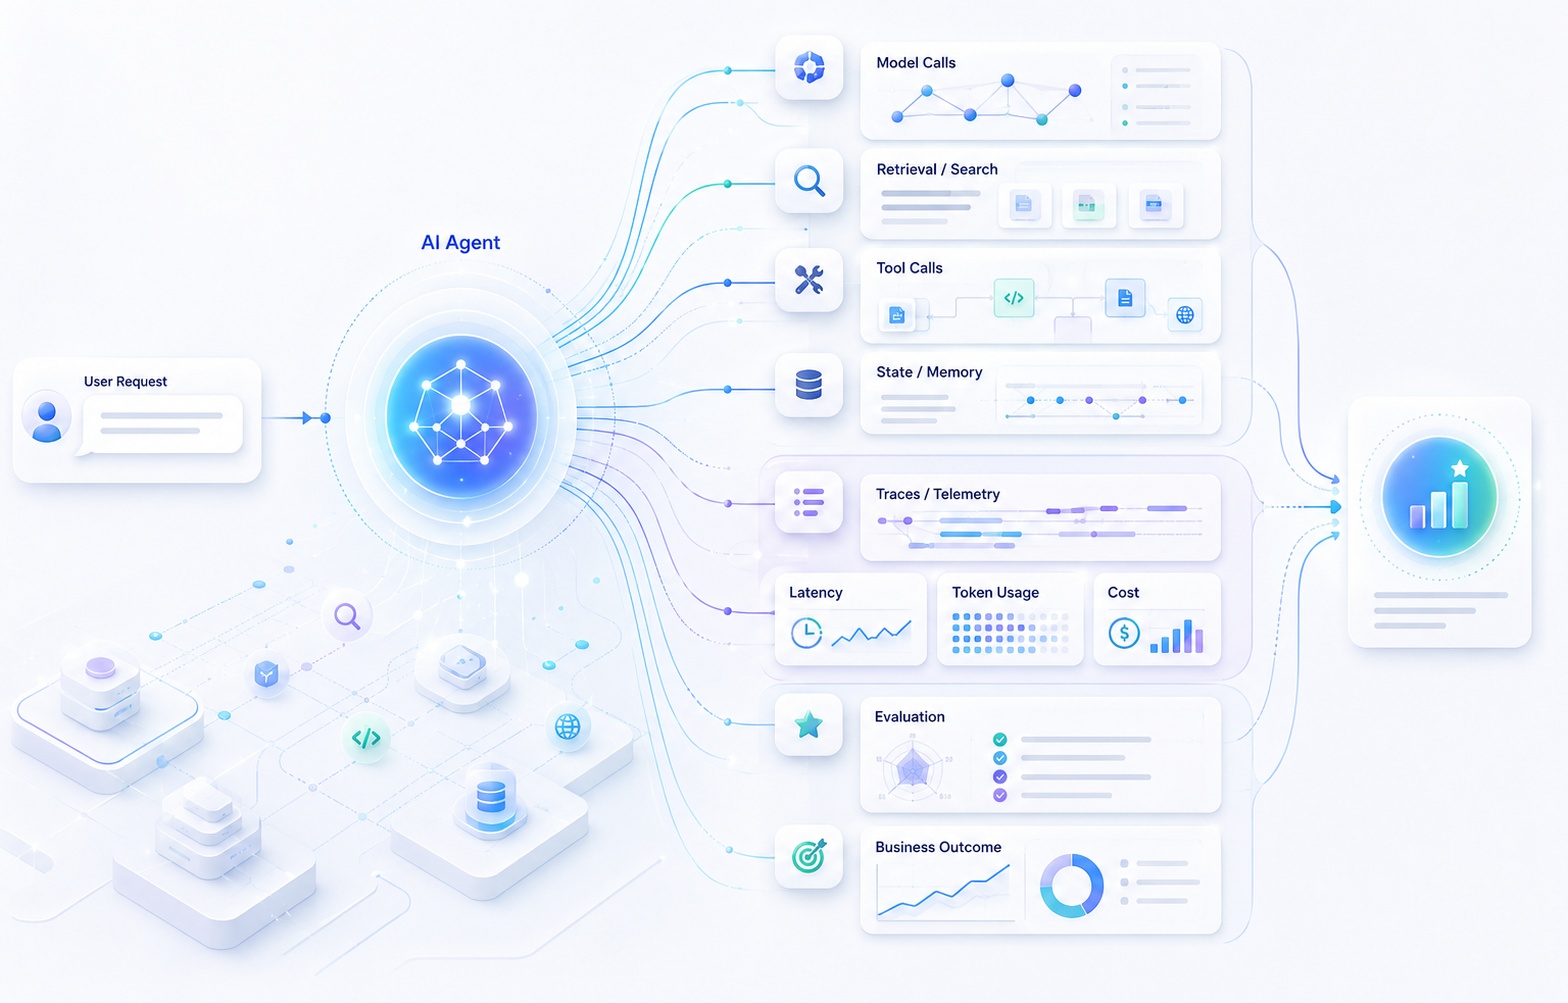
At 09:14 on a Tuesday, an account manager at a customer company opens the support widget inside a B2B SaaS product and types a single sentence: "We were charged twice for the June invoice — can you fix it?"
Eleven seconds later she has an answer. It is polite, specific, and correct-sounding. It confirms that a duplicate charge was found, states that a refund of $3,180 has been issued, tells her the credit should appear on the card statement within three to five business days, and gives her the support case number. She says thank you and closes the widget. Support case SR-48812 is marked resolved. Customer satisfaction survey: five stars.
On the vendor's side, nothing is on fire. The API gateway recorded HTTP 200. The agent service reported no unhandled exceptions. Pod CPU sat at 34%, memory well below limits, no restarts. The billing API's error rate for the hour was 0.02%, entirely from an unrelated batch job. p95 latency for the assistant endpoint was 12.4 seconds, which is inside the SLO. The on-call engineer's dashboard is a wall of green rectangles and gently sloping lines. There is no incident. There is no alert. There is not even a warning.
Nineteen days later, during month-end reconciliation, a finance analyst notices that the customer's account received two refunds of $3,180 each, seven seconds apart, both against the same duplicate charge. One of them was correct. The other was not. Neither had been approved by a human, which the company's own refund policy — updated eleven days before the incident — required for any credit above $2,500 on an annual contract.
Nothing crashed. Nothing errored. Nothing was slow. Every layer of conventional monitoring reported that the system was working, and by its own definition of working, it was right.
This scenario is fictional and composite. It is assembled from failure patterns that are entirely ordinary in agentic systems — stale retrieval context, retry semantics that are not idempotent, a policy gate the workflow declined to enter, a final summary that described intent rather than outcome — and it is deliberately unremarkable. That is the point. The interesting production failures in AI systems do not look like production failures. They look like successful requests.
The uncomfortable question underneath is not "did the agent work?" It is "what does working mean for a piece of software whose control flow is decided at runtime by a model?" For a REST endpoint, "working" has a reasonably tight definition: it accepted a valid request, executed a known code path, returned an expected shape, did not throw, and finished within budget. For an agent, every one of those clauses gets slippery. The code path is not known in advance. The expected shape of the work is not fully specified. The absence of a thrown exception is nearly meaningless, because the agent's job includes recovering from errors — and a system that recovers from errors is a system that can hide them.
Traditional observability was designed to answer questions about a machine. Agent observability has to answer questions about a decision.
The Layer Your Dashboards Were Never Asked to Cover
Start with what the existing stack does tell you, because a surprising amount of AI-adjacent writing implies that conventional monitoring has become obsolete. It has not. Infrastructure metrics, application logs, distributed traces, database monitoring, API health checks, queue depth, and error budgets remain load-bearing. When an agent system fails hard — the model gateway is unreachable, the vector database is out of connections, a Kubernetes node is evicting pods, a downstream billing API is returning 503s — conventional telemetry finds it faster than anything else and should stay exactly where it is.
The problem is one of scope, not correctness. Conventional telemetry answers a set of questions that are all about the machinery of execution:
- Did the process crash, restart, or run out of memory?
- Did a dependency return an error status?
- How long did the HTTP request take, at p50, p95, p99?
- Is the database slow? Is the queue backing up? Is the disk filling?
- How many requests per second are we serving, and how many failed?
Agent systems introduce a second set of questions that sit at a different level of abstraction entirely. They are about behavior — about what the software decided to do, and why, and whether that was the right thing:
- What did the agent understand the task to be?
- What context was in front of the model when it made each decision?
- Which model answered, at which version, under which prompt template?
- Which tools did it choose, in what order, with what arguments, against which records?
- Which steps failed and were quietly retried? What did the retry actually do?
- What state changed in the world as a result — and does that match what the agent told the user it had done?
- How many operations and how many tokens did this path consume compared with the normal path for this task?
- Was the sequence of actions safe, even if the final answer was correct?
- If this behavior drifts by 5% next month, will anyone notice?
None of those are answerable from CPU graphs and status codes, and none of them replace CPU graphs and status codes. This is an additional layer — a behavioral and semantic layer that sits above the operational one and correlates with it. A team that has one but not the other is flying with half an instrument panel. A team that has the operational layer only is in the more dangerous position, because their instruments are all reading normal.
The rest of this piece works inward from that green dashboard: from the system boundary, to a single trace, to the tools and the state and the retrieval underneath it, out to the aggregate behavior of millions of interactions, and finally back to the Tuesday-morning refund — which, by the end, will be fully explained.
What a Green Dashboard Is Actually Asserting
It is worth being precise about the claim a healthy dashboard makes, because the claim is narrower than it feels.
An HTTP 200 on the assistant endpoint asserts that the application accepted a request, ran to completion without an unhandled exception, and serialized a response. That is all. It says nothing about whether the response was true, whether the requested business action occurred, whether the right customer record was touched, or whether the path taken to produce the answer was one the organization would endorse if it could see it.
Latency percentiles have a similar problem in agentic systems, and it is worse than it looks. A single p95 number for "the assistant endpoint" is an aggregate over paths that are not comparable to each other. A simple informational question that resolves in one model call and a refund workflow that touches four systems and a policy gate are the same measurement in that histogram. When p95 moves, you cannot tell whether more users are asking hard questions, whether one tool got slower, whether a retry path became more common, or whether the model started producing longer outputs. The number moved; the reason is invisible.
Error rate is the signal that degrades most severely. In a deterministic service, an unhandled exception is a strong indicator that something went wrong. In an agent, an exception is one of several expected outcomes that the orchestration layer is specifically designed to absorb. Tool timeouts get retried. Structured-output parse failures get re-prompted. A rate-limited primary model triggers a fallback to a secondary. Each of those is a legitimate recovery, and each of them is also the place where a correct-looking answer can diverge from a correct outcome. If your error rate counts only the failures that escaped the recovery machinery, it is measuring the machinery, not the behavior.
Then there is the class of problem where the executed request is flawless and the outcome is still wrong: the agent queried the parent organization instead of the subsidiary that actually holds the contract; it retrieved a policy document that was accurate last quarter; it answered the question the user asked instead of the question the user needed answered; it reported an action as complete when only the first half of the action was performed. Nothing in the operational layer has an opinion about any of that, because nothing in the operational layer knows what the task was.
Executives sometimes read this as an engineering-hygiene problem. It is closer to a control problem. An organization that has deployed autonomous software into a revenue-touching workflow and cannot reconstruct what that software did has, in a real sense, taken on an unbounded and unmeasured liability. The refund in the opening scenario is small. The mechanism that produced it is not size-limited.
Naming It, Now That the Problem Is Concrete
With the failure mode established, the definition can be sharper than the usual one.
AI agent observability is the ability to reconstruct, inspect, measure, correlate, and evaluate an agent's behavior across the full lifecycle of a task — from the moment a request enters the system, through every model call, retrieval, tool execution, state transition, delegation, and retry, to the business outcome the task was supposed to produce, and across the aggregate behavior of many such tasks over time.
Five verbs, and each is doing work.
Reconstruct means the execution can be replayed as a causal structure, not merely read as a stream of events. Inspect means the significant decision points are individually examinable. Measure means the behavior is quantified — steps, tokens, latency, cost, depth, retry count — so that "normal" is a number rather than an intuition. Correlate means a technical trace can be joined to a prompt version, an agent release, a retrieval index generation, a support case, a billing transaction, and an evaluation score. Evaluate means the system carries judgments about quality, not just records of activity.
It requires more than logging the prompt and the response. Concretely, the telemetry surface includes:
- Logs — discrete events with structure: a tool invocation, a permission denial, a fallback trigger, a state transition.
- Metrics — aggregates that make "normal" measurable: tool calls per task, tokens per task, retry depth, escalation rate.
- Traces — the causal skeleton of one execution, with parent/child relationships that show what caused what.
- Events — notable occurrences that are not spans: a budget exhausted, a guardrail fired, a human took over.
- Agent state — which workflow state the agent entered and left, what it carried forward, what it checkpointed.
- Tool activity — selection, arguments, authorization context, results, side effects, idempotency behavior.
- Model activity — provider, model, version, routing decision, token counts, finish reason, structured-output success.
- Retrieval activity — query, index, filters, document identities and versions, relevance, emptiness.
- Evaluation data — automated and human judgments attached to specific executions.
- Business outcome data — did the ticket reopen, did the refund post, did a human have to redo the work.
Six words in this space get used interchangeably and should not be. Keeping them apart is not pedantry; teams that blur them consistently build the wrong thing.
| Discipline | The question it answers | Typical artifact | What it cannot do |
|---|---|---|---|
| Monitoring | Is a known signal outside its expected range right now? | Alert on tool error rate, latency SLO burn | Cannot describe a failure it has no metric for |
| Observability | What actually happened inside this specific execution? | Trace with spans, attributes, correlated IDs | Cannot tell you whether what happened was good |
| Tracing | What caused what, in what order, across which boundaries? | Parent/child span tree with propagated context | Is a technique, not a verdict |
| Evaluation | Was the behavior or output correct, safe, and useful? | Score, label, rationale attached to a run | Cannot see executions you never captured |
| Testing | What happens under conditions we deliberately create? | Scenario suites, fault injection, regression sets | Cannot enumerate what production will actually do |
| Analytics | How do users and the product behave at aggregate scale? | Funnels, cohorts, resolution rates | Cannot explain a single anomalous execution |
They are complements with a natural circulation between them. Monitoring notices; observability explains; evaluation judges; testing pre-empts; analytics contextualizes. A mature program runs all five and moves evidence between them deliberately. Most programs today run monitoring and some tracing, and hope.
Why Agents Break the Assumptions Monitoring Was Built On
The instinctive framing — "AI is non-deterministic, therefore hard to monitor" — is true but shallow, and it leads teams to the wrong remedies. The more useful framing is that agent systems are hybrid systems in which a probabilistic component has been inserted into the control flow.
A production agent is not a model. It is an assembly of deterministic application code, model inference, retrieval infrastructure, orchestration logic, external services and SaaS APIs, policy and guardrail layers, business rules, persistent state, and — often — human approval steps. Most of that assembly is ordinary software that fails in ordinary ways. Null pointers, connection pool exhaustion, schema drift, timezone bugs, and misconfigured IAM roles are all alive and well inside agent stacks, and conventional engineering practice handles them.
What changes is that a probabilistic component now sits at the branch points. Across a single task, the model may influence:
- what the task actually is, given an ambiguous request;
- how to decompose it into steps;
- which tool to call at each step;
- what arguments to construct, including which identifiers to pass;
- whether the result of a tool call is satisfactory or should be tried differently;
- whether more information is needed before acting;
- when the task is finished;
- whether to escalate to a human or proceed;
- how to describe what happened to the user.
Every one of those is a control-flow decision that, in a conventional system, would live in code that a reviewer could read and a test could cover exhaustively. Now they live in a distribution over outputs conditioned on a context window whose contents change between invocations.
Non-determinism deserves a precise treatment, because "set temperature to zero" is a common and insufficient answer. Even with greedy decoding and a pinned model version, the inputs to each decision vary between two nominally identical requests. Retrieved documents change as the index is updated. Tool outputs reflect the live state of billing systems and CRMs. Conversation memory carries forward whatever happened earlier. Timestamps, feature flags, tenant configuration, rate-limit conditions that trigger fallback routing, and provider-side model updates all shift underneath. The composition of the context is itself a moving target, and the model is a function of that composition.
The consequence for engineering practice is direct: production behavior must be measured, not inferred. You cannot reason from the code to the behavior with the confidence you're used to, because the code no longer fully determines the behavior. You cannot certify the system from a pre-production test run alone, because the test run cannot enumerate the input space. What you can do is instrument the system so that the behavior it actually exhibits is visible, quantified, and comparable over time — which is a different engineering posture from the one most teams bring to a service launch.
There is a second-order effect worth naming. Because the model absorbs errors gracefully, agent systems have an unusually high capacity to look fine while degrading. A deterministic service with a broken dependency falls over and tells you. An agent with a broken dependency writes a slightly worse answer, calls a different tool, retries twice, and returns 200. The failure signature is a quality gradient, not a step function. Systems that fail gradually require monitoring that measures gradients.
One Answer, Twenty-Three Operations
Return to the Tuesday refund and open it up. What the user experienced as a single question-and-answer exchange was, internally, a distributed workflow. The following trace is illustrative — a composite constructed to be representative rather than a capture from any real system — but the shape is entirely ordinary for a mid-complexity account operations agent.
TRACE  support_request  (trace_id 7f3a…c19, 11.9 s)
│
├─ http.server POST /v1/assistant/turn                       [11.9 s]
│  └─ invoke_agent  account_ops_agent  v4.2.1                [11.8 s]
│     │
│     ├─ context.assemble                                    [0.09 s]
│     │     system instructions v17 · tenant config ·
│     │     6 turns of history · 9 tool definitions
│     │
│     ├─ chat  model-A  (intent + plan)                      [1.42 s]
│     │     in 3,180 tok · out 214 tok · finish: tool_calls
│     │
│     ├─ execute_tool  crm.resolve_organization              [0.31 s]
│     │     args: {domain: "…"} → org_id resolved, 1 match
│     │
│     ├─ execute_tool  billing.lookup_account                [0.44 s]
│     │     → plan: annual · currency: USD · status: active
│     │
│     ├─ execute_tool  billing.list_transactions             [0.67 s]
│     │     args: {window: "30d"} → 14 rows, 2 identical
│     │
│     ├─ retrieval  policy_index  (alias: policy_live)       [0.71 s]
│     │     query: "duplicate charge refund approval limit"
│     │     top_k 5 → doc REF-POL v3.1 (score 0.88, rank 1)
│     │                doc REF-POL v4.0 (score 0.81, rank 3)
│     │
│     ├─ chat  model-A  (decide action)                      [1.88 s]
│     │     in 7,940 tok · out 302 tok · finish: tool_calls
│     │     → plan: issue refund directly, no approval needed
│     │
│     ├─ execute_tool  billing.issue_refund   ⟵ attempt 1    [4.20 s]
│     │     args: {amount: 3180.00, txn: …, key: rf-1718…}
│     │     status: ERROR (gateway timeout, 504)
│     │
│     ├─ [retry policy: backoff 2.0 s]                       [2.00 s]
│     │
│     ├─ execute_tool  billing.issue_refund   ⟵ attempt 2    [0.51 s]
│     │     args: {amount: 3180.00, txn: …, key: rf-1718…}
│     │     status: OK · refund_id r_88213
│     │
│     ├─ execute_tool  ticketing.update_case  SR-48812       [0.38 s]
│     │     → status: resolved
│     │
│     └─ chat  model-A  (compose reply)                      [1.31 s]
│           in 9,610 tok · out 188 tok · finish: stop
│
└─ response 200
Twenty-three discrete operations if you count the sub-steps inside context assembly; a dozen if you count only the spans above. The user saw one exchange, and the operational dashboard saw one HTTP request with a green status.
Several things in that trace are already suspicious to a trained eye, and every one of them is invisible without span-level instrumentation. The retrieval returned two versions of the same policy document and ranked the older one first. The first refund attempt failed with a gateway timeout after 4.2 seconds — long enough that the downstream may well have committed the write before the gateway gave up. The retry used an idempotency key that looks time-derived rather than deterministic. And the workflow never entered an approval state, despite the amount.
The trace is only useful because of correlation. A tool call recorded in isolation — "billing.issue_refund succeeded at 09:14:07" — is nearly worthless for investigation. The same event embedded in a trace, carrying the identity of the agent and its version, the workflow, the session, the model invocation that requested it, the prompt template in force, the release that deployed it, and the business case it belongs to, is a complete piece of evidence.
That correlation is what turns telemetry into an explanation. A practical span for a state-changing tool call in this system might carry something like the following — presented as illustrative structure, not as a schema to copy:
span: execute_tool billing.issue_refund
  trace_id            7f3a…c19
  parent_span_id      <chat model-A (decide action)>
  start / duration    09:14:05.118Z / 4.203 s
  status              ERROR   error.type = 504
  attempt             1 of 2
  agent.name/version  account_ops_agent / 4.2.1
  workflow.version    refund_v9
  prompt.template     acct_ops_system / v17
  tool.name/version   billing.issue_refund / 2.3.0
  tool.arg_digest     sha256:… (arguments hashed, not stored)
  tool.target_ref     acct:*****4471 · txn:*****9902
  tool.idempotency    rf-1718… (source: request_timestamp)
  authz.principal     svc-agent-acctops
  authz.decision      allow (scope: refund:write ≤ $5,000)
  policy.gate         approval_required = false  (source: REF-POL v3.1)
  session.ref         sess_9d2… (pseudonymous)
  case.ref            SR-48812
  cost.estimate_usd   (attributed at parent)
Note what is present and what is not. The identifiers are there; the raw arguments are not, only a digest and masked references. The authorization decision and the policy source that drove it are recorded as first-class fields, because those are the fields that explain the behavior. The idempotency key's derivation source is recorded, which is what will eventually indict the retry. This is telemetry designed by someone who has had to answer a question at 2 a.m., not telemetry designed to satisfy a checkbox.
Everything the Model Call Won't Tell You If You Only Log the Prompt
"We log prompts and responses" is where most teams start and where too many stop. It is a reasonable first move and a poor final position, for two reasons: it captures the least structured, most sensitive, highest-volume part of the interaction while omitting most of what explains behavior.
Start with what a model span should carry as metadata, independent of content:
- Provider and model identity, including the resolved model rather than the requested alias.
gpt-4o-latest,claude-sonnet, and internal routing aliases all resolve to something specific, and behavior changes when the resolution changes. - Routing decisions. Many production stacks route between models by cost, latency, task class, or availability. Which arm was taken, and why, is a first-class behavioral fact.
- Token accounting — input, output, and, where the provider exposes it, cached-read and cache-creation input tokens. Prompt caching materially changes both cost and latency, and a cache hit-rate collapse is a real incident that shows up nowhere else.
- Latency, decomposed — total operation duration, and for streaming interactions, time to first token separately from total generation time. These move independently and for different reasons.
- Finish reason. A completion that stopped because it hit the max-token limit is a different event from one that stopped naturally or one that stopped to request tool calls. Length-truncated completions are a classic source of silently malformed downstream behavior.
- Errors, rate limits, retries, and fallback — including the identity of the fallback model when one was used. Fallback usage is one of the highest-value behavioral signals in the entire stack, because fallback usually means degraded quality with no error.
- Structured-output outcomes. If the application requires JSON conforming to a schema, whether the model produced valid output on the first attempt, and how many re-prompts were needed, is a quality signal about the prompt, the schema, and the model, all at once.
- Context-window pressure. How full was the context, and did anything get truncated to fit? Truncation is where memory silently disappears.
Then there is versioning, which is where agent systems differ most sharply from conventional deployments. In a normal service, behavior changes when a binary is deployed, and the deployment is a discrete, observable, revertible event. In an agent system, behavior changes when a prompt template is edited, a tool description is reworded, a retrieval index is rebuilt, a policy document is updated, a model provider ships a silent update, or a routing threshold is tuned — none of which necessarily involves a code deploy at all.
If the telemetry does not carry the prompt template version, the agent version, the workflow version, the tool schema version, and the retrieval index generation, then any question of the form "did this start after the change?" is unanswerable. And "did this start after the change?" is the single most useful question in production debugging. Treat these versions as required span attributes, not as nice-to-haves.
Context assembly is the part nobody instruments
By the time a model is called inside an agent, the user's message is often a small minority of the input. The effective prompt typically includes system instructions, tool definitions and their descriptions, the conversation history (possibly summarized), retrieved documents, long-term memory entries, tenant and account metadata, policy fragments, and prior tool results. In the illustrative trace above, the second model call carried roughly 7,900 input tokens against a user message of about fifteen words.
The model's decision is a function of all of it. So "we logged the user prompt" tells you almost nothing about why the model decided what it decided. What you want to know is which components were assembled into the context, in what versions, at what sizes — the retrieval hits by document ID and version, the memory entries by key, the history window depth, the system template version, the tool set exposed. That is a structured, low-sensitivity description of the input that supports investigation without hoarding text.
The privacy problem, stated plainly
Prompts, tool arguments, retrieved documents, and model outputs in an enterprise agent contain customer records, account identifiers, financial detail, internal policy, and frequently the internal instructions the company considers proprietary. An observability pipeline that captures all of it by default has effectively created a second, less governed copy of the production database, indexed for full-text search, retained for ninety days, and readable by anyone with a dashboard login.
The current OpenTelemetry generative AI conventions handle this distinction explicitly, and the design is worth copying regardless of whether you use OpenTelemetry. Structural metadata — operation names, model identity, token counts, durations, finish reasons — is recorded by default. Message content is a separate category: attributes such as gen_ai.input.messages, gen_ai.output.messages, and gen_ai.system_instructions are marked opt-in, and the specification attaches explicit warnings that they are likely to contain sensitive information including user and PII data. Content capture is a decision you make, per environment, with consent and retention in mind — not a default you inherit.
The practical pattern that follows:
- Metadata everywhere, content selectively. Always capture the structure; capture the text only where you have decided you need it and are permitted to hold it.
- Reference, don't duplicate. Record document IDs and versions rather than document bodies; record argument digests and masked identifiers rather than full argument payloads.
- Redact at the collector, not the consumer. Filtering that happens inside your own pipeline before export is a control; filtering applied by a vendor after ingestion is a promise.
- Separate retention tiers. Structural telemetry can live for months. Captured content should live for days, in a store with its own access boundary and its own audit log.
- Respect tenant boundaries in the telemetry store, not just in the application. Cross-tenant leakage through a debugging UI is still cross-tenant leakage.
- Sample content, not structure. You need every trace's shape; you need a small, deliberately chosen fraction of traces' text.
A necessary distinction: execution decisions versus internal reasoning
There is a temptation, when arguing for deeper visibility, to reach for "we need to see the model's reasoning." That claim needs care.
Modern models may produce internal reasoning tokens that providers treat as private, that are not intended as a faithful account of the computation, and that may be unavailable, partial, or summarized. Building an observability program around capturing and interpreting hidden chain-of-thought is a bad foundation: it is unreliable as evidence, ethically fraught as a matter of user and provider expectation, and technically fragile because provider behavior changes.
What you can and should observe is the set of things the system actually does and the artifacts it deliberately emits:
- the tool calls it requests, with arguments;
- the state transitions it enters and exits;
- plans, task decompositions, or intermediate structured outputs that your application explicitly asks for and persists as part of its own contract;
- the retrieval it performed and the documents it received;
- the results, errors, and retries;
- the external actions taken and their effects;
- the final output and the judgments made about it.
That set is sufficient to reconstruct behavior. An agent that issued a refund under an obsolete policy is fully explained by the retrieval hit, the policy gate decision, and the tool call. You do not need to see the model's inner monologue to establish that; you need to see what it was given and what it did. Instrument the observable interface of the decision, not the model's private interior.
Execution Success Is Not Task Success
If there is one idea in agent observability worth internalizing above the others, it is this one, and it is best stated as a flat assertion: a tool call returning HTTP 200 tells you the API accepted the request. It tells you nothing about whether the request should have been made.
Unpack what a successful tool call does not establish:
- That the right tool was selected. The agent may have chosen
billing.issue_refundwhen the correct action wasbilling.apply_credit, orcrm.update_casewhen the case should have been escalated. Both succeed. - That the arguments represented the user's intent. A refund of $3,180 executes identically whether the user asked for a refund of the duplicate charge or a credit against next month's invoice.
- That the correct entity was targeted. Organizations have parents, subsidiaries, and sandbox accounts with similar names. Resolving to the wrong one produces a perfectly successful write to the wrong record.
- That the action complied with policy. The API enforces its own constraints — schema, authorization scope, amount ceilings. It does not enforce your business rules about approval thresholds unless someone built that in.
- That the action was necessary. Redundant, duplicate, and gratuitous tool calls all return 200.
- That the action solved the user's problem. The single most common form of this failure is an agent that performs a related action, then reports success against the requested one.
Execution success is a property of the call. Task success is a property of the outcome. Conflating them is the most expensive category error in agent operations, because it means the metric you are watching — tool error rate — is structurally incapable of detecting the failure mode you most need to catch.
What to capture per tool call
For every tool invocation, the following is a reasonable baseline. The intensity should scale with the tool's blast radius, discussed next.
| Dimension | Why it matters |
|---|---|
| Tool name and schema version | Tool definitions change; behavior changes with them |
| Arguments (or a safe representation) | The only way to answer "what did it actually ask for" |
| Target entity references (masked) | Distinguishes right-action-wrong-record failures |
| Authorization principal and decision | Establishes what the agent was permitted to do |
| Policy gate outcome and its source | Explains why the agent believed it could act |
| Duration and status | Ordinary reliability signal |
| Error class on failure | Timeouts and validation errors need different responses |
| Attempt number and retry lineage | Duplicate side effects live here |
| Idempotency key and its derivation | The difference between safe and unsafe retry |
| Result shape and size | Empty results, truncated results, unexpected types |
| Rate-limit and backoff behavior | Explains latency and cascading slowness |
| Declared side effects | Whether this call changed the world |
The last item is the one teams most often skip and most often need. A tool registry that records, for each tool, whether it is read-only, state-changing, or high-impact — and whether its effects are reversible — turns a flat list of calls into a risk-weighted picture of what the agent has been doing.
Blast radius should determine instrumentation intensity
Not all tool calls deserve the same scrutiny. A useful discipline is to tier them explicitly and let the tier drive both what you capture and how long you keep it.
| Tier | Examples | Failure consequence | Observability posture |
|---|---|---|---|
| Read-only, low sensitivity | Knowledge base search, internal doc lookup, FAQ retrieval | Wrong or missing information in an answer | Metadata + sampled content; aggregate relevance metrics |
| Read-only, sensitive | Customer record lookup, transaction history, contract terms | Exposure of data the requester shouldn't see | Full metadata, masked identifiers, authorization decision always recorded, access-audited |
| State-changing, reversible | Update CRM case, set ticket status, add note, send internal message | Wrong record modified; noisy but recoverable | Full metadata + before/after references; retained through the reconciliation window |
| State-changing, externally visible | Send customer email, post to shared channel, update customer-visible status | Reputational and trust cost; cannot be unsent | Full metadata + captured content + approval provenance |
| Financial or entitlement-changing | Issue refund, apply credit, change plan, adjust quota | Direct revenue impact; audit and compliance exposure | Full audit event, immutable, with policy source, authorization decision, idempotency evidence, and human-approval linkage |
| Destructive or irreversible | Delete account, purge data, revoke access, terminate contract | Catastrophic, often unrecoverable | Everything above, plus mandatory pre-action approval trail and post-action verification |
The point of the tiering is not bureaucracy. It is that instrumentation cost is real, and you should be spending it where the consequences are. A team that logs its knowledge base searches in exhaustive detail and its refund calls in summary has its budget exactly inverted.
The reconciliation gap
There is a subtler tool-layer problem that deserves separate naming: the gap between what the agent believes happened and what actually happened.
The agent's model of the world is constructed from tool responses. If a tool returns a success payload but the effect is asynchronous and later fails — a queued email that bounces, a refund that posts and is subsequently reversed by the payment processor, a CRM update overwritten by a sync job — the agent's belief and reality diverge, and the agent has already told the user something based on the belief.
This is why business-outcome correlation, discussed later, is not an optional analytics nicety. The only way to close the gap is to compare the agent's asserted outcome against the system of record's eventual state. In the opening scenario, the agent's reply said a refund had been issued. Two refunds had been issued. The agent's belief was not false; it was incomplete, and nothing in the trace-level telemetry alone would flag it. Only a reconciliation between the trace and the billing ledger closes that loop.
When the Tool Lives Three Network Hops Away
Tool ecosystems have become more dynamic. The Model Context Protocol and similar remote tool interfaces mean the set of capabilities available to an agent is increasingly assembled at runtime from servers the agent team may not own, may not have written, and may not be able to redeploy.
The path lengthens accordingly: agent → MCP client → MCP server → downstream API → the actual system of record. Each arrow is a boundary where latency accumulates, errors originate, context is lost, and authorization is re-evaluated. A tool that "got slow" may be slow in the MCP server's own logic, in the downstream SaaS API it wraps, or in the network between them — and from the agent's perspective all three look identical.
This makes trace-context propagation the difference between a five-minute investigation and a multi-team argument. When W3C trace context is propagated through the protocol boundary, the server-side span nests under the client-side span and the trace stays whole; when it isn't, you have two disconnected halves of one story and no reliable way to join them. Getting propagation right at the MCP boundary is unglamorous plumbing with a very high return.
OpenTelemetry has been working on this specifically. Model Context Protocol attributes — including mcp.method.name for the request or notification method, mcp.protocol.version, and mcp.resource.uri — have moved into the OpenTelemetry GenAI semantic conventions repository. Because MCP runs over JSON-RPC, the specification recommends MCP-specific conventions rather than generic RPC conventions, since MCP spans carry session and tool-call context that generic RPC attributes would lose. Observability platforms and MCP server frameworks have begun emitting these attributes natively.
Three operational consequences follow. First, tool inventory becomes a moving target: if the set of available tools can change without a deploy of your application, then "which tools were exposed to the model on this invocation" is a fact you must record, not a constant you can look up. Second, tool descriptions are effectively prompt content — a reworded description on a remote server changes which tool the model picks, with no change on your side. Third, remote tool servers are a supply-chain surface; the authorization context under which the agent's calls execute at the far end deserves the same audit treatment as any other privileged integration.
The Model Was Fine. The Context Was Wrong.
A large share of "the AI hallucinated" incidents are not model failures at all. They are context failures, and the model behaved reasonably given what it was handed.
Retrieval is where this concentrates. In the opening scenario, the agent retrieved the refund policy, ranked five candidates, and used the top hit. The top hit was version 3.1 of the policy document. Version 4.0 — published eleven days earlier, raising the approval-free ceiling question and requiring human sign-off above $2,500 on annual contracts — was present in the index but ranked third, and the prompt only carried the top result into the decision.
Every downstream signal looked healthy. The model call had normal token counts and a clean finish reason. The tool calls succeeded. The final answer was fluent and consistent with the policy the agent had read. Model-level monitoring would have shown nothing, because there was nothing wrong at the model level.
Retrieval telemetry that would have made this visible:
- The query itself, including any rewriting the system performed. Query rewriting is a common silent failure point.
- Retriever identity and version, index identity and generation. Which index, built when, from what source snapshot. When an alias points at a stale index, this is the field that says so.
- Filters applied — tenant, date range, document type, permission scope. A filter that silently excludes the right documents is indistinguishable from an empty corpus.
- Documents returned, by stable ID and version, with rank and score. Not the document text; the identity.
- Freshness: the age of the returned documents relative to their source, and whether a newer version of the same logical document exists.
- Empty and near-empty retrieval rates. A rising rate of zero-hit retrievals is one of the earliest and clearest degradation signals available, and it is trivially cheap to measure.
- Conflict detection: multiple versions of the same logical document in one result set, or documents whose content contradicts. This is exactly the signature in the illustrative trace, and it is detectable mechanically.
- Fallback behavior: what the system did when retrieval returned nothing useful. Falling back to parametric model knowledge silently is a design decision that should be visible in telemetry every time it happens.
The reason this section exists as its own layer is that retrieval failures cross component boundaries in a way that defeats siloed monitoring. The search team's dashboard shows normal query latency and normal result counts. The model team's dashboard shows normal token usage and normal completion rates. The platform team's dashboard shows normal error rates. The failure lives in the relationship between an index build job, a document lifecycle, a ranking function, and a prompt that only carries the top hit. Nobody owns the relationship, so nobody sees it — unless the trace spans all of it.
For teams running RAG at scale, two aggregate metrics are worth building early: the rate at which retrieved context contains multiple versions of the same logical document, and the distribution of document age in successful task completions. Both are cheap, both are leading indicators, and neither requires an evaluation harness.
State Is Where Agents Keep Their Mistakes
Single-turn systems have almost no state. Agents have a lot, in several distinct forms that fail differently:
Conversation state — the running history of the exchange, often summarized once it exceeds a threshold. Summarization is lossy compression applied by a model to its own context, and it is a rich source of quiet corruption: a detail that mattered is dropped, an inference is recorded as a fact, an account identifier mentioned early is replaced by a pronoun.
Workflow state — where the agent is in a multi-step process. This is the most valuable state to instrument and the most commonly left implicit.
Long-term memory — persisted facts about a user, account, or prior interaction, retrieved into later sessions. Memory that was correct when written can be stale when read, and stale memory is worse than absent memory because the agent treats it as established.
Intermediate results and checkpoints — the tool outputs and derived values carried forward within a task, and the persisted points a workflow can resume from.
Cross-agent handoff payloads — the state one agent passes to another, which is discussed below.
The workflow-state case deserves a concrete treatment. Suppose the refund workflow is modeled explicitly:
IDENTIFY_ACCOUNT → VERIFY_TRANSACTION → CHECK_POLICY
        → REQUEST_APPROVAL → ISSUE_REFUND → CONFIRM → CLOSE
An agent that goes IDENTIFY_ACCOUNT → VERIFY_TRANSACTION → CHECK_POLICY → ISSUE_REFUND → CONFIRM → CLOSE has completed the workflow. Technically. Every step it executed succeeded. The task finished. The user was satisfied. And a required control was skipped.
If workflow state transitions are emitted as telemetry — with the state entered, the state exited, the reason for the transition, and the input that drove it — then this deviation is not merely visible, it is queryable. "Show me all refund workflows in the last thirty days that reached ISSUE_REFUND without passing through REQUEST_APPROVAL" is a one-line question against properly instrumented state, and an archaeological expedition without it.
This is the strongest argument for making state machines explicit in agent design even when a model decides the transitions. The model can choose the next state; the runtime can record the choice, validate it against the permitted transition graph, and reject illegal moves. You get three things at once: a control point, an observability primitive, and a testable contract. Systems where the "state" is an unstructured blob of accumulated context in a prompt offer none of the three.
Two further state signals are worth capturing routinely. First, state age and provenance: when a decision is made using a value, where did that value come from and how old is it? Second, context truncation events: when history is compressed or dropped to fit a window, that is a state mutation and should be recorded as one. A surprising number of "the agent forgot what I told it" complaints resolve to a truncation event nobody logged.
When Agents Delegate, Accountability Fragments
Multi-agent architectures multiply every problem in this article, and add one of their own.
Consider an orchestrator that routes the refund request to a billing specialist agent, which consults a policy agent for the approval determination, and finally hands off to a customer communication agent to compose the reply. Four agents, potentially four different models, four sets of tools, four context windows, and three handoffs. The user still sees one exchange.
The distinctive problem is that the decision, the action, the cost, and the output can each belong to a different component. When the outcome is wrong, "which agent is responsible" is not rhetorical — it determines which team fixes it, which prompt is revised, which evaluation set gains a case.
Telemetry that makes multi-agent systems tractable:
- Parent and child agent identity and version on every span, so the topology of an execution is reconstructible rather than inferred.
- Handoff events as first-class records: which agent handed off, to whom, why, and with what payload. The handoff payload is the interface contract between agents, and interfaces need contract testing.
- Cost and token attribution per agent, not just per task. Without it, a runaway sub-agent is invisible inside an aggregate number.
- Delegation depth and breadth, with limits. Circular delegation — agent A escalates to B, B decides this is A's domain and hands back — is a real and expensive failure mode that produces no errors.
- Duplicate work detection. Two sub-agents independently querying the same account and independently deciding to act is how you get two refunds by a different route than the one in our scenario.
- Conflicting conclusions. When the policy agent says approval is required and the billing agent proceeds anyway, that disagreement is the most diagnostically valuable event in the entire trace, and in most systems it is recorded nowhere.
The questions a team should be able to answer from telemetry alone: Which agent made the decision? Which one executed the action? Which one generated the text the customer read? Which one consumed the tokens? Where did the incorrect assumption enter the chain, and did it enter as a retrieval, a tool result, a handoff payload, or a model inference?
A practical note: resist the urge to model every function call as an agent. Topology complexity is not free, and each additional autonomous hop is another place where an assumption can be introduced without being recorded. Multi-agent designs earn their keep when the sub-tasks are genuinely separable and independently improvable. Where they are not, an orchestrated pipeline with one model and explicit steps is easier to observe, cheaper to run, and easier to reason about when it misbehaves.
Latency Stopped Being a Single Number
The 11.9-second response in the opening scenario decomposes, using the illustrative trace above, roughly like this:
| Component | Duration | Share |
|---|---|---|
| Context assembly | 0.09 s | 1% |
| Model call 1 (intent + plan) | 1.42 s | 12% |
| Tool: resolve organization | 0.31 s | 3% |
| Tool: lookup account | 0.44 s | 4% |
| Tool: list transactions | 0.67 s | 6% |
| Retrieval: policy index | 0.71 s | 6% |
| Model call 2 (decide action) | 1.88 s | 16% |
| Tool: issue refund (failed attempt) | 4.20 s | 35% |
| Retry backoff | 2.00 s | 17% |
| Tool: issue refund (successful) | 0.51 s | 4% |
| Tool: update case | 0.38 s | 3% |
| Model call 3 (compose reply) | 1.31 s | 11% |
More than half the wall-clock time was spent on a failed call and the wait before retrying it. A single endpoint-level p95 metric records "11.9 seconds, within SLO" and discards every bit of that. Worse, if the timeout on the refund tool were tuned from 4 to 8 seconds, the p95 for the endpoint would rise and a team looking only at the aggregate would investigate the model provider.
Latency in agent systems needs decomposition along several axes simultaneously: by operation type (model, tool, retrieval, orchestration overhead), by specific tool or model, by workflow, and by percentile. p50 tells you the normal experience; p95 and p99 tell you about the retry and fallback paths, which is where the interesting behavior lives. A tool whose p50 is 300 ms and p99 is 9 seconds is a different operational object from one that is uniformly 800 ms, even though their averages match.
Two distinctions matter more than the percentile arithmetic.
Time to first token versus time to completion. For streaming interfaces, the user's perceived responsiveness is governed by the former and the system's throughput by the latter. They can move in opposite directions — a change that improves generation speed but adds a pre-flight retrieval step makes the system faster and feel slower.
Response latency versus task completion latency. This is the one that catches teams out. An agent that replies "I've started processing your refund, you'll get a confirmation shortly" has a response latency of two seconds and a task completion latency of however long the asynchronous work takes — possibly minutes, possibly never, if the background job fails. The dashboard shows two seconds. The customer's experience is governed by the other number. Any agent that performs work asynchronously, schedules follow-ups, or hands off to a queue needs task-level latency instrumented as a separate measurement with its own SLO, terminating on the business outcome rather than on the HTTP response.
For a product leader, the translation is straightforward: response latency is a UX metric, task completion latency is a service-delivery metric, and only the second one predicts whether customers will contact you again about the same problem.
Cost Is a Behavioral Signal Wearing a Finance Costume
Token spend usually gets routed to finance and treated as a monthly number to be negotiated down. That is a waste of one of the highest-resolution behavioral signals available, because in agentic systems cost is a direct function of the path taken, and an abnormal path costs abnormal money before it produces an abnormal outcome.
Consider two executions of the same illustrative refund task:
| Nominal path | Pathological path | |
|---|---|---|
| Model calls | 3 | 17 |
| Tool calls | 5 | 12 |
| Retrieval operations | 1 | 6 |
| Retries | 1 | 5 |
| Input tokens | ~20,700 | ~168,000 |
| Output tokens | ~700 | ~4,100 |
| Wall clock | 11.9 s | 74 s |
| Final status | Success | Success |
| Dashboard appearance | Green | Green |
Both are counted as successful completions. Both return 200. The second consumed roughly eight times the tokens and six times the wall-clock time, and it is telling you something important: the agent could not resolve the task cleanly. Maybe the account resolution was ambiguous and it thrashed. Maybe retrieval kept returning irrelevant policy and it kept rephrasing. Maybe a tool was flapping and each retry pulled in more context. Whatever the cause, the cost distribution detected a behavioral anomaly that the success metric erased.
This is why the metric to build is not total token spend but cost per successful outcome, disaggregated by workflow. Total spend rises when usage rises, which tells you nothing. Cost per successfully completed refund, per resolved ticket, per correctly answered question — that number is stable when the system is behaving and moves when it isn't. When it doubles, one of a small number of things has happened: retrieval quality dropped and the agent is compensating with more attempts; a tool became unreliable and retries multiplied; a prompt change made the model more verbose or more indecisive; routing shifted traffic to a more expensive model; or the mix of incoming tasks got harder. Each of those is diagnosable, and each of them matters independent of the money.
Worth tracking alongside it: cost per failed task. Failures that are cheap are annoying. Failures that are expensive — the agent burned 90 seconds and 150,000 tokens and then escalated to a human anyway — are doubly costly, because you paid for the attempt and you are paying for the human. The ratio of spend on completed work to spend on abandoned work is a real efficiency measure and almost nobody computes it.
For the business, the framing is simple. An agent whose cost per completed task doubles has quietly become a different product with different unit economics, regardless of whether its output quality changed. If gross margin depends on automated resolution, then the cost distribution of automated resolution is a margin metric that belongs on the same page as the quality metrics, and a drift in it is a commercial event, not an infrastructure one.
The Loop Nobody Logged
Loops are the pathological path's most common cause, and they are unusually hard to see because they are composed entirely of successful operations.
The shape is familiar to anyone who has watched an agent transcript: search the knowledge base, find the result unsatisfying, rephrase, search again, call the model to reconsider, search a third time with a narrower filter, return to the original query, call a different tool, come back. No operation fails. No exception is raised. The workflow eventually terminates, often with a correct answer, having consumed an order of magnitude more resources than necessary.
Loops also come in a more dangerous variety: the retry loop against a state-changing tool where the retry is not safely idempotent. That is the mechanism in the opening scenario, and it converts a latency problem into a financial one.
The metrics that make loops visible are all cheap to compute from a well-formed trace:
- Steps per task and its distribution, not its mean. Loops live in the tail.
- Model calls per task and tool calls per task, by workflow.
- Repeated-call rate: the same tool invoked with substantially identical arguments more than once within a task. This is the single most direct loop indicator.
- Retry depth per tool and per task, separated from ordinary call counts.
- Maximum execution depth for delegating architectures.
- Time or steps without meaningful state progress — a workflow that has executed nine operations without a state transition is looping, regardless of whether each operation succeeded.
Detection is only half of it. Agent runtimes need enforced budgets, and the budgets should be explicit engineering artifacts rather than emergent properties of a max-iterations constant buried in a config file:
- Step budgets per workflow, sized from the observed distribution rather than guessed.
- Wall-clock timeouts at the task level, not just per call.
- Token and cost budgets per task, with the budget consumption exposed as telemetry so you can see how close to the ceiling normal work runs.
- Per-tool call budgets, especially for expensive or state-changing tools. A refund workflow should be permitted to call
issue_refundat most once, and the runtime should enforce that rather than trusting the model to. - Circuit breakers on tools that are failing or slow, so that a degraded dependency does not turn every task into a retry storm.
- Escalation as a first-class terminal state, so that hitting a budget hands off to a human with the accumulated context rather than failing silently or producing a low-confidence answer.
The observability requirement here is specific: budget exhaustion must be an emitted event, not a silent truncation. A workflow that stopped because it hit its step limit produced a different kind of output than one that stopped because it finished, and if both look identical in telemetry you have lost the distinction that matters most.
A Taxonomy of Failures That Never Raise an Exception
It helps to have vocabulary for the failure modes, because "the agent got it wrong" is too coarse to route to a fix. The following categories are ordered roughly by how visible they are to conventional monitoring, from most to least.
| Failure type | What happens | What it looks like operationally | Signals that reveal it |
|---|---|---|---|
| Hard failure | A tool or model call throws; the workflow aborts | 500s, exception traces, alerts fire | Ordinary error monitoring works fine here |
| Recovered failure | A call fails; the agent retries or falls back and completes | Green, with slightly elevated latency | Retry counts, fallback-model rate, attempt lineage on tool spans |
| Partial failure | One required action succeeds, another never happens | Green; response describes the intended outcome | State-machine completion checks; business-outcome reconciliation |
| Duplicate action | A retry re-executes a non-idempotent side effect | Green; both calls returned 200 | Repeated-call detection, idempotency key provenance, ledger reconciliation |
| State failure | The agent decided using stale or corrupted state | Green; the answer is internally consistent | State provenance and age; truncation events; memory read/write telemetry |
| Retrieval failure | The agent received wrong, stale, or conflicting context | Green; model metrics entirely normal | Document IDs and versions, index generation, conflict and freshness checks |
| Semantic failure | Every operation executes correctly; the conclusion is wrong | Green; fluent, confident output | Evaluation scores, task-completion checks, user correction signals |
| Policy failure | The outcome works but violated a business rule | Green; often praised by the user | State-transition auditing, policy gate telemetry, approval linkage |
| Efficiency failure | Correct result via an unreasonable number of operations | Green; latency and cost in the tail | Steps per task, cost per successful outcome, loop detection |
| Security/governance failure | The agent attempted or completed an unauthorized action | Green if the action succeeded; a denied attempt may log nothing | Authorization decision telemetry, denied-action events, privilege-scope monitoring |
| User-experience failure | Technically correct output that confuses or fails to help | Green; sometimes a good CSAT score | Follow-up rate, rephrase rate, abandonment, human handoff |
| Business failure | The user's actual goal was never achieved | Green; case closed as resolved | Ticket reopen rate, repeat contact, downstream domain events |
Notice how the signal column changes character as you go down. The top of the table is served by infrastructure telemetry. The middle is served by trace-level agent telemetry. The bottom requires evaluation and business-outcome data, which is to say it cannot be observed at all without deliberately building the correlation.
The opening scenario contains four of these simultaneously: a retrieval failure (stale policy ranked first) caused a policy failure (approval skipped), while a recovered failure (timeout plus retry) produced a duplicate action, and the reply to the user was a mild semantic failure (it described one refund when two had been issued). This is typical. Real agent incidents are rarely single-cause, which is precisely why single-layer monitoring finds them so late.
Five Signals, Five Different Jobs
Logs are not obsolete and traces are not a replacement for them. They answer different questions, and the practical failure is using one where another is required.
| Signal | Answers | Example in an agent system | Where it stops |
|---|---|---|---|
| Logs | What discrete events occurred? | "Policy gate evaluated: approval_required=false, source REF-POL v3.1" | No causal structure; correlating across services is manual and lossy |
| Metrics | How is the aggregate behaving over time? | Tool calls per task, p95 retrieval latency, fallback rate by workflow | Cannot explain any individual case |
| Traces | What caused what, in what order, across boundaries? | The full refund execution with parent/child spans and retry lineage | Describes behavior; has no opinion about whether it was right |
| Evaluations | Was the behavior and output actually good? | "Task completion: fail — refund issued without required approval" | Only sees the executions you sampled and the criteria you defined |
| Business outcomes | Did the real-world goal get achieved? | Ticket reopened after 19 days; two refunds posted against one charge | Arrives late, sometimes much later, and needs domain integration |
The value comes from joining them. A metric anomaly is a pointer into a set of traces; a trace is a pointer to the specific span that misbehaved; an evaluation attached to that trace turns "unusual" into "wrong"; a business event confirms whether it mattered. Teams that build these as four separate products with four separate identifiers spend their incidents doing manual joins instead of investigating.
Observability Gives Evidence. Evaluation Gives Judgment.
This distinction is load-bearing and routinely collapsed.
A perfect trace tells you the agent called billing.issue_refund with a particular amount against a particular transaction, that the call succeeded, and that the policy gate returned approval_required=false. It is complete, accurate, and entirely silent on the question of whether the agent should have done that.
Evaluation supplies the verdict. It is a separate system with separate inputs — criteria, reference data, judges, rules — and its output attaches back to the trace.
The evaluation toolkit for agents has several distinct instruments, and mature programs use most of them:
- Deterministic checks. The cheapest and most underrated. Did the workflow pass through every required state? Did the refund amount match the disputed transaction exactly? Did the agent target an account the requesting user is entitled to act on? Was every tool call within its declared budget? These are assertions, they are fast, they are unambiguous, and they can run on 100% of production traffic.
- Business rule checks. Policy conformance evaluated independently of the agent's own policy reasoning. If the agent's compliance depends on the agent correctly reading the policy, you have no control — you have a hope.
- Task completion checks. Did the thing the user asked for actually happen, verified against the system of record rather than the agent's assertion?
- Tool-use quality checks. Was the selected tool the appropriate one? Were arguments well-formed and minimal? Were there redundant calls? Some of this is rule-based; some benefits from a judge.
- Safety and policy checks. Content, data handling, and permission conformance.
- Model-as-judge scoring. Useful for graded, fuzzy qualities — helpfulness, faithfulness to retrieved sources, tone, completeness — where no rule can be written.
- Human review. Sampled, structured, and calibrated.
Model-as-judge deserves a caveat rather than an endorsement. Judges are themselves probabilistic systems with their own failure modes: position and verbosity biases, sensitivity to prompt phrasing, self-preference for outputs resembling their own style, and a general tendency to be more generous than a careful human. They drift when the judge model is updated. They are weakest exactly where you most need them — on domain-specific correctness that requires knowing your business rules. Use them for what they are good at: cheap, broad, directionally useful scoring across large volumes, calibrated against a human-labeled set at regular intervals, with disagreement rates between judge and human tracked as its own metric. Do not use them as the final word on whether a financial action was appropriate. Deterministic rules and human review own that.
Evaluation runs in two modes and needs both. Offline evaluation runs curated datasets against candidate versions before release: reproducible, comparable, and blind to whatever production is about to throw at you. Online evaluation scores real production executions, continuously or on a sample: it sees the real input distribution, but it cannot be a gate on a release that hasn't happened yet.
The connective tissue is evaluation telemetry attached to production traces. OpenTelemetry's generative AI conventions have been building exactly this: an event named gen_ai.evaluation.result that captures the result of evaluating GenAI output for quality or accuracy, parented to the GenAI operation span being evaluated where possible, carrying the evaluation metric name, a score, a human-readable label such as pass or fail, and a free-form explanation. Whether or not you adopt that specific shape, the architectural idea is the one to take: a judgment is a piece of telemetry that points at an execution, so that "show me the traces that failed the approval-conformance check this week" is a query rather than a project.
The loop this enables is the most valuable workflow in the entire discipline:
production trace  →  anomaly or evaluation failure detected
      →  representative case captured (with context, versions, tool results)
      →  added to an evaluation dataset
      →  reproduced offline against the current build
      →  root cause fixed
      →  case promoted to a regression test
      →  redeployed, with the same case scored on live traffic
      →  monitored for recurrence
Nothing about that loop is novel in software engineering. What is new is that the "test case" is a captured behavioral scenario rather than a unit of code, and that the criteria are often graded rather than binary.
The Only Success Metric the Business Actually Buys
An agent that generated a response is not an agent that did its job. response_generated = true is a liveness check wearing the costume of a success metric.
For the account operations agent in our scenario, the outcomes that matter are domain events, and they live in systems the agent talks to rather than in the agent itself:
- Was the disputed charge actually resolved in the billing ledger?
- Was exactly one credit issued, for the correct amount, against the correct transaction?
- Did the support case stay closed, or did it reopen?
- Did the customer contact support again about the same issue within the following week?
- Did a human have to intervene, and how much time did the intervention take?
- Was an SLA met?
- Did anything the agent did have to be reversed later?
Correlating these with technical telemetry requires an identifier discipline that is easy to establish at the start and painful to retrofit. The trace ID should travel with the business action: written to the support case, attached to the billing transaction's metadata, carried into the outbound email record. Then the join works in both directions — from an anomalous trace to its business consequence, and from a bad business outcome back to the exact execution that caused it.
The privacy caveat applies here as everywhere: correlate on pseudonymous or hashed identifiers where you can, keep the mapping in a governed store, and resist the urge to denormalize customer detail into the telemetry pipeline for convenience.
There is no universal set of business outcome metrics, and articles that supply one are selling a dashboard rather than describing a practice. A support agent's outcomes are resolution and reopen rates. A sales research agent's outcomes are meeting conversion and data accuracy. A code agent's outcomes are merge rate and post-merge defect rate. The discipline that generalizes is the requirement itself: every autonomous workflow should have at least one outcome metric measured outside the agent, in a system the agent cannot write to. An agent that grades its own homework is not being measured.
The commercial reading is short. An agent whose technical metrics are healthy and whose business outcomes are not is a system that is efficiently doing the wrong thing, and without the correlation you will find out at the same time your customers do.
Drift Rarely Files an Incident Report
Everything so far concerns one execution. The other half of the discipline is what happens across millions of them, over weeks.
Agent systems degrade gradually and in ways that produce no discrete failure event. The categories worth monitoring separately:
Model behavior drift — provider-side updates, deprecations, or routing changes alter output characteristics without any change on your side. Pinning versions reduces but does not eliminate this, and pinned versions eventually get retired.
Prompt drift — accumulated edits to templates, tool descriptions, and system instructions, each individually reasonable, that collectively shift behavior. Tool descriptions are prompts; a product manager rewording one for clarity is a behavioral deploy.
Retrieval and data drift — index rebuilds, document lifecycle changes, corpus growth diluting relevance, embedding model updates that invalidate a whole index, permission filters that begin excluding more than intended.
Tool and API drift — a downstream API adds a required field, changes an enum, tightens a rate limit, or alters its error semantics. The agent adapts, badly and silently.
User behavior drift — the input distribution changes because a marketing campaign brought in a new segment, or because users learned that a certain phrasing gets better results and now everyone phrases it that way.
Workflow drift — the behavioral consequence of all of the above: the agent begins routinely skipping a step it used to take, or adding one it didn't.
The observable symptoms are usually quantitative before they are qualitative, which is what makes them catchable:
- tool calls per successful task creeping from 5.1 to 6.4 over three weeks;
- fallback model usage rising from 2% to 9%;
- empty-retrieval rate doubling;
- the share of tasks reaching a human escalation increasing;
- tokens per completed task climbing while task volume is flat;
- one tool's p95 latency degrading, pulling retry rates up behind it;
- evaluation scores on faithfulness sliding by a few points a week;
- the distribution of workflow paths shifting — a branch that used to take 3% of traffic now takes 15%.
None of those trips a threshold alert on error rate. All of them are visible in a baseline comparison. This is the argument for treating behavioral distributions as monitored objects in their own right: not "is this number too high" but "is this distribution the same shape it was last month, for this workflow, on this agent version."
Deploying Successfully Is Not Releasing Successfully
A deployment that completes without error tells you the artifact shipped. For an agent, that is roughly as informative as knowing the plane left the gate.
Agent releases come in more flavors than code releases: an agent version, a prompt template revision, a model version or routing change, a retrieval index rebuild, a tool schema update, a policy document revision, an orchestration change. Each can shift behavior independently, and each needs to be a comparable dimension in telemetry.
The comparison a release decision should be based on, measured on real traffic, between the previous version and the new one:
- task success rate and evaluation scores, by workflow;
- tool-call patterns — which tools, in what order, how often, with what argument distributions;
- steps and model calls per task, including the tail;
- latency at p50/p95/p99, decomposed by operation type;
- tokens and cost per successful task;
- escalation and human-handoff rate;
- clustering of failures — not just how many, but whether they concentrate in a new place.
The tool-call pattern comparison is the one teams tend to skip and the one that catches the most. A prompt revision that improves phrasing while causing the agent to call the knowledge base twice instead of once has improved the thing you measured and degraded the thing you didn't. Comparing the distribution of tool sequences between versions surfaces that immediately.
Practically, this means agent releases want progressive delivery — canary or shadow traffic, with behavioral comparison as the promotion gate rather than error rate. It also means keeping the previous version's baselines available. A behavioral regression is only detectable against a recorded normal.
Your Traces Are Now a Data Protection Problem
Observability for agents creates risk in the act of reducing it, and the risk is not hypothetical.
A fully instrumented agent trace can contain user prompts, customer records returned by tools, financial transaction detail, internal policy documents pulled from retrieval, the system instructions the company treats as proprietary, tool arguments containing identifiers, and the authorization context under which everything executed. Aggregated across a production fleet, that is a searchable, exportable, long-retained corpus of exactly the material your security program spends its budget protecting elsewhere.
The controls are unglamorous and mostly familiar:
- Data minimization by default. Capture structure always, content deliberately. The question is not "could this be useful?" but "what specific investigation requires this, and for how long?"
- Redaction and secret filtering in the pipeline. Pattern-based scrubbing of identifiers, card numbers, tokens, and credentials at the collector, before export. Assume any content field can contain a secret, because tool arguments eventually will.
- Tiered retention. Structural telemetry for months, content for days.
- Role-based access with its own audit trail. Reading production prompts is an access to customer data. It should be logged as one.
- Tenant and region isolation. Multi-tenant telemetry stores need the same boundaries as multi-tenant databases, including data residency where it applies.
- Encryption in transit and at rest, and a clear answer to where telemetry physically lands when a third-party platform is involved.
There is a further distinction that most teams discover during their first audit: debugging telemetry and audit telemetry are not the same artifact.
Debugging telemetry is high-volume, sampled, short-lived, mutable in format, optimized for investigation, and readable by engineers. Audit telemetry is selective, complete for the events it covers, long-lived, schema-stable, tamper-evident, and readable by compliance. They overlap — both describe the refund call — but their requirements conflict. Sampling is correct for debugging and unacceptable for audit. Ninety-day retention is generous for debugging and inadequate for financial records.
The practical resolution is to emit audit events explicitly for the classes of action that warrant them, separately from the trace pipeline, and to link the two by trace ID. Candidates, in most enterprise contexts: any financial action, any permission or entitlement change, any record deletion or data export, any outbound communication to a customer, any modification of an account or contract, and any case where a guardrail blocked an action or a human overrode the agent.
That last category is easy to overlook and unusually valuable. A denied action often generates no telemetry at all, because nothing happened — and "the agent repeatedly attempted an operation outside its authorized scope" is precisely the pattern a security team needs to see. Instrument the denials. A rising rate of blocked high-impact tool attempts is one of the few genuinely early warnings available in this domain.
You Cannot Keep Everything, and You Should Not Try
Full-fidelity capture of every operation, every argument, every retrieved document, and every model input for every interaction, retained indefinitely, is expensive, slow to query, and — per the previous section — a liability. Sampling is not a compromise forced by budget; it is a design decision with correctness implications.
A workable strategy layers several approaches:
- Head sampling for volume control on routine, low-risk traffic, applied at trace start.
- Tail sampling so that the decision to keep a trace can be made after its outcome is known — which is the only way to reliably retain the interesting ones.
- Error-biased retention: keep everything that failed, obviously, but also everything that was recovered, since recovered failures are where silent damage lives.
- Anomaly-biased retention: keep traces whose step count, token consumption, depth, or duration sits outside the normal band for their workflow.
- Risk-biased retention: keep 100% of traces containing high-impact tool calls, regardless of outcome, at full structural fidelity.
- Metadata universal, content selective: never sample away the structure; sample the text.
- Temporarily elevated sampling after any release, prompt change, index rebuild, or model version change, decaying back to baseline once the new version has a stable profile.
The most important instruction in this section is the counterintuitive one: an unusual successful trace is often more valuable than a failed one. A failure is already visible and already being investigated. A task that succeeded after twenty-eight tool calls when the median is four succeeded despite something, and that something is a latent defect that will eventually produce a failure under slightly different conditions. If your sampling policy retains errors and discards anomalous successes, you are systematically throwing away your best early warnings.
A Dashboard Organized Around Questions, Not Metrics
It is easy to produce a screen with forty numbers on it that nobody looks at twice. The organizing principle that survives contact with an on-call rotation is to group by the question being asked, and to keep each group small enough that an anomaly is visible without hunting.
Is it being used, and by whom? Agent invocations, sessions, turns per session, distinct tasks attempted, workflow mix. Volume context makes every other panel interpretable.
Is it working, mechanically? Hard failure rate, tool error rate by tool, retry rate, fallback-model rate, budget-exhaustion rate, guardrail block rate. This is the closest thing to a conventional reliability panel, extended with the agent-specific recovery signals.
Is it fast, and where does the time go? End-to-end task latency at p50/p95/p99, split into model, tool, retrieval, and orchestration; per-tool latency; time to first token; and — separately — task completion latency for asynchronous work.
How is it behaving? Model calls per task, tool calls per task, steps per task, repeated-call rate, execution depth, handoff counts, distribution of workflow paths. This panel is the behavioral fingerprint, and it is the one that most distinguishes agent operations from application operations.
What does it cost? Tokens per task, cost per task, cost per successful task, cost split by model, by workflow, and by tool-heavy versus model-heavy paths, plus cache hit rate where prompt caching is in use.
Is it any good? Evaluation scores by criterion, task completion rate verified against systems of record, tool-use correctness, human escalation rate, user correction and rephrase signals, ticket reopen rate.
Is it safe? Blocked actions, authorization denials, high-impact tool call volume with approval linkage, policy-gate outcomes, and any workflow that reached a state-changing action without passing its required control state.
These are not universal, and any article claiming otherwise should be treated with suspicion. The dashboard has to reflect what the agent is responsible for. An agent that answers documentation questions needs a serious quality panel and a trivial governance one. An agent that can modify contracts needs the inverse emphasis. Build the dashboard from the agent's authority, not from a template.
Alerting on Behavior, Not Just Breakage
"Alert if the agent error rate exceeds 5%" is not wrong; it is simply aimed at the failures that were already going to be noticed. Everything this article has described as dangerous is invisible to it.
The alerts that catch agentic failure are behavioral, and they compare against a baseline rather than a constant:
- tool calls per task for a workflow shifts materially from its trailing baseline;
- usage of a specific high-impact tool deviates from its normal rate — refunds per thousand conversations is a fine metric and an excellent alert;
- fallback-model usage spikes, which usually means the primary is rate-limiting or erroring and quality is silently degrading;
- empty or low-relevance retrieval rises above its baseline for any index;
- cost per successful task moves beyond its normal band;
- workflow execution depth at p95 changes shape;
- an evaluation criterion's score declines after a release, canary versus baseline;
- human escalation rate moves in either direction — a sharp drop can mean the agent stopped escalating cases it should;
- repeated-call rate rises, indicating loops;
- one prompt template version correlates with anomalous behavior relative to its predecessor;
- denied or blocked high-impact actions increase.
Two design notes. First, resist universal thresholds. There is no correct number of tool calls per task in general; there is a correct distribution for this workflow on this version, learned from observation. Alerts should fire on deviation from an established baseline, segmented by workflow and version, because a single global threshold will either be too loose to catch anything or so noisy it gets muted within a week.
Second, weight alerts by consequence rather than by frequency. A 5% shift in knowledge base search patterns is interesting. A 5% shift in refund tool invocation rate is an incident. The same statistical deviation carries different urgency depending on what the tool can do, and the alerting policy should encode that explicitly — which is another reason the tool tiering from earlier earns its keep.
Reopening SR-48812
Nineteen days after the Tuesday morning refund, a finance analyst files an internal ticket: two refunds, same amount, same transaction, seven seconds apart, neither approved. Here is how that investigation runs in an organization that has built the visibility described above — and, at each step, what would have been impossible without it.
Start from the business event, not the technical one. The analyst has a billing transaction, not a trace. Because the refund tool writes the trace ID into the transaction's metadata, the join is one lookup rather than a timestamp-based search through nineteen days of logs. Both refund records point at the same trace: 7f3a…c19.
Establish the version context. The trace carries the agent version (4.2.1), the workflow version (refund_v9), the prompt template version (v17), and the retrieval index generation. All are unremarkable and unchanged for three weeks. This immediately eliminates the most common hypothesis — "something we shipped" — and redirects attention to the inputs rather than the code.
Walk the model calls. Three calls, all with normal token counts and clean finish reasons. The second call, which produced the decision to refund, consumed about 7,900 input tokens. Nothing anomalous. The model is not the suspect.
Walk the tool sequence. Five distinct tools, twelve spans. And there it is, plainly: billing.issue_refund appears twice. Attempt one, 4.2 seconds, terminated by a 504 from the API gateway. Attempt two, 0.5 seconds, success. Both carry the same amount and the same target transaction. Both carry an idempotency key — and the key's recorded provenance says it was derived from the request timestamp.
That single attribute resolves the duplicate. The refund service was designed to deduplicate on the idempotency key. The gateway timed out after the billing service had already committed the first refund, so from the gateway's perspective the call failed and the agent runtime dutifully retried. But because the key was regenerated at retry time from a fresh timestamp, the billing service saw a distinct request and processed it as a new refund. The retry was correct in intent and unsafe in implementation. Two credits, one dispute.
Inspect the retrieval. Five documents returned from the policy index. The top-ranked hit is REF-POL version 3.1. Version 4.0 is in the same result set at rank three. The policy gate span records approval_required = false with source = REF-POL v3.1. Version 4.0 requires human approval for credits above $2,500 on annual contracts. The agent read the older document, applied it faithfully, and skipped the approval state.
Why did the stale version rank first? The index rebuild that ingested v4.0 completed successfully, but the search alias policy_live was never repointed from the previous generation to the new one, so the live index contained both generations of the corpus. The rebuild job reported success. Its dashboard was green. The document was findable, which is why nobody's smoke test failed. It simply lost the ranking contest to its own predecessor, which had accumulated more click signal.
Check the state machine. The workflow reached ISSUE_REFUND without ever entering REQUEST_APPROVAL. The transition telemetry shows it, and a query across the previous month shows eleven other refund workflows with the same shape — all above the threshold, all unapproved, all closed as resolved, all rated highly by customers.
Compare against normal. Median refunds of this class: one issue_refund call, one retrieval returning a single policy version, one approval state entered. This trace deviates on three of those axes at once.
Assemble the causal chain. No single component failed. An index alias was not repointed; therefore two versions of a policy document coexisted; therefore ranking chose the older one; therefore the agent's policy determination was correct with respect to obsolete input; therefore a required control state was skipped; meanwhile a timestamp-derived idempotency key turned a routine gateway timeout into a duplicate financial action; and a final summarization step described the intended outcome rather than reconciling against the two tool results it had actually received. Every span returned success. Every dashboard stayed green. The model did not hallucinate anything.
That last point is worth dwelling on, because it inverts the default assumption. The most expensive AI failures in production are frequently not model failures. They are integration, data-lifecycle, and control-flow failures in which the model behaves reasonably given inputs that nobody was watching. A monitoring program aimed exclusively at model quality would have found none of this. A program aimed at infrastructure health would have found none of it either. Only telemetry that spans retrieval, tools, state, and outcomes puts the pieces adjacent to each other.
Then fix more than the bug. The index alias gets a post-rebuild verification step and a conflict check that fires when a retrieval result set contains multiple versions of the same logical document. The idempotency key becomes deterministic, derived from the task and transaction identifiers rather than the clock. The workflow runtime is changed to reject a transition into ISSUE_REFUND from any state other than REQUEST_APPROVAL or an explicitly-permitted low-value path — enforced by the runtime, not by the prompt. The final summarization step is required to cite the tool results it is summarizing, and a deterministic check verifies that the number of refunds asserted matches the number executed. And the eleven other affected cases get reconciled.
A Trace Is a Test Case That Hasn't Been Written Yet
The failure above should not end its life in a postmortem document. A production trace is the highest-fidelity specification of real system behavior that a team will ever possess, and discarding it after the fix is the single most common waste in agent operations.
From that one incident, a competent team extracts:
- An evaluation case: the exact user request, tenant configuration, account state, and retrieval conditions, with a pass criterion of "approval state entered, exactly one refund issued."
- A regression test: the same scenario, run against every candidate build, with the policy-version conflict deliberately reproduced.
- A tool mock for the billing API that returns a 504 after committing the write — a behavior that is nearly impossible to reproduce by chance and trivial to reproduce by design.
- A stale-context fixture: a retrieval index seeded with two versions of the same policy, so that any agent that reads only the top hit fails the test.
- A deterministic assertion added to the production evaluation pipeline: no refund workflow may complete without either an approval record or an amount below the threshold. This one runs on 100% of live traffic and would have caught the other eleven cases in under a day.
- A failure-injection scenario for the chaos suite: duplicate-response semantics on a state-changing tool.
The loop — observe, investigate, reproduce, test, fix, evaluate, deploy, observe again — is ordinary quality engineering applied to a system whose behavior can only be discovered empirically. What changes is the direction of information flow. In conventional software, tests are written from specifications and production confirms them. In agent systems, production reveals behavior and tests are written to pin it down. Teams that do not build the return path from production into their test assets are re-learning the same failures indefinitely.
What Observability Cannot Prove
Production telemetry has a structural blind spot: it can only tell you about conditions that have actually occurred. That is a serious limitation for systems whose worst behavior appears under conditions that are rare, correlated with outages, and disproportionately consequential.
The 504-after-commit in our scenario might occur in one refund in four thousand. You cannot wait for it to teach you. Testing is how you create the conditions that production has not yet supplied, and for agent systems the interesting conditions are mostly about degraded dependencies and malformed inputs, not about happy-path correctness:
tool timeouts at various points in the workflow; malformed or truncated tool responses; responses that are valid JSON but semantically wrong; permission denials mid-workflow; rate limiting and its backoff behavior; partial API responses; stale or conflicting retrieval; empty retrieval; duplicate tool responses; forced model fallback; context-window overflow and truncation; network interruption between steps; corrupted or missing state on resume; and unannounced tool schema changes.
The division of labor is clean enough to state in three lines. Production telemetry tells you what the system actually does. Testing tells you what it would do under conditions you choose. Evaluation tells you whether either is acceptable. A program with all three has coverage; a program with any two has a specific, predictable blind spot.
Breaking the Agent on Purpose
Fault injection deserves more than a nod, because agent systems respond to injected faults in ways that are genuinely difficult to predict from reading the code — which is exactly why the experiment is informative.
A practical injection catalogue, aimed at the agent layer rather than the infrastructure layer:
- Make a tool time out at different points: before any side effect, after the side effect but before the response, and intermittently across retries. The middle case is the one that produces duplicates and the one nobody tests.
- Return a well-formed but wrong result: a valid account record for the wrong account, a transaction list missing the relevant row, a policy document from the wrong tenant.
- Return malformed or truncated JSON from a tool, and separately, return a valid response with an unexpected new field or a changed enum value — simulating a schema drift the agent was not told about.
- Deny authorization mid-workflow, after the agent has already told the user what it intends to do.
- Rate-limit a tool or model and observe whether backoff is bounded, whether the workflow degrades gracefully, and whether a fallback path silently changes behavior.
- Poison retrieval: return nothing, return only stale documents, return contradictory documents, return documents from an adjacent tenant that the filter should have excluded.
- Duplicate a tool response, or deliver responses out of order, in systems with asynchronous tool execution.
- Force fallback to the secondary model and measure the behavioral delta, not just the latency delta. Most teams have never measured what their fallback model actually does to task success.
- Overflow the context window with a long conversation and verify what gets truncated and whether the agent knows it lost something.
- Corrupt or expire state between checkpoints and observe resume behavior.
What you are watching for is not "did it survive." It is the shape of the response:
Does it retry, and is the retry safe? Does it loop, and does a budget stop it? Does it give up cleanly, or does it produce a confident answer built on a failed step? Does it tell the user the truth about what happened — the critical case being an agent that reports success for an action that failed? Does it escalate to a human with sufficient context, or escalate with none? Does it preserve state so the work can be resumed, or is the partial work orphaned? Does it duplicate a side effect? And, importantly: does the telemetry make the failure legible? If you inject a fault and cannot see it clearly in your own traces, you have discovered a gap in instrumentation, which is a finding as valuable as the behavioral one.
Run these in a staging environment against realistic data, and run a subset continuously as synthetic production probes for the highest-impact workflows. The probes double as a canary: a synthetic refund workflow run every fifteen minutes, with assertions on the state sequence and the tool call count, detects the class of drift that no user complaint will surface for weeks.
What This Changes for Quality Engineering
The testing surface expands rather than shifts. The deterministic components around the model — APIs, integrations, data pipelines, permission systems, UIs, state stores — fail in the same ways they always have, and the traditional discipline that covers them remains necessary. Contract testing on tool schemas is arguably more important now, because a model consuming a changed schema fails less loudly than a compiler does.
What is added is a set of objects that were not previously in scope for quality work:
- Behavioral traces as test artifacts — captured, versioned, and replayed.
- Tool contracts as prompt surface — a tool's description is an input to model behavior, so changing it requires the same scrutiny as changing a prompt.
- Agent state and transition graphs as testable structures with legal and illegal moves.
- Prompt and template versions as first-class release artifacts with their own change control and their own regression suites.
- Evaluation datasets as maintained assets that grow from production and decay if not curated.
- Production failure clusters as the primary source of new test cases.
- Business outcome verification as part of the definition of done for an agent workflow.
- Instrumentation itself as a testable requirement: if a new tool ships without span attributes for authorization decision and idempotency provenance, the observability suite should fail the build.
The practical consequence is that quality engineering moves closer to production than it typically sits. The most valuable test cases are discovered in traces, not written from requirements, and the feedback loop only closes if the same people can see both.
A Reference Architecture, Deliberately Vendor-Neutral
Nothing in this article requires a particular platform. The layering below is a conceptual arrangement of responsibilities; several of these boxes are frequently the same process, and the important property is that each concern has an identifiable owner and an identifiable telemetry contract.
                          Users / Client applications
                                      │
                          Application & API layer
                       (auth, tenancy, request context,
                        trace initiation, business IDs)
                                      │
                              Agent Runtime
        ┌─────────────┬──────────────┬─────────────┬──────────────┐
        │             │              │             │              │
   Orchestration  Model Gateway   Retrieval   Tool Gateway    State Store
   (workflow &   (routing, fall-  (indexes,   (registry,      (sessions,
    state machine, back, caching,  rankers,    schemas, authz,  memory,
    budgets,      token accounting) filters)   idempotency,    checkpoints)
    delegation)         │             │        MCP clients)        │
        │               │             │             │              │
        │          LLM providers  Vector / search  Internal APIs,   │
        │                          / data stores   SaaS, MCP servers│
        │                                                           │
        └──────────────── Policy & Guardrail Layer ─────────────────┘
             (permissions, approval gates, content controls,
              action budgets, blocked-action events)
                                      │
                        Instrumentation (OpenTelemetry)
              spans · metrics · logs · events · evaluation results
                                      │
                          Collector / Telemetry Pipeline
              redaction · sampling · enrichment · routing · tenancy
                                      │
        ┌──────────────────┬──────────────────┬────────────────────┐
        │                  │                  │                    │
   Traces & Logs      Metrics & Baselines  Evaluation Store    Audit Log
   (investigation)    (drift, alerting)   (scores, datasets)  (immutable,
        │                  │                  │                high-impact
        └──────────────────┴──────────────────┴───────┐         actions)
                                                       │
                            Business Event Correlation │
                     (tickets, billing, CRM, outcomes) │
                                      │                │
                    Alerting · Incident response · QA regression assets
                                      │
                        ──── feeds back into ────▶ Agent Runtime
A few notes on the layers that carry the most weight.
The model gateway is worth building even when you use one provider. Centralizing routing, fallback, retries, token accounting, and prompt-version resolution gives you a single place to instrument model behavior consistently, rather than scattering it across every call site.
The tool gateway is the highest-leverage component in the entire diagram. If every tool call — local function, internal API, or remote MCP server — passes through one layer that enforces authorization, applies idempotency, records arguments and results, tags side-effect classification, and emits standardized spans, then tool observability becomes a property of the architecture rather than a per-tool discipline that erodes over time.
The policy and guardrail layer must be outside the model's control loop. A rule the agent can talk itself out of is not a rule. Placing approval gates, action budgets, and permission checks in deterministic code, with their decisions emitted as telemetry, is what makes the difference between an auditable system and a plausible one.
The collector is where privacy is actually enforced. Redaction, sampling, and tenant routing applied here happen inside your boundary, before any data leaves. This is also what makes the architecture portable: swap the backend without re-instrumenting the application.
The Standard That Makes Any of This Portable
Instrumenting agents was, until recently, an exercise in vendor-specific SDKs producing mutually unintelligible telemetry. Common semantics change that, and the relevant work is happening in the OpenTelemetry generative AI semantic conventions.
The shape they define maps closely onto everything above. A trace resolves into a span tree with a top-level invoke_agent span, child chat spans for each model call, and execute_tool spans for each tool invocation. Model spans carry attributes including gen_ai.request.model, gen_ai.usage.input_tokens and gen_ai.usage.output_tokens, and gen_ai.response.finish_reasons. Agent-level spans define gen_ai.agent.name, gen_ai.agent.id, and gen_ai.agent.version, along with gen_ai.conversation.id for correlating turns within a session, gen_ai.provider.name for the provider, and cache-aware token attributes gen_ai.usage.cache_read.input_tokens and gen_ai.usage.cache_creation.input_tokens. The operation vocabulary now covers create_agent, invoke_agent, invoke_workflow, plan, chat, execute_tool, retrieval, embeddings, and a family of memory operations including search_memory and update_memory. On the metrics side, gen_ai.client.operation.duration measures the total time of a GenAI operation and gen_ai.client.token.usage measures tokens used in requests and responses. For evaluation, a gen_ai.evaluation.result event attaches a metric name, score, label, and explanation to the operation being evaluated. And for remote tooling, MCP attributes such as mcp.method.name, mcp.protocol.version, and mcp.resource.uri now live in the same GenAI conventions repository.
Two facts about maturity matter more than the attribute list, and getting them wrong will cost you.
First, none of this is stable. The GenAI agent span conventions carry Development status, and the same is true across the GenAI surface. The conventions also recently changed address: the core semantic-conventions repository deprecated and moved all gen_ai content in v1.42.0 in June 2026, and the work now lives in a dedicated open-telemetry/semantic-conventions-genai repository. Attribute names have already changed once in ways that matter — gen_ai.system giving way to gen_ai.provider.name is the most visible — and instrumentation libraries in the wild emit multiple generations simultaneously during transition periods.
Second, content capture is opt-in by design, as discussed earlier. Structural telemetry flows by default; message content does not.
The practical guidance that follows is unglamorous and worth following: adopt the shape immediately, because invoke_agent / chat / execute_tool nesting with model, token, and duration attributes is the right structure regardless of what the strings eventually settle on. Pin the semantic convention version and the instrumentation library versions you depend on. Put a thin mapping layer between the convention strings and your own dashboards and alerts, so that a rename upstream is a one-file change rather than a fleet-wide dashboard rewrite. And verify empirically what your framework actually emits rather than trusting its documentation, because the gap between the two is currently wide.
Why bother, given the churn? Because the alternative is worse. Without common semantics, every framework, model provider, and observability vendor produces an incompatible telemetry dialect, and correlation across a heterogeneous stack — which is what every real deployment eventually is — becomes a permanent integration project. With common semantics, telemetry from a Python orchestration layer, a remote MCP server, and a managed agent runtime can land in the same trace and be queried with the same attribute names. Cloud platforms are already building on this: Google Cloud's agent observability documentation describes deriving application metrics by filtering and aggregating trace data using labels and events that follow the OpenTelemetry GenAI semantic conventions, and frames the required inputs as logs for events and errors, metrics for latency and token usage, and traces for execution paths — from which metrics such as the number of model calls or total token usage are derived. Their platform dashboards organize around much the same questions used above: session and invocation volume, token usage split by input and output, latency percentiles at p50, p95, and p99, error rates, per-tool call counts and latency including how often no tool was called, and continuous online quality monitors covering response quality, safety, hallucination rate, and tool-use quality. The convergence is a useful signal about which questions have turned out to matter.
Where Organizations Actually Are, and What Each Position Costs Them
Capability tends to arrive in a recognizable order. The stages below are descriptive rather than prescriptive, and most organizations running agents in production today sit somewhere in the first three.
Service awareness. You know the agent is up, responding, and not throwing. You have HTTP metrics, container health, and application logs. What you gain: you will notice an outage. What you still lack: any ability to distinguish a good execution from a bad one, or to explain a single complaint.
Component correlation. Model calls and tool calls are individually instrumented and share a trace ID. You can see that a request involved four model calls and six tool calls, with durations and token counts. What you gain: latency and cost attribution, and the ability to identify a slow or failing dependency. What you still lack: the semantic layer — which document, which policy, which state, which decision.
Task reconstruction. A complete execution can be rebuilt end to end, with context composition, retrieval identities and versions, state transitions, tool arguments and authorization decisions, retries, and version metadata for every moving part. What you gain: investigations move from hours of archaeology to minutes of reading. What you still lack: judgment. You can explain what happened without knowing whether it should have.
Outcome evaluation. Executions carry evaluation results, and technical traces are correlated with business events in systems of record. Task success is measured externally to the agent. What you gain: the ability to say what proportion of work the agent actually completed correctly, and to price the failures. What you still lack: time-series intuition. You know today's quality; you cannot yet see it moving.
Behavioral baselining and closed-loop quality. Behavioral distributions are baselined per workflow and per version, drift and anomaly alerts fire on deviation rather than on thresholds, releases are gated on behavioral comparison, and production failures are systematically converted into evaluation and regression assets. What you gain: the system improves in a directed way, and degradation is caught before customers report it. What remains hard: everything about this is a maintenance commitment. Baselines rot, evaluation sets go stale, and criteria need revision as the product changes.
The honest framing for a leadership audience: each stage costs engineering time and buys down a specific category of risk. Stopping at component correlation is a defensible choice for an internal informational assistant. It is not a defensible choice for software that can move money.
What to Instrument First
No team should attempt all of this at once, and the sequence should be driven by what the agent is permitted to do rather than by what is technically interesting.
Start with correlation identifiers and version metadata. A trace ID that spans the whole task, and attributes for agent version, workflow version, prompt template version, model identity, and retrieval index generation. This is a small amount of work with an outsized return, because it makes every subsequent investigation possible and every subsequent question answerable by version.
Then instrument model and tool calls as spans, with durations, statuses, retry lineage, and token counts. This gives you the execution skeleton.
Then add behavioral and economic metrics derived from those spans: steps per task, tool calls per task, repeated-call rate, tokens and cost per task, latency decomposed by operation type.
Then add auditability for high-impact actions: for every state-changing or financially consequential tool, an immutable event carrying the authorization decision, the policy source, the idempotency evidence, the target reference, and the approval linkage. If you can only afford one thing beyond the basics, this is the one, because it is the difference between an incident you can explain to a customer and one you cannot.
Then correlate to business outcomes by writing trace identifiers into the domain systems the agent touches, and reading domain events back.
Then layer in evaluation — deterministic and business-rule checks first, on full traffic, because they are cheap and unambiguous; graded and model-judged evaluation second, on samples.
Then build baselines and drift detection, which require a few weeks of stable data to be meaningful and cannot be usefully rushed.
Finally, close the loop by feeding production failures into regression and evaluation suites as a standing practice with an owner, not as a heroic post-incident effort.
Priority scales with authority. An agent that answers questions from a documentation corpus needs retrieval telemetry, quality evaluation, and cost visibility, and can reasonably defer the audit layer. An agent that can issue refunds, change entitlements, send customer communications, or modify contracts needs the audit layer, the policy-gate telemetry, and the business-outcome reconciliation before it is given that authority, not after the first reconciliation surprise. The instrumentation should be provisioned in proportion to the blast radius, and the blast radius is a product decision, not an engineering one.
Questions Worth Asking Before the Next Agent Ships
A short set of questions that a production readiness review can use. They are diagnostic rather than exhaustive; the point is that each one has a yes-or-no answer that most teams discover they cannot give.
- Can we reconstruct a single user task end to end, across every model call, retrieval, and tool execution?
- Can we identify the agent version, workflow version, prompt template version, model version, and retrieval index generation behind any given interaction?
- Can we distinguish a tool call that succeeded from a task that was actually completed?
- Can we tell, from telemetry alone, which retrieved documents influenced a decision, and what version they were?
- Can we see repeated tool calls, retry depth, and loops — and does anything stop them?
- Can we detect a task that consumed abnormal tokens, steps, or time, even though it succeeded?
- Can we prove, for any state-changing action, what authorized it, what policy applied, and whether a required approval occurred?
- Can we detect that an agent attempted an action outside its permitted scope, even when the attempt was blocked?
- Can we correlate a production execution with the business outcome it was supposed to produce, in a system the agent cannot write to?
- Can we investigate a failure without granting the investigator broad access to customer content?
- Can we compare the behavior of the current release against the previous one on real traffic, before full rollout?
- Can we detect gradual degradation when no exception is ever raised?
- Can we turn any production incident into a reproducible test case within a day?
A team that answers yes to most of these has an operable system. A team that answers no to most of them has a system that happens to be working.
Back to Tuesday Morning
At 09:14 the organization knew one thing: the request succeeded. Eleven seconds, HTTP 200, five stars, case closed.
With the visibility described here, the same eleven seconds is a complete account. Which agent version ran, under which prompt template and which workflow revision. Which context it assembled and from where. That the policy it applied was a superseded version that outranked its own replacement because an index alias was never repointed. That a required approval state was never entered, and that eleven other cases share the pattern. That a gateway timeout arrived after the write committed, and that a clock-derived idempotency key turned a routine retry into a second refund. That the reply the customer read described the plan rather than the results. What the path cost, how far it deviated from the median execution of the same task, and whether the same deviation is appearing elsewhere in the fleet.
None of that changes what happened on Tuesday. It changes how long the organization spends not knowing — nineteen days versus nineteen minutes — and whether the fix is one incident's worth of learning or a permanent property of the system.
The demo proves the agent can do the task. Production asks a harder question, and it asks it a thousand times a day: between the request arriving and the outcome landing, can you say what your software did, why it did it, what it cost, and whether you would sign your name to the path it took? Software that acts on its own behalf has to be explainable on demand, and explainability is not a property of the model. It is a property of the telemetry you decided to build before you needed it.
Reliable AI products are built the same way reliable software has always been built: with testing that anticipates failure, integration validation across the systems an agent touches, observability designed before the first incident rather than after it, automation that keeps regression cost low, and a working return path from production behavior into the test suite. That is the engineering discipline QAtronic practices around agentic systems — and it is what turns a convincing demo into software an organization can operate.
Sources and Further Reading
OpenTelemetry — primary specifications
- OpenTelemetry, Semantic Conventions for GenAI agent and framework spans —
create_agent,invoke_agent,invoke_workflow,plan, andexecute_toolspans; agent, conversation, token, and content attributes; status Development. https://github.com/open-telemetry/semantic-conventions-genai/blob/main/docs/gen-ai/gen-ai-agent-spans.md - OpenTelemetry, Semantic Conventions for GenAI events — including the
gen_ai.evaluation.resultevent. https://github.com/open-telemetry/semantic-conventions-genai/blob/main/docs/gen-ai/gen-ai-events.md - OpenTelemetry, Semantic Conventions for GenAI metrics —
gen_ai.client.operation.duration,gen_ai.client.token.usage, server-side latency metrics. https://github.com/open-telemetry/semantic-conventions-genai/blob/main/docs/gen-ai/gen-ai-metrics.md - OpenTelemetry, GenAI attribute registry. https://opentelemetry.io/docs/specs/semconv/registry/attributes/gen-ai/
- OpenTelemetry, MCP attribute registry (attributes moved to the GenAI conventions repository). https://opentelemetry.io/docs/specs/semconv/registry/attributes/mcp/
- OpenTelemetry blog, Inside the LLM Call: GenAI Observability with OpenTelemetry (May 2026) — span tree structure and content-capture behavior. https://opentelemetry.io/blog/2026/genai-observability/
Cloud platform documentation
- Google Cloud, Agent observability (Google Cloud Observability) — telemetry categories, derivation of metrics from trace data using GenAI semantic conventions. https://docs.cloud.google.com/stackdriver/docs/observability/agent-observability
- Google Cloud, Observability overview, Gemini Enterprise Agent Platform — dashboard structure covering sessions, token usage, latency percentiles, per-tool metrics, and online quality monitors. https://docs.cloud.google.com/gemini-enterprise-agent-platform/optimize/observability/overview
- Google Cloud, Set up tracing, Gemini Enterprise Agent Platform — telemetry enablement and the separate opt-in for capturing prompt and response content. https://docs.cloud.google.com/gemini-enterprise-agent-platform/scale/runtime/tracing
- Google Cloud, Monitor an agent, Vertex AI Agent Builder — request latency, token count, and tool-calling metrics. https://docs.cloud.google.com/agent-builder/agent-engine/manage/monitoring
Protocol and ecosystem
- Model Context Protocol specification. https://modelcontextprotocol.io/
- W3C, Trace Context recommendation — the propagation format that keeps traces intact across service and protocol boundaries. https://www.w3.org/TR/trace-context/
Analysis and commentary
- J. Hodge, The state of the OpenTelemetry GenAI semantic conventions (July 2026) — on the June 2026 repository split, Development status across the GenAI surface, and multi-generation attribute emission in the wild. https://john-hodge.com/blog/opentelemetry-genai-semantic-conventions/
- Greptime, How OpenTelemetry Traces LLM Calls, Agent Reasoning, and MCP Tools (May 2026) — layer-by-layer walkthrough of the conventions, including MCP span composition. https://greptime.com/blogs/2026-05-09-opentelemetry-genai-semantic-conventions
The production scenario used throughout this article is fictional and composite, assembled from common failure patterns in agentic systems. All trace structures, timings, token counts, and cost figures are illustrative examples rather than measurements from any real system or customer.



