
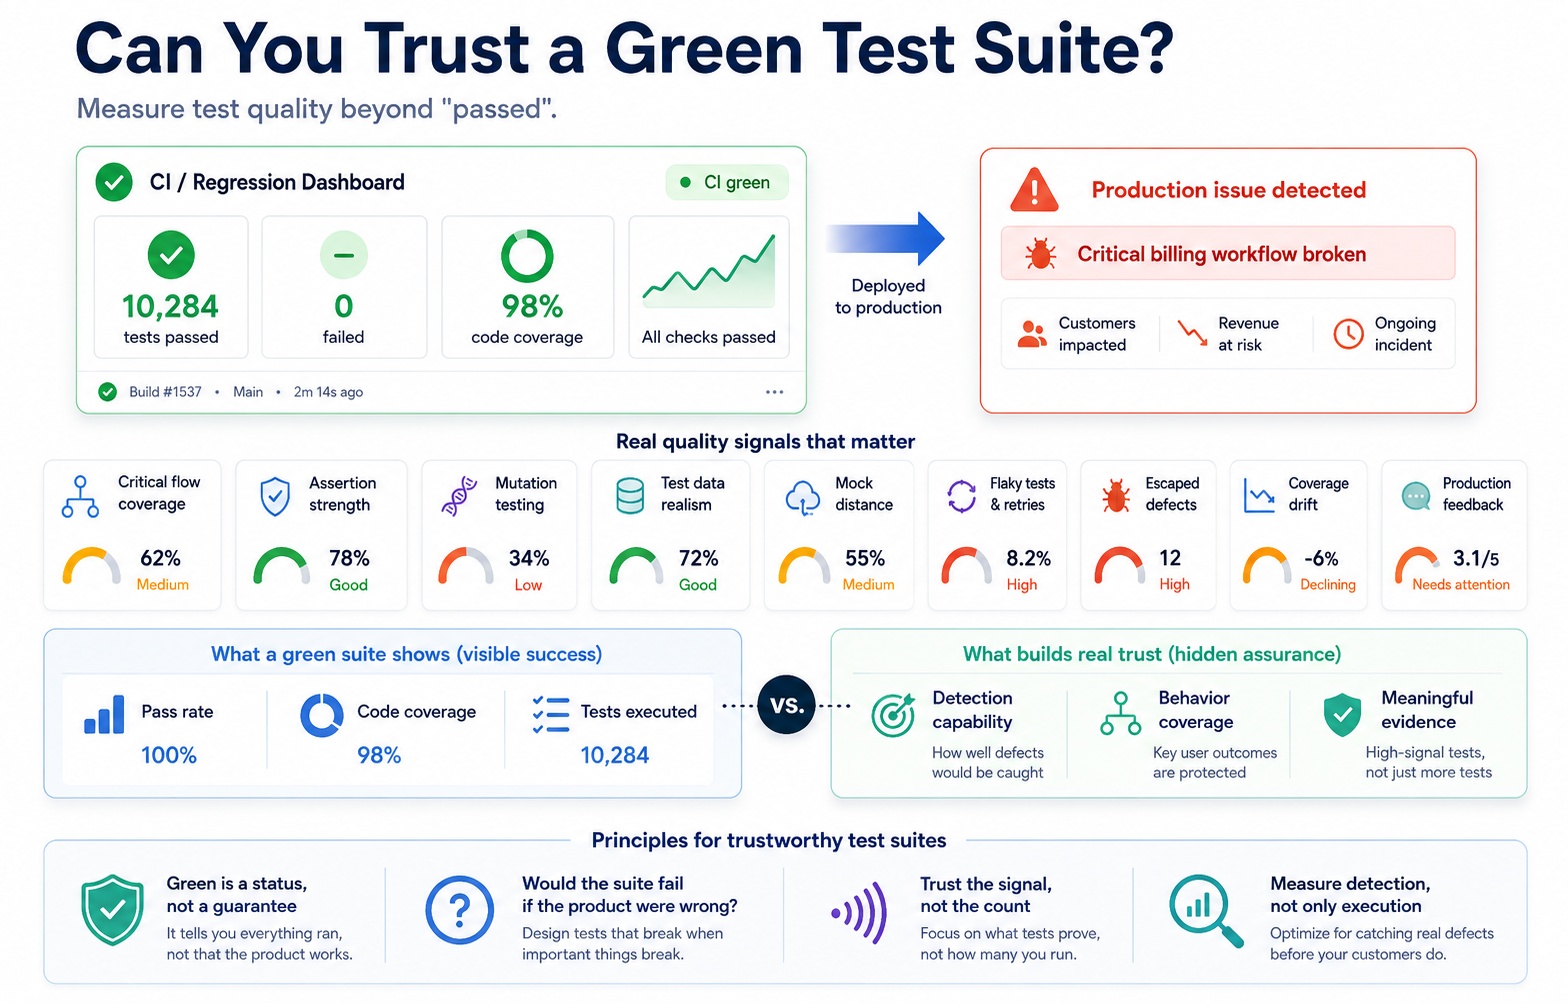
The pipeline finished at 4:12 p.m. on a Thursday.
10,284 tests
10,284 passed
0 failed
Coverage: 98.3%
All required checks: green
Nobody looked twice. This is what a healthy release is supposed to look like. The build had gone through unit tests, integration tests, an end-to-end regression pass, and a code coverage gate that had been quietly ratcheting upward for two years. The release manager approved the deploy. The deploy succeeded. The on-call engineer closed her laptop.
By Friday morning, support tickets were piling up from a specific, identifiable, and entirely legitimate group of customers: accounts on annual billing, carrying an existing promotional credit, who had added seats mid-cycle. Their renewal invoices were wrong — not catastrophically, not obviously, but wrong in a way that would eventually show up as a very uncomfortable finance conversation. The fix took an afternoon. The apology emails took longer. And the retrospective opened with the question every engineering leader eventually has to sit with:
The suite was green. Why didn't it object?
That question is the subject of this article. Not "what was the bug" — the bug, as billing bugs go, was mundane. The real question is what a passing test suite had actually been claiming, and why ten thousand-plus satisfied assertions had nothing to say about a scenario that, in hindsight, was neither rare nor exotic. It was just never looked at.
We are going to treat this the way a safety engineer treats an incident: not as a morality play about a careless team, but as a forensic exercise in figuring out exactly where the evidence broke down. Call it a Green Suite Autopsy — an analytical framing introduced in this article, not an established industry term. The idea is simple: when software fails despite passing tests, the test system itself has left evidence behind. Coverage reports, assertion logic, mock configuration, retry logs, git blame on old test files — all of it tells a story about why the alarm didn't sound. Reading that evidence is usually more informative than reading the bug report.
Nothing in what follows should be read as an indictment of the team in the scenario above. They were not careless. Their coverage was high. Their CI was disciplined. That is precisely what makes the incident worth examining: all of the visible signals of a healthy test suite were present, and the suite still had a blind spot large enough to reach production. If competent, diligent engineering can produce this outcome, then the dashboard itself — pass rate, coverage percentage, test count — was never a reliable proxy for the thing everyone actually cared about.
So before going further, it's worth asking plainly: what did that green dashboard actually prove?
Execution Status vs. Detection Capability
A pass/fail dashboard measures one thing: what happened during a specific execution of a specific set of tests, against a specific version of the code, under specific conditions. It is a report on an event that already occurred.
Test quality asks a fundamentally different, and much harder, question:
If something important were wrong right now, how likely is this suite to notice?
The first question is retrospective and mechanical. The second is predictive and evidential. A suite can score perfectly on the first question — every test that ran, passed — while scoring poorly on the second, because the tests that would have caught the actual problem never ran at all, or ran in a form too weak to notice it.
This distinction — execution status versus detection capability — is the spine of everything that follows. Pass rate tells you the suite did not object. It does not tell you whether the suite was in a position to object in the first place. Confusing the two is not a minor semantic slip; it's the mechanism by which organizations end up surprised by their own test results, again and again, despite doing everything that a green dashboard is supposed to reward.
[Visual concept: A split-screen graphic — left side shows a clean green CI dashboard with "10,284 / 10,284 passed"; right side shows a production incident timeline starting minutes after deploy. A dotted line connects them labeled "no signal in between."]
Part I: A Green Test Is a Very Small Claim
Before diagnosing why a suite missed something, it helps to be precise about what any individual passing test actually establishes — because the habit of treating "test passed" as a proxy for "behavior is correct" is where most of the overconfidence starts.
Strip a test down to its mechanics and it does four things: it arranges some state, performs an action, observes an outcome, and compares that outcome against an expectation encoded by whoever wrote the test. If the comparison holds, the test passes. That's the entire transaction.
What we now know, with certainty, is narrow: the observed value satisfied that particular expectation, under that particular setup, at that particular moment. That's all. We do not automatically know that the workflow is correct across every meaningful state it can be in. We don't know that other, unobserved effects of the action were correct. We don't know that other classes of users are unaffected. We don't know that broader business invariants — the kind of cross-cutting rule like "a customer is never charged twice for the same billing period" — still hold. We don't know that real dependencies would have behaved the way the test's stand-ins did. And we don't know that production data, with its history and mess and edge conditions, would have produced the same result as the tidy fixture the test constructed.
None of this means the test is worthless. It means the test's claim has a scope, and the scope is almost always much smaller than the sentence people use to describe it in standup.
The Scope of the Claim
Call this the scope of the claim — terminology introduced for this article, describing the precise boundary of what a given test's pass result actually certifies.
Consider two tests that might both appear, indistinguishably, as a single green checkmark in a CI report:
Test A: "Checkout button is visible on the product page."
Test B: "An eligible, authenticated customer can complete a purchase; the correct amount is charged exactly once; inventory decrements accordingly; the order persists in the database; and a confirmation is generated and delivered."
Both are legitimate tests. Both can pass. Both will show up as one line of green in a dashboard that aggregates by count, not by weight. But their evidential value is not remotely comparable. Test A tells you a UI element rendered. Test B, if it genuinely checks all the things it claims to check, tells you an entire business-critical workflow held together end to end, including a financial transaction, an inventory system, a persistence layer, and a notification pipeline.
A dashboard that reports "10,284 passed" is silently averaging together thousands of claims like Test A and a comparatively small number of claims like Test B, and presenting the sum as a single undifferentiated signal of health. This is not a criticism of counting tests — counting is easy, and easy things get reported. It's a reminder that the count is an activity metric, not a confidence metric, and the two diverge more than most dashboards let on.
The scope of the claim also explains why "we have a test for that" is such a treacherous sentence in an incident retrospective. It is almost always true in some narrow sense and almost always misleading in the sense the listener assumes. A test can exist for a workflow, execute the workflow's code, pass consistently, and still make a claim far smaller than the one implied by the existence of the test. Auditing a suite, as this article will argue at length, means going back and re-reading each test's actual claim — not the claim its filename or ticket reference suggests, but the claim its assertions literally encode.
That reframing sets up the first and most obvious autopsy question for the billing incident, and for any green-suite failure: was the behavior that broke ever tested at all — and if a test existed nearby, what, precisely, was its claim?
Part II: The First Autopsy Question — Did We Test the Thing That Broke?
The most intuitive explanation for a green suite missing a real defect is also the most common: the specific behavior that broke was simply never exercised by any test. This sounds like a coverage problem, and it is — but "coverage" turns out to be a much less unified concept than the single number on most dashboards implies.
At minimum, a serious conversation about coverage has to distinguish several different things that all get called "coverage":
- Code coverage — which lines, branches, or paths were executed during testing.
- Requirement coverage — which documented requirements have at least one associated test.
- Workflow coverage — which end-to-end user journeys are exercised, as opposed to isolated functions.
- Business-rule coverage — which specific rules (pricing logic, eligibility conditions, compliance constraints) are verified, independent of which code path implements them.
- State coverage — which combinations of account, data, or system state are represented in test setup.
- Integration coverage — which real or realistic interactions between services and third parties are verified, as opposed to isolated units.
- Risk coverage — whether the highest-impact failure modes, specifically, have protection, regardless of how much of the codebase in general is covered.
A team can be strong on one axis and weak on another without anyone noticing, because only one of these — code coverage — is usually visible on a dashboard. Code coverage is genuinely useful: it tells you, unambiguously, which lines of code were never executed by any test, and unexecuted code is code about which the suite can say nothing at all. But a line being executed is a much weaker claim than most people assume. Execution proves the line ran. It does not prove the result of running that line was meaningfully checked.
This gap is easiest to see with a concrete, and deliberately mundane, example. Imagine a test that exercises a pricing calculation:
POST /api/subscriptions/renew
{ accountId: "acct_1841", planId: "annual_pro", seats: 12 }

assert response.status == 200
The coverage tool will mark every line inside the pricing engine as covered — the branch that applies annual discounts, the branch that prorates seat additions, the branch that applies promotional credit, all of it, because the request passed through all of it on its way to producing a response. The dashboard will show green and will show the pricing module fully exercised. But the test asserts exactly one thing: that the endpoint returned a 200. It says nothing about whether the renewal amount was correct. The pricing logic could return an arbitrary, wrong number and this test would still pass, because "not an error" and "correct" are entirely different claims, and only one of them was checked.
This is not a hypothetical weakness invented for the article — it is close to the literal mechanism behind the opening incident. Code coverage on the pricing module was excellent. The tests that exercised it asserted the presence of a successful response and the existence of an invoice object, not the correctness of the number on that invoice. Coverage tooling has no way to know the difference between "this line ran" and "this line's output was actually verified" — that distinction lives entirely in the assertion, which coverage tools don't inspect.
Which raises the natural next question: if code coverage can be high while the check itself is nearly meaningless, how much should a team actually trust a coverage percentage — and what, precisely, is it trustworthy evidence of?
Part III: The Coverage Mirage
Give this pattern a name: the Coverage Mirage — again, an analytical framing introduced in this article, not an industry-standard term. The Coverage Mirage occurs when a single, highly visible coverage metric generates more organizational confidence than the underlying tests actually justify. It is not that the metric is fake. It's that the metric answers a narrower question than the one people mentally substitute for it.
It helps to be specific about what different coverage measurements can and cannot indicate:
Statement (line) coverage tells you whether a given line of code executed at least once during the test run. It is the most common form of coverage and the cheapest to compute, and it will not tell you whether a condition inside that line was tested in more than one direction, or whether the result the line produced was checked at all.
Branch coverage improves on statement coverage by tracking whether each conditional branch — the true and false paths of an if, for instance — was exercised. It catches a category of gap that statement coverage misses: a compound condition like isSquare(shape) || (isBlue(shape) && !isCircle(shape)) can show as fully "covered" by statement coverage while only ever being tested with isSquare(shape) true, leaving the rest of the boolean logic unverified. Google's internal engineering guidance on testing has made a version of this same point: coverage tools have blind spots that only a technique like mutation testing — introduced in Part V — can help expose, because the coverage tool itself cannot see whether an assertion was strong enough to catch a wrong answer.
Function coverage indicates whether each function was invoked at least once. It's a coarse signal, useful mainly for finding entire chunks of dead or untested code, but it says nothing about the paths inside those functions.
Path coverage — every distinct route through a piece of logic — is the theoretically complete version of structural coverage. It is also usually impractical to fully achieve outside of small, low-complexity units, because the number of paths through real code grows combinatorially with each added condition.
None of these measurements can see into the assertion. That is the structural limit shared by every flavor of code coverage: they describe what executed, not what was checked, and the difference between the two is exactly where the Coverage Mirage lives.
This article will not recommend a universal coverage threshold, and readers should be skeptical of any source that does. It's common to see numbers like "60% acceptable, 75% commendable, 90% exemplary" cited as informal internal guidance from large engineering organizations, and numbers in that range show up frequently across industry commentary — but treating any specific percentage as a target, rather than as one input into a broader judgment, invites exactly the failure mode this article is describing. Eighty percent of a codebase's critical behavior — the logic that governs money, access, and data integrity — protected by meaningful tests can represent dramatically more real confidence than ninety-eight percent of a codebase covered largely by getters, setters, and low-risk utility functions. Coverage percentage has no way to express which eighteen percent got left out, and in most systems, risk is not evenly distributed across lines of code. A handful of modules — pricing, authentication, permissions, data export — typically carry a disproportionate share of the business's actual exposure, and a global percentage flattens that distribution into invisibility.
The inverse case matters just as much and gets less attention: low coverage concentrated specifically in a critical module is a legitimate, urgent warning sign, even if the organization's overall coverage number looks respectable. A team should treat "our payments module sits at 40% coverage while the codebase averages 85%" as a much louder alarm than "our overall coverage dropped from 85% to 83%." The aggregate number smooths over exactly the information a risk-aware team needs to see.
None of this is an argument against measuring coverage. It's an argument against treating coverage as a finish line. Coverage is diagnostic — it tells a team where tests definitely do not exist, which is genuinely valuable information. It is far weaker as a certificate of quality for the code that coverage tools mark as "covered," because coverage cannot distinguish a rigorous check from a rubber stamp. That distinction lives one layer down, in the strength of the assertion itself.
[Visual concept: A foggy, mirage-like illustration of a coverage percentage (e.g., "98.3%") shimmering above a landscape, with a few small, sharp, uncovered "oasis" areas visible through gaps in the haze — each labeled with a critical business function like "pricing," "auth," "permissions."]
Part IV: The Assertion Gap
If coverage tells us a line ran, the assertion is what tells us whether anything meaningful was checked once it did. And assertions themselves vary enormously in strength — a variation that almost never shows up anywhere on a dashboard, because pass/fail reporting treats a trivial assertion and a rigorous one identically. Both produce the same green checkmark.
Assertion Strength Spectrum
This article introduces a working model for thinking about that variation, called the Assertion Strength Spectrum — terminology specific to this piece, not a formal or standardized taxonomy. It is a way of describing, roughly in order of increasing evidential weight, the different kinds of claims an assertion can make:
Presence assertion. The weakest form: does something exist, render, or return without erroring? "The success message is visible." "The response status is 200." These assertions catch total failures — crashes, missing elements, dead endpoints — but say nothing about correctness.
Structural assertion. Does the shape of the output match expectations? "The response is a JSON object containing an invoice field." This confirms the contract's shape without confirming the values inside it are right.
Value assertion. Does a specific field contain the specific, correct value for this scenario? "The API returned renewalAmount: 1,428.00, matching the expected calculation for this account." This is where correctness, as opposed to mere existence, starts to be verified.
State assertion. Did the system's persisted state change the way it should have? "The database record for this subscription now shows status: active, seats: 12, nextRenewal: 2027-01-15." This checks durable effects, not just the immediate response.
Cross-system assertion. Do the effects hold consistently across systems that are supposed to agree with each other? "The downstream billing ledger entry matches the amount shown on the invoice returned by the subscription API." This catches the class of bug where two systems each individually "work" but disagree with each other.
Business-invariant assertion. Does a rule that must always hold — regardless of the specific scenario — remain true across the combined state of multiple related entities? "Across the account, subscription, and invoice records, the sum of prorated charges never exceeds the annual contract value, and no credit is applied twice." This is the strongest and most expensive form: it verifies a rule about the relationship between pieces of state, not just the state itself.
None of this implies every test should reach for the top of the spectrum. A component test whose entire purpose is confirming a button renders under a given prop value has no need for a business-invariant assertion — a presence assertion is the correct tool for that job, and reaching further would just make the test slower and more brittle without adding real information. The failure mode isn't using weak assertions; it's using only weak assertions on tests whose names, tickets, or position in the suite imply they're verifying something much stronger.
This is precisely the gap that surfaced in the opening incident. Multiple billing tests existed, genuinely exercised the renewal code path, and consistently passed. Their assertions, however, sat near the bottom of the spectrum: they checked that an invoice object was generated, not that its amount was correct, and not that it remained consistent with the promotional-credit ledger elsewhere in the system. The suite had structural and presence-level assertions standing in for value-level and cross-system-level claims. Nothing about the pass/fail output could have revealed that substitution — a green checkmark carries no metadata about which rung of the spectrum it actually verified.
| Assertion level | Example claim | What it can catch | What it typically misses |
|---|---|---|---|
| Presence | "Success message is visible" | Crashes, total failures, broken rendering | Wrong values, incorrect logic |
| Structural | "Response contains an invoice object" |
Missing or malformed fields, broken contracts | Incorrect values inside correct structure |
| Value | "renewalAmount equals 1,428.00" |
Calculation errors, wrong business logic | Effects outside this one field or call |
| State | "Database record shows correct persisted status" | Silent failures to persist, partial writes | Cross-system inconsistency |
| Cross-system | "Billing ledger matches invoice amount" | Disagreement between services that individually appear correct | Invariants spanning more than two systems |
| Business-invariant | "Credit is never applied twice across account, subscription, invoice" | Systemic rule violations invisible to any single-system check | Rare states not represented in test data (see Part VII) |
The obvious next question — one this article treats as its most important — is what would actually make a test fail if the underlying code were wrong. Passing consistently and detecting defects are not the same property, and the gap between them is measurable.
Part V: Would the Test Fail If the Code Were Wrong?
This is the question the rest of the article circles back to, because it's the one that actually separates a test suite that provides evidence from a test suite that provides comfort: can this test actually detect a defect, or does it merely execute without complaint?
Most teams have no direct way to answer this. Code coverage can't answer it — it only shows execution, not detection. Pass rate can't answer it — a suite with no meaningful assertions passes just as consistently as a rigorous one. The one technique built specifically to answer this question is mutation testing, and it's worth explaining carefully, because it is more concrete, more mechanical, and more immediately actionable than most of the conceptual tools in this article.
How mutation testing works
A mutation-testing tool takes a codebase and deliberately introduces small, controlled, syntactic changes to it — one change at a time, each producing a slightly different version of the program called a "mutant." At a conceptual level, common mutation operators include things like flipping a comparison operator (>= becomes <=), negating a boolean condition, removing a statement entirely, or replacing a return value with a fixed constant. Each of these is a tiny, mechanically generated simulation of the kind of subtle logic error a human developer might actually introduce — which is a large part of why the technique is useful: the faults it simulates resemble real bugs, not adversarial edge cases.
Once a mutant exists, the existing test suite runs against it. Two outcomes are possible. If at least one test fails when run against the mutant, the mutant is killed — meaning some test in the suite was sensitive enough to notice the code had changed in a meaningful way. If every test in the suite still passes against the mutated code, the mutant survives — meaning nothing in the suite would have noticed if that exact bug had been introduced for real. The proportion of killed mutants, generally expressed as killed divided by the total number of valid, non-equivalent mutants, is the mutation score.
Two widely used implementations illustrate how this plays out in practice: PIT (also written PITest) mutates compiled Java bytecode and integrates directly into Maven and Gradle builds alongside JUnit, while the Stryker family covers JavaScript, TypeScript, C#, and Scala. Both operate as an extra step layered on top of the existing test suite — they don't replace unit tests, they interrogate them.
A surviving mutant is diagnostically useful in a very specific way: it tells you precisely where the suite's detection capability has a gap, and often why. A mutant that survives because a comparison operator was flipped and nothing failed usually means one of a few things: a scenario that would exercise that boundary condition was never written; an assertion exists but only checks a presence- or structural-level claim, not the value that the flipped operator would have changed; or the logic in question sits behind a code path the suite genuinely never reaches, which coverage tooling should also have flagged, but sometimes doesn't if the reaching test asserts nothing about the outcome.
What mutation score is not
A mutation score is not a certificate of correctness, and 100% is neither a realistic nor, in most codebases, a meaningful target. The clearest reason is the existence of equivalent mutants: mutations that change the code's literal text but produce identical observable behavior for every possible input, meaning no test — no matter how well written — could ever kill them. A commonly cited illustration involves a mutated comparison where, due to specific properties of the values involved (for instance, an exponentiation that always evaluates to 1 regardless of whether the operator is >=, <=, <, or >), the mutant is behaviorally indistinguishable from the original. Stryker's own documentation is candid that there is currently no fully reliable automated way to detect and exclude these, which means a mutation score below 100% is not a defect in the suite — some portion of "surviving" mutants may simply be unkillable by construction, and treating anything less than a perfect score as a failing grade misunderstands what the metric is measuring.
There are other real limitations worth naming plainly. Mutation testing is computationally expensive: because the entire relevant portion of the test suite has to run against every mutant, and a codebase can generate many mutants per function, the technique does not scale cheaply to full-repository, every-commit execution the way a coverage report does — a suite that takes thirty seconds to run once can take hours to run against a thousand generated mutants. Tool support and mutation operators differ by language and ecosystem, meaning the technique is more mature in some stacks than others. And mutation testing inherits the same interpretive judgment as coverage: a high mutation score in a low-risk utility module is less valuable than a moderate mutation score in the authentication or pricing layer, which is why teams that use it well tend to scope it deliberately — applying it to the highest-risk modules rather than chasing a global figure, and using threshold configuration (PIT's mutationThreshold, Stryker's high/low/break thresholds) as a targeted CI gate rather than a repository-wide mandate.
Detection Sensitivity
This leads to a more general concept worth naming even outside the specific mechanics of mutation testing: Detection Sensitivity — an article framing for the underlying question mutation testing is one technique for estimating. Detection Sensitivity asks: how sensitive is this portion of the test suite to a meaningful behavioral change in the code it covers? A suite can have high code coverage and low detection sensitivity simultaneously — coverage says the code ran; sensitivity asks whether the suite would notice if that code quietly started doing the wrong thing.
Mutation testing is the most rigorous available technique for estimating Detection Sensitivity, because it doesn't ask a human to imagine what could go wrong — it mechanically introduces changes and observes, empirically, whether the suite notices. But it is not the only technique, and later sections of this article — particularly defect replay in Part XVII and controlled fault-seeding in Part XXVI — describe complementary, less exhaustive ways of asking the same underlying question on code where full mutation analysis isn't practical.
Applied retroactively to the opening incident, the diagnostic value of this idea is direct. Had the pricing module's tests been subjected to mutation testing, a mutant that altered the promotional-credit calculation, or removed the seat-proration branch, would very likely have survived — because the existing assertions checked for the existence of an invoice, not the correctness of its amount. A surviving mutant there would have been a mechanical, automated, pre-production version of exactly the signal that support tickets eventually provided, weeks earlier and at a fraction of the cost.
Part VI: The Happy-Path Comfort Zone
Coverage gaps and weak assertions explain part of the picture, but they don't explain why certain areas systematically accumulate weak protection while others don't. The pattern is rarely random. Automated coverage tends to concentrate around scenarios that are common, stable, cheap to set up, and easy to assert on — and tends to thin out precisely where defects like the opening incident actually hide: at the intersection of unusual-but-legitimate conditions.
There's a structural reason for this, and it isn't laziness. A test for a new account on monthly billing with no discounts and no existing history is fast to write, fast to run, and rarely breaks for reasons unrelated to the thing being tested — which makes it a satisfying, low-friction test to add. A test for an annual account, mid-cycle seat addition, with an existing promotional credit requires constructing a much more elaborate fixture, understanding several interacting business rules, and accepting that the test might be more fragile to unrelated changes. Given equal time pressure, engineers gravitate toward the tests that are pleasant to write. Over months and years, this produces a suite whose shape mirrors ease of construction rather than actual product risk.
Meanwhile, real defects — in billing systems, permission systems, and most transactional software — disproportionately hide in combinations: existing account state, plus an unusual role or plan, plus a boundary value, plus an integration condition that only shows up under specific timing. Individually, each of those factors might be well tested. It's the combination that's rare in the test suite and common enough in the customer base to matter.
Worth naming specifically, because each tends to be under-represented for the same "hard to construct" reason:
- Boundary values — the first and last unit of a range, the moment a threshold is crossed, the exact point where proration math changes behavior.
- State transitions — not just "an account in state X," but the transition from one state to another, which is where race conditions and partial-update bugs live.
- Role and permission combinations — behavior under the cross product of role, plan tier, and feature flag, rather than a single canonical role.
- Error and partial-failure paths — what happens when a downstream call times out, returns a partial result, or fails after some side effects have already committed.
- Historical defect patterns — areas that have broken before and are statistically more likely to break again, which is exactly the kind of institutional memory that a defect-replay practice (Part XVII) is built to preserve.
None of this is an argument that edge cases are inherently more important than common ones — a defect in the primary signup flow that every customer touches can be more damaging than an obscure edge case that affects a handful of accounts, and a mature test strategy invests heavily in the happy path precisely because so much revenue and trust flows through it. The point is narrower and more useful: a suite's distribution of scenario coverage should roughly track the product's actual distribution of risk, and left to its own devices, a suite tends instead to track ease of test construction. The question worth asking periodically isn't "do we have enough tests" — it's "does the shape of our test suite resemble the shape of our risk, or the shape of what was easy to automate?"
Part VII: The Test Data Illusion
A test can target exactly the right scenario, use a strong assertion, and still produce a misleading result — because the data feeding it doesn't resemble anything that exists in production. Scenario logic and test data realism are separate failure modes, and it's entirely possible to get the first right while getting the second badly wrong.
The pattern shows up in a recognizable set of habits: every test customer is newly created; every test database is small and clean; every subscription is in a tidy, uncomplicated state; every timestamp is recent; every string is plain ASCII; every external service, when mocked, returns the ideal response; every user has a simple, single-role permission structure.
Production looks nothing like this. Real systems accumulate historical migrations that leave behind records shaped by rules that no longer exist. Real accounts carry partial states — a plan change that started but didn't fully propagate, a credit applied under a promotion that has since been retired. Real customers operate in multiple currencies, at scale, with permission structures that were modified piecemeal over years by different administrators. Real timestamps span time zones and daylight-saving transitions. Real text fields contain names, addresses, and notes in dozens of languages and character sets. None of this is exotic — it's simply what happens to any dataset that has been touched by real usage over real time, and it is almost never what a freshly seeded test fixture looks like.
Data Realism Gap
Call the distance between these two worlds the Data Realism Gap — an article framework describing the space between the states a test suite actually exercises and the states that matter in production. A wide Data Realism Gap means a suite can be logically well-designed and still be blind to an entire category of defect, simply because the data used to drive it never resembled the conditions under which the defect occurs.
This is, again, close to the literal mechanism in the opening incident. The scenario logic for annual billing existed. The scenario logic for promotional credits existed. What didn't exist was a test that combined them using data resembling an actual customer who had accumulated both — because the fixtures used across the suite defaulted to clean, new accounts, and the mocked credit service, discussed further in Part VIII, always returned zero regardless of what the test was trying to represent.
Closing a Data Realism Gap does not mean copying production data into test environments. That approach introduces its own serious problems — customer privacy exposure, regulatory risk under frameworks like GDPR or CCPA, and security exposure from handling real payment or personal data outside of production's access controls. The more durable approach is building representative synthetic data: fixtures and generators deliberately modeled on the shapes of real production states — accounts with layered promotional history, subscriptions mid-transition, multi-currency records, legacy permission structures — without containing any actual customer information. This typically means treating test data design as a first-class engineering artifact rather than an afterthought: maintaining a library of realistic account archetypes, generating edge-case combinations deliberately rather than accidentally, and periodically reviewing production incident patterns (see Part XVII) specifically to identify which archetypes are still missing from the fixture library.
[Visual concept: Two overlapping circles labeled "States exercised in testing" and "States that matter in production," with a visibly small overlap region and a labeled gap — "Data Realism Gap" — occupying the larger non-overlapping portion of the production circle.]
Part VIII: When Mocks Make a Broken System Look Healthy
Mocks and test doubles are not the villain of this article, and treating them as one would be both wrong and unhelpful. They exist because they solve real problems: they make tests fast by avoiding real network calls, they make tests isolated by removing dependencies whose own failures shouldn't fail an unrelated test, they make tests deterministic by avoiding external systems whose behavior can vary run to run, and they let a team simulate failure conditions — timeouts, malformed responses, rate limits — that would be difficult or irresponsible to trigger against a real dependency on demand.
The risk isn't using mocks. It's the gradual, usually invisible drift between what a mock was originally built to represent and what the real dependency actually does. Over-mocking, specifically, can shift a test's real function without anyone deciding that should happen: instead of validating what an external or internal component actually does, the test starts validating what the developer, at the time the mock was written, believed the component would do. Those are different claims, and the gap between them tends to widen silently as the real dependency evolves and the mock does not.
Concrete versions of this drift are common and rarely dramatic in isolation: a payment provider changes its error response format and the mock still returns the old shape; a downstream service's timeout behavior changes under load in ways the mock never simulated; a field that used to always be present becomes nullable in a new API version, and the mock never learned that; an external service silently begins enforcing a business rule — a rate limit, a validation constraint — that the mock never implemented because it didn't exist when the mock was written.
In the opening incident, this pattern appeared directly: the mocked promotional-credit service had been configured, at some point, to always return zero — plausibly because at the time it was written, the scenarios under test genuinely had no credit to apply, and nobody revisited that default as new scenarios were added around it. Every test that depended on that mock inherited an assumption — "this account has no promotional credit" — baked silently into its foundation, regardless of what the test's name or intent claimed to represent.
Mock Distance
Name this Mock Distance — an article term describing how far a test double's behavior has drifted from the real dependency it's meant to represent. Mock Distance is not something this article claims can be reduced to a single precise number; it's a qualitative judgment that grows more urgent the longer a mock goes unreviewed against the real system it stands in for, and the more business logic (rather than pure infrastructure, like a database driver) that mock is responsible for simulating.
The standard mitigations are well established and worth naming precisely because they solve different parts of the problem rather than one shared problem:
Contract testing verifies that a mock's assumed interface — request and response shapes, error formats, status codes — actually matches what the real dependency provides, typically by running the same test expectations against both the mock and a controlled instance of the real service, or by validating both sides against a shared, versioned contract definition.
Integration tests, run against real or realistic instances of a dependency rather than a mock, exist specifically to catch the class of bug that unit tests relying on mocks structurally cannot — genuine behavioral divergence between what was assumed and what actually happens.
Sandbox environments and service virtualization, offered by many external providers (payment processors and identity providers are common examples), give teams something closer to the real dependency's actual behavior without the cost or risk of hitting production systems during test runs.
None of these fully eliminates Mock Distance — a sandbox can itself drift from production behavior, and a contract test only catches divergence in the parts of the contract it was written to check. The realistic goal is not zero Mock Distance; it's known Mock Distance, reviewed periodically, rather than an assumption quietly aging out of accuracy inside a fixture nobody has opened in two years.
Part IX: The Flaky Green Suite
There's a more uncomfortable variant of "the suite was green": sometimes it's green because a failure occurred and was quietly retried into a passing result, not because nothing went wrong.
Retries are a legitimate and useful mechanism. Distributed systems have genuine, non-deterministic sources of transient failure — a network blip, a momentarily slow dependency, a resource contention issue under parallel test execution — and a single automatic retry can be the difference between a meaningful signal and noise generated by the test infrastructure itself, not the code under test. Used deliberately, retries help a team distinguish a stable failure (the code is genuinely wrong; it fails every time) from an intermittent failure (something about the execution environment is unreliable, independent of correctness).
The trouble starts when a team stops looking at the distinction and simply reports "fail, then retry, then pass" as equivalent to "pass." Both outcomes land in the same dashboard cell — green — but they carry very different information. A test that passes on the first attempt, every time, is telling you something calm and simple. A test that fails, gets retried, and then passes is telling you something worth investigating: either the environment is unreliable in a way that could eventually mask a real defect, or the test itself has a race condition or timing assumption that happens to resolve most of the time. Collapsing both into "green" discards exactly the information that would let a team tell the difference.
A handful of metrics exist specifically to preserve this distinction rather than average it away:
- First-attempt pass rate — the percentage of test runs that pass without any retry, as distinct from the percentage that eventually pass after one or more retries.
- Retry recovery rate — of the tests that failed on a first attempt, what percentage passed on retry, which is itself informative: a high recovery rate concentrated in a small number of tests points to a localized, fixable instability rather than broad environmental noise.
- Flaky-test rate — the proportion of tests exhibiting non-deterministic pass/fail behavior across repeated runs of the same code, independent of any actual code change.
- Repeat-offender tests — the small subset of tests, common in most suites of any size, responsible for a disproportionate share of all flaky failures. Industrial research on flaky tests has found that flakiness is often clustered rather than evenly distributed — failures sharing a common root cause tend to co-occur across multiple tests at the same time, which means fixing one systemic cause (a shared timing assumption, a shared resource contention pattern) can resolve a cluster of "unrelated-looking" flaky tests at once rather than requiring one fix per test.
First-Pass Integrity
This article's term for the underlying signal worth protecting is First-Pass Integrity: how much of the suite passes without needing retries, reruns, or manual intervention. A suite can have a headline pass rate of 100% and a First-Pass Integrity considerably lower than that, if a meaningful share of that 100% only arrived there after silent retries. First-Pass Integrity is not a call to disable retries — that would trade a masked signal for a noisy one, since some genuine environmental flakiness is real and shouldn't fail a build outright. It's a call for visibility: retries should be logged, tracked, and periodically reviewed as their own category of evidence, not folded invisibly into a single pass/fail bit that erases the distinction between "worked cleanly" and "worked eventually."
The opening incident carried a smaller version of this pattern too. One of the end-to-end tests exercising the renewal flow experienced an intermittent failure during the release in question — timing-related, unrelated on its face to the pricing defect — and was automatically retried into a pass. Nobody reviewed why it had failed on the first attempt, because the dashboard's only visible artifact was the final green result. That retry wasn't the cause of the incident. But it's a reminder that a suite's relationship with its own instability shapes how much attention any single result receives — which leads directly into a broader, more human question about what happens once a team stops fully believing its own test signal.
Part X: A Test That Nobody Trusts Is Already Partly Broken
Flakiness has a cost beyond the immediate noise of a rerun: it erodes the thing that gives a test result its value in the first place, which is that engineers treat a failure as meaningful evidence worth investigating.
The behavioral symptoms tend to follow a familiar progression, and most engineering organizations of reasonable size will recognize at least some of them: pipelines get rerun automatically, without discussion, the moment they fail. Certain known-flaky failures become background noise that experienced engineers learn to mentally filter out. Tests get quarantined — moved out of the required-to-pass path — with the stated intention of "fixing them later," and later rarely arrives. Failure notifications get muted, because the volume of false alarms made them more disruptive than useful. Investigation of a red build gets delayed, because the prior's-day failure "was probably just flaky."
Signal Trust
Call the underlying property Signal Trust — not a metric with a formula, but a description of whether engineers, in practice, treat a given test's failure as meaningful evidence that something is actually wrong. Signal Trust is earned or lost gradually, through a track record: a test that has a history of failing only when something was genuinely broken earns trust; a test with a history of failing for unrelated, unresolved reasons loses it, even if its actual detection logic is sound.
The consequence of eroded Signal Trust is not abstract. Automation has essentially no operational value if the organization has stopped believing its output — a red build that nobody investigates provides identical practical protection to no test at all, while consuming exactly as much compute and maintenance effort as a build that people actually respond to. This is a genuinely dangerous failure mode precisely because it's invisible on a dashboard: the test still exists, still runs, still technically "covers" the behavior in question. Its coverage has simply stopped functioning as an alarm, because the humans on the other end of that alarm have learned, through repeated false positives, not to respond to it.
The connection back to flakiness, environmental instability, and weak diagnostics is direct. A flaky test degrades Signal Trust for itself and, over time, for the suite as a whole, because the cost of investigating each individual failure to determine "real bug or noise" accumulates until skipping that investigation becomes the path of least resistance. Poor diagnostics compound this: a test that fails with a clear, specific message about what invariant broke is much easier to trust on sight than one that fails with a generic timeout or a stack trace three layers removed from the actual assertion. Investing in Signal Trust, in practice, means investing in exactly those unglamorous things — fixing or removing chronically flaky tests rather than permanently quarantining them, and writing failure messages that tell an engineer, immediately, what was expected and what happened instead.
Part XI: The Suite May Be Testing Yesterday's Product
A suite doesn't need to be badly written to become unreliable. It can be well written for the product as it existed eighteen months ago, and simply never have caught up with what the product became.
Software evolves continuously — feature priorities shift, a workflow that used to be central gets replaced by a redesigned one, a new integration becomes load-bearing where none existed before, customer behavior migrates toward paths the product team didn't originally optimize for. Automated coverage, meanwhile, tends to be sticky. Once a test exists and passes reliably, there's rarely a forcing function that causes anyone to revisit whether it still represents something that matters. Deleting a test that's been green for two years feels risky in a way that adding a new one doesn't, even when the old test has quietly become low-information — still verifying a scenario that customers barely encounter anymore, while a newer, now-critical workflow sits with comparatively thin protection because it simply hasn't existed long enough to accumulate the same coverage.
Coverage Drift
This article's term for the resulting pattern is Coverage Drift: the gradual divergence between where test effort is concentrated and where meaningful product risk actually sits. Coverage Drift is not a failure of any single decision — it's an emergent property of a suite that adds but rarely subtracts, growing in the direction of past priorities while the product itself moves on.
A useful discipline for counteracting Coverage Drift is treating test maintenance as symmetrical: it should include not just adding new tests and strengthening weak ones, but rewriting tests that describe a workflow that no longer works the way it's described, and — deliberately, with review, as Part XXVII discusses in more depth — deleting tests that no longer carry meaningful signal about current product risk. A mature test organization is one that is willing to remove low-information automation, not because fewer tests is itself a goal, but because a suite whose shape still resembles a product from several releases ago provides a systematically misleading picture of how well the current product is protected, no matter how green its dashboard looks.
Part XII: More Tests Can Create Less Clarity
It's worth directly confronting an intuition that runs through a lot of engineering culture: that more tests are straightforwardly better, and that a growing test count is itself evidence of improving quality.
Consider two hypothetical teams. Team A maintains roughly 2,000 tests, each deliberately scoped to a specific, identified risk. Team B maintains roughly 20,000 tests, accumulated over years of "let's add a test for this too." Neither size is inherently better — a small suite can be dangerously thin, and a large one can be genuinely comprehensive. But a large suite carries costs that don't show up on a simple count, and those costs grow with size in ways worth naming directly.
Duplicate scenarios accumulate — the same underlying business logic verified by five superficially different tests at different layers, each adding maintenance burden without adding new information. Feedback loops lengthen, because a larger suite generally takes longer to run, which either slows every engineer's iteration cycle or pushes teams toward selectively skipping tests under time pressure — itself a form of silent coverage loss. Maintenance noise increases: more tests mean more tests that need updating whenever the underlying behavior legitimately changes, and a large suite makes it easy for a genuine behavior change to require touching dozens of brittle tests, none of which individually seemed brittle in isolation. Flakiness exposure scales roughly with test count, simply because more tests means more individual opportunities for an environmental or timing issue to produce a false failure. Ownership becomes unclear as a suite grows past what any one person can hold a mental model of, making it harder for anyone to say with confidence which tests still matter and which are vestigial. And, most relevant to this article's central argument, a large passing suite creates a stronger feeling of confidence than a small one, independent of whether that confidence is actually justified by the strength of what's being asserted.
Evidence Density
Name the underlying tradeoff Evidence Density — an article framework, not a formula with a defined numerator and denominator. Evidence Density asks, for a given test or group of tests: how much meaningful confidence does this provide, relative to the maintenance and execution burden it imposes? This is deliberately a decision-making concept rather than a precise metric — there is no serious way to reduce "meaningful confidence" to a single number that could be divided by "maintenance burden" to produce a comparable score across an entire suite. What Evidence Density offers instead is a framing for a conversation that otherwise defaults to "should we add more tests": before adding another test, or before resisting the deletion of an old one, ask what unique confidence it provides relative to what it costs to keep running and maintaining — and if the honest answer is "very little, beyond what three other tests already establish," that's useful information regardless of whether it converts into a number.
Part XIII: Test Count Is an Activity Metric, Not a Quality Outcome
Number of tests, number of automated cases, automation percentage, and number of executions share a common appeal: they're trivially easy to count, easy to put on a slide, and easy to show trending upward over time. They are also, individually and collectively, weak proxies for the thing an organization actually cares about, which is whether the suite catches meaningful problems before customers do.
This is a specific and well-documented failure pattern known as Goodhart's Law: when a measure becomes a target, it tends to stop being a good measure, because people — reasonably, and often without any bad intent — start optimizing for the number itself rather than for the underlying outcome the number was originally meant to represent. Applied to testing, the pattern is easy to recognize once named:
An automation target of, say, 90% of test cases automated can encourage teams to automate whatever is cheapest and easiest to automate — often low-value, low-risk scenarios — simply because that's the fastest way to move the percentage, rather than prioritizing the automation effort where it would provide the most protection.
A test count target, whether explicit or implicit through a culture that celebrates growing numbers, can encourage splitting a single meaningful scenario into several trivially different variants, inflating the count without adding proportional evidence.
A coverage target, discussed at length in Part III, can encourage writing tests that execute a line without meaningfully checking its output — technically satisfying the metric while contributing almost nothing to actual detection capability.
None of this is an argument that these metrics are useless — they're genuinely useful as contextual indicators, read alongside other signals, by people who understand their limits. A sudden, unexplained drop in automation percentage is worth asking about. A test count that's been static for a year while the product has grown substantially is worth asking about. The failure mode isn't tracking these numbers; it's making any one of them a target that compensation, promotion decisions, or team performance reviews are pinned to, because that's the specific condition under which Goodhart's Law reliably produces the gaming behavior described above. The next several sections turn to what a more resistant, multi-signal alternative looks like.
Part XIV: What Should We Measure Instead?
There is no single metric that proves test quality, and any framework that offers one — a "Quality Score," a single composite percentage — should be treated skeptically for exactly the reasons already covered: any single number can be gamed, and any single number necessarily discards information that a multi-dimensional picture would preserve. What follows is a portfolio of signal groups, not a formula. Each group answers a different question, and no group is sufficient on its own.
Group 1: Coverage of Important Behavior. This asks whether the workflows and rules that matter most to the business have deliberate, identified protection — critical-flow coverage, requirement coverage tied specifically to business-critical rules, and risk-area coverage that maps test effort against a team's own assessment of where the highest-impact failures could occur. None of this reduces to a standard formula, because it depends on a team first doing the work of defining what "critical" means for their specific product — a step Part XV develops in detail.
Group 2: Defect Detection. This covers defect detection effectiveness (how much of what could have been caught before release actually was), the count and severity distribution of pre-production defects versus escaped defects, and the shape of that severity distribution over time. A note of caution belongs here: defect counts are notoriously easy to misread. A falling count of reported defects can mean the product genuinely got better, or it can mean detection got weaker — fewer bugs are being found because fewer bugs are being looked for, not because fewer exist. Reading a defect trend in isolation, without context about whether testing effort or rigor changed at the same time, risks drawing exactly the wrong conclusion.
Group 3: Suite Stability. This covers the flaky-test rate, First-Pass Integrity (Part IX), rerun frequency, and the count and age of quarantined tests. These signals speak to Signal Trust (Part X) — whether the suite's results are, in practice, being treated as meaningful by the people who see them.
Group 4: Production Feedback. This covers escaped defects specifically as evidence about the testing system, mean time to detection, and — with real care — change failure rate as broader contextual evidence. It's worth being precise here, because this is a place where testing-specific and delivery-wide metrics are frequently and incorrectly conflated: Change Failure Rate is a DORA software-delivery metric, measuring the percentage of production changes that result in a fault, incident, or rollback, across the entire delivery pipeline — not a measurement of test-suite quality specifically. A poor change failure rate could stem from weak testing, but it could equally stem from deployment practices, insufficient monitoring, poor rollback tooling, or unrelated infrastructure instability. It provides useful contextual evidence when interpreted alongside testing-specific signals, but presenting it as a direct proxy for QA performance misattributes a system-wide outcome to one part of the system. The same caution applies to Mean Time to Detection, which more precisely describes an organization's broader observability and incident-detection practice — how quickly a problem in production is noticed at all, through any channel, monitoring included — rather than a QA-specific measurement.
Group 5: Detection Strength. This covers mutation score, where computationally feasible and scoped to genuinely critical modules, alongside historical defect replay (Part XVII) and controlled fault-seeding in test environments (Part XXVI). This is the group most directly answering the central question from Part V: not "did tests run," but "would the tests notice if something meaningful broke."
Group 6: Maintenance Health. This covers test age, the presence of unused or unreachable tests, duplicate scenario coverage, repair frequency (how often a test needs to be updated for reasons unrelated to a genuine behavior change — often itself a sign of brittleness or over-specification), execution cost, and clear ownership. A suite where nobody can say who owns a given test, or why it exists, is a suite whose Evidence Density (Part XII) is very difficult to assess at all.
| Metric group | What it answers | Key signals | Primary caveat |
|---|---|---|---|
| Coverage of Important Behavior | Are the workflows that matter protected? | Critical-flow, business-rule, risk-area coverage | Requires teams to first define "critical" |
| Defect Detection | How much did testing actually catch? | DDE, pre-production vs. escaped defects, severity mix | Falling defect counts can mean weaker detection, not a better product |
| Suite Stability | Can the results be trusted? | Flaky-test rate, First-Pass Integrity, quarantine count | Retried passes can mask instability |
| Production Feedback | What is production telling us? | Escaped defects, MTTD, change failure rate (contextual) | CFR and MTTD are delivery-wide, not QA-specific |
| Detection Strength | Would tests notice a real defect? | Mutation score, defect replay, fault seeding | No universal target score exists |
| Maintenance Health | Is the suite itself in good shape? | Test age, duplication, repair frequency, ownership | Rarely visible on a standard dashboard |
Part XV: Critical-Flow Coverage Is Different From Code Coverage
For a founder or CTO who does not work inside the automation codebase day to day, critical-flow coverage is usually the single most useful lens in this entire portfolio, precisely because it maps directly onto business impact rather than code structure.
The idea starts with an inventory. Most SaaS products have a relatively short list of workflows whose failure would cause immediate, tangible harm: signup and onboarding, authentication, checkout or upgrade flows, subscription renewal and billing, permission and access control, data export, and whatever the product's core collaborative or transactional loop is — the thing customers actually pay for. These are not equally numerous across an organization's codebase, but they are disproportionately important, because their failure modes are the ones that generate support escalations, churn, and — as in the opening incident — direct financial exposure.
For each critical flow, a useful inventory records: the business impact if it breaks (revenue, trust, compliance, data integrity), which customer segments depend on it, what internal and external dependencies it touches, which test layers currently provide protection for it, and when it was last meaningfully validated — not merely "when did a test for this last run," but when someone last confirmed the test's assertions still represent the current, correct behavior.
This article deliberately does not prescribe a mandatory global percentage — "90% of critical flows must have automated protection" invites exactly the gaming behavior described in Part XIII, where the easiest-to-automate flows get counted first regardless of actual risk. A more durable question, better suited to an executive conversation than a dashboard tile, is this: can engineering leadership name the workflows whose failure would create immediate customer or business impact, and show — specifically — how each one is currently verified? If the answer requires someone to go find out, that's itself diagnostic information, independent of what the eventual answer turns out to be.
Critical Flow Register
This article's term for the resulting artifact is a Critical Flow Register — a lightweight, living record, not a formal compliance document, containing for each identified flow: the flow itself, its business impact, its dependencies, which test layers currently protect it, its known gaps, and what production monitoring exists as a backstop if pre-production testing misses something. The value of the Register isn't the document — it's the forcing function of having to answer, in writing, whether a given critical flow's protection is something the team can actually describe, or something everyone has been quietly assuming exists.
Part XVI: Escaped Defects Need Better Questions
Counting production defects is easy and, on its own, close to useless as a quality signal — for the reason already raised in Part XIV: a falling count can reflect genuine improvement or weakening detection, and there's no way to tell which from the count alone. The more useful move is not counting escaped defects, but interrogating each meaningful one with a consistent, specific set of questions.
Escape Analysis
Call this practice Escape Analysis — an article framework for structuring the investigation of a production defect that a test suite failed to catch. For each meaningful escaped defect, the useful diagnostic questions are specific enough to actually point toward a fix, rather than general enough to produce only "we need better testing" as a conclusion:
Was there no test relevant to this behavior at all — a genuine coverage gap, as in Part II? Was a relevant test's setup wrong — data that didn't represent the real condition, as in Part VII? Was the assertion too weak to notice the defect even though the right code path was exercised, as in Part IV? Did a mock hide behavioral drift from the real dependency, as in Part VIII? Was the relevant test flaky, and did a retry mask a real failure, as in Part IX? Was the suite — or the specific test — skipped or quarantined at the time of the release? Did the production condition genuinely not exist anywhere in the test environment, making it structurally undetectable by pre-production testing regardless of suite quality? Was the underlying requirement itself misunderstood, meaning even a perfectly executed test would have verified the wrong expected behavior? Or was this a condition only detectable through production observability — load patterns, real third-party behavior, real user combinations — that no reasonable pre-production test environment could have reproduced?
| Escape category | Diagnostic question | Typical fix direction |
|---|---|---|
| Missing scenario | Was there no relevant test at all? | Add scenario-level coverage |
| Weak assertion | Did the test run the right code but check the wrong thing? | Strengthen assertion (Part IV) |
| Unrealistic data | Did the setup fail to represent the real condition? | Improve fixture realism (Part VII) |
| Mock drift | Did a test double hide real dependency behavior? | Add contract or integration tests (Part VIII) |
| Masked flakiness | Did a retry hide a real failure? | Investigate before accepting retry-passes (Part IX) |
| Suppressed signal | Was the test skipped or quarantined? | Restore or replace the test; review quarantine policy |
| Undetectable pre-production | Did the condition only exist in production? | Strengthen monitoring, not testing |
| Requirement misunderstanding | Was the expected behavior itself wrong? | Fix requirements process, then the test |
That last category matters enough to state plainly: escaped defects are evidence about the delivery system as a whole, not a scorecard for the QA function specifically. A defect that escaped because a requirement was ambiguous from the start is not a testing failure in any meaningful sense — it's a product and requirements-process finding wearing a QA costume. Escape Analysis done well routinely surfaces findings that point at product management, engineering design, or observability investment as much as it points at the test suite, and a team that only ever concludes "add more tests" from this exercise probably isn't asking the questions specifically enough.
Part XVII: Replay Production Defects Against the Test System
Escape Analysis diagnoses why a defect got through. The following practice is what turns that diagnosis into durable protection, and it is one of the most concretely actionable ideas in this article.
Defect Replay
For every meaningful escaped defect, Defect Replay — a practical framing this article uses for a specific, disciplined sequence — proceeds through six steps:
1. Reproduce it. Confirm, in a controlled environment, that the defect actually occurs under a known set of conditions — not from a description, but from direct reproduction.
2. Run the relevant existing tests. Execute whatever tests currently claim to cover the affected area, against the defective code, and observe: do they pass or fail?
3. Determine why they remained green. If they passed despite the defect being present, use the Escape Analysis categories from Part XVI to identify the specific mechanism — missing scenario, weak assertion, unrealistic data, mock drift, or one of the others.
4. Add or strengthen the smallest useful layer of protection. Not automatically a new end-to-end test — the right layer depends on where the defect actually lives, a point developed further below.
5. Verify that the new or strengthened test actually fails against the defective behavior. This step is frequently skipped, and skipping it undermines the entire exercise. A test written after a fix is already in place, and never actually run against the broken version, has not been proven to detect anything — it may pass against both the broken and the fixed code, for reasons unrelated to whether it actually checks the right thing.
6. Restore the fix and verify the test passes. Confirming that the new protection correctly distinguishes broken from fixed — not just that it passes, but that it passes for the right reason.
That fourth-through-sixth sequence — fail on bad, pass on good — is the single most reliable practical test of whether a piece of regression protection is real. A test is strongest, in a very literal and verifiable sense, when someone has actually confirmed it detects the specific defect it claims to guard against, rather than assumed it does because it happens to touch the same code.
Step four deserves elaboration, because the instinct after a customer-visible incident is often to reach immediately for an end-to-end test — understandably, since the defect was discovered end-to-end, through customer behavior. But the right layer for new protection depends on where the defect actually originates, not on where it was observed. A pricing calculation error, like the one in the opening incident, is usually best caught by a fast, targeted unit or component test asserting the correct value directly against the calculation logic — not by a slow, expensive end-to-end test that happens to touch that logic on its way to a broader assertion. An integration mismatch is best caught by a contract test verifying the specific interface assumption that drifted. A genuinely cross-system business-invariant violation may require a test at the integration or E2E layer, because no single-layer test can see the interaction. And a condition that only manifests under real production load or real third-party behavior may not be reproducible in pre-production testing at all — in which case the right answer from Defect Replay is not "add a test" but "strengthen monitoring," a genuinely different and equally legitimate conclusion.
Not every escaped defect warrants a new end-to-end test, in other words, and treating "add an E2E test" as the default response to every incident is how suites accumulate slow, brittle, expensive tests at exactly the layer least suited to catching the underlying class of problem.
Part XVIII: Correlate Test Signals With Production Reality
A more advanced practice, useful once the basics of Escape Analysis and Defect Replay are established, involves stepping back from individual incidents and looking at patterns across the organization's full history of test results, production incidents, deployments, and defect data together.
Over time, this kind of review can surface genuinely useful patterns: which test areas correlate with a disproportionate share of escaped failures, even when their coverage numbers look fine in isolation. Which flows repeatedly generate production defects despite having heavy automated test counts — a strong candidate signal for Coverage Mirage (Part III) or weak Detection Sensitivity (Part V) specifically in that area. Which suites or test categories rarely, if ever, catch anything at all across a long observation window — a candidate for the Evidence Density conversation in Part XII, and possibly for deletion, as discussed in Part XXVII. And which specific tests tend to fail shortly before a meaningful incident occurs elsewhere in the system — sometimes an early-warning signal worth paying closer attention to, if the pattern holds up across multiple occurrences rather than one coincidence.
Signal-to-Incident Review
Call this practice a Signal-to-Incident Review — an article framework, and a genuinely important caveat belongs immediately alongside it: correlation observed across a handful of incidents, or even a few dozen, is not the same as statistical causation, and it should not be presented or treated as such. A test area correlating with escaped defects over a short observation window might reflect a real underlying weakness, or it might reflect a small sample size, a temporary team change, or an unrelated confound like a period of unusually rapid feature development in that specific area. The objective of a Signal-to-Incident Review is not perfect prediction — it is the more modest, achievable goal of learning whether testing activity, in practice, aligns with where the product actually fails, and treating any pattern that emerges as a hypothesis worth investigating further, not a conclusion to act on immediately.
Part XIX: When a Test Suite Passes Too Easily
Here's a genuinely counterintuitive idea worth sitting with directly: a test suite that almost never fails, that always passes immediately without friction, and that has never once caught a regression before a human noticed it independently, is not automatically evidence of excellent software.
It might be. A genuinely well-built, carefully maintained product with disciplined engineering practices can legitimately produce a suite that rarely finds anything wrong, simply because not much is going wrong. But the same observable pattern — a suite that never fails — is equally consistent with several less flattering explanations: assertions that are systematically too weak to notice real problems (Part IV), scenario coverage concentrated on low-risk, easy-to-automate areas (Part VI), poor change sensitivity that would show up clearly under mutation testing (Part V), or coverage that technically exists but has drifted away from what the product actually does now (Part XI).
The way to tell these apart is not to guess, and it's certainly not to treat "the suite passes too smoothly" as inherently suspicious on its own — that would be an overcorrection in the opposite direction. It's to look at the same evidence this article has already built toward: historical catch rate (has this suite, in fact, ever caught a real regression, and how long ago), mutation sensitivity (would it notice a deliberately introduced defect, tested directly rather than inferred), escaped-defect analysis (what has gotten through despite the suite being green), manual or exploratory discoveries (has a human found something the automated suite missed, and how often), and production incident history (does the suite's calm correlate with the product's actual reliability, or diverge from it).
None of this is a call to celebrate a suite that fails constantly, either — a suite that fails often, for reasons unrelated to real defects, is simply the flaky-suite problem from Part IX wearing a different framing. The goal throughout is useful discrimination: distinguishing a suite that's calm because the product is genuinely solid from a suite that's calm because it isn't actually looking very hard.
Part XX: The Confidence Signal Ladder
It's worth pulling the preceding sections together into a single structure — not a scorecard, and explicitly not a maturity model that every organization is expected to climb to the top of, but a way of understanding why "we have 10,284 passing tests" sits much closer to the beginning of a confidence conversation than to its conclusion.
This article introduces that structure as the Confidence Signal Ladder — an analytical model specific to this piece, laid out here as six levels of increasingly rigorous evidence:
Level 1 — Tests exist. The most basic claim: automated tests have been written for some portion of the system. This says nothing yet about whether they run reliably, check anything meaningful, or represent real risk.
Level 2 — Tests execute consistently. The suite runs, and produces a first-attempt pass or fail without needing retries to resolve — First-Pass Integrity, from Part IX, established as a baseline.
Level 3 — Tests assert meaningful behavior. The assertions inside those consistently executing tests sit meaningfully up the Assertion Strength Spectrum from Part IV — checking values, state, or cross-system consistency, not merely presence or structure.
Level 4 — Tests detect controlled behavioral changes. The suite has been empirically shown — through mutation testing or equivalent controlled fault-seeding — to actually notice when the underlying code changes in a meaningful way, rather than merely appearing rigorous on inspection.
Level 5 — Tests represent critical product risks. The suite's distribution of coverage, informed by a Critical Flow Register (Part XV), tracks the product's actual distribution of business risk rather than the path of least resistance in test construction (Part VI).
Level 6 — Test signals correlate reasonably with real production failure patterns. A Signal-to-Incident Review (Part XVIII) shows that what the suite catches, and what it misses, tracks what actually happens in production — closing the loop between pre-production evidence and real-world outcomes.
Deliberately, this is not called a maturity model, and no organization is being told it must reach Level 6 to be considered well-tested — the appropriate level of rigor for a given system depends on that system's actual risk, and pushing every corner of a codebase to Level 6 would itself violate the Evidence Density principle from Part XII. What the Ladder is useful for is placing a familiar sentence in context. "We have 10,284 passing tests" is, at most, a claim about Level 1 and part of Level 2. It says nothing, by itself, about Levels 3 through 6 — which is exactly the space where the opening incident's blind spot was hiding the entire time.
[Visual concept: A six-rung vertical ladder, each rung labeled with its level name and a one-line description, with a small marker showing where "10,284 passed / 0 failed" would land — clearly near the bottom, at Levels 1–2, with the remaining rungs visibly unaddressed by that number alone.]
Part XXI: The Executive Dashboard Should Look Different
If a single composite score can't reliably represent test quality — and the preceding twenty sections have argued, from several different angles, that it can't — then the natural next question is what a founder or CTO should actually look at instead. Not forty QA metrics, and not one fake average of them either.
A composite score, however appealing on a slide, hides risk by construction: a "Quality Score: 87" could represent a suite that's uniformly decent everywhere, or a suite that's excellent in low-risk areas and dangerously thin in a single critical one, and the number alone cannot distinguish between those two very different situations — which is precisely the distinction that matters most to a business.
A more honest executive view shows several dimensions side by side, deliberately uncollapsed. The following is illustrative, with clearly hypothetical values — not a benchmark, not a target, and not a claim about what any real organization's numbers should look like:
Critical Flows: 18 of 20 identified critical flows have defined, reviewed automated protection (Critical Flow Register, Part XV).
Suite Stability: 97.8% First-Pass Integrity this release cycle (Part IX).
Flakiness: 22 tests responsible for the majority of reruns over the trailing 90 days — a concentrated, addressable cluster rather than diffuse noise (Part IX–X).
Detection Strength: Mutation testing applied specifically to the pricing and authentication modules this quarter, with survived mutants under active review (Part V).
Escapes: 3 high-severity regressions reached production this quarter, each carried through a completed Escape Analysis (Part XVI).
Defect Replay: 2 of 3 identified gaps closed with verified fail-on-bad, pass-on-good protection; 1 remains open (Part XVII).
Production Signal: No current regression pattern correlated with the authentication flow area in this quarter's Signal-to-Incident Review (Part XVIII).
| Dimension | Illustrative example | What it protects against being hidden |
|---|---|---|
| Critical Flows | 18 / 20 protected | A high overall test count masking a gap in one vital workflow |
| Suite Stability | 97.8% first-pass | A pass rate inflated by silent retries |
| Flakiness | 22 repeat-offender tests | Diffuse noise masquerading as isolated incidents |
| Detection Strength | Mutation testing on pricing + auth | Coverage that executes code without checking it |
| Escapes | 3 high-severity, each analyzed | Defect counts with no attached diagnosis |
| Defect Replay | 2 of 3 gaps verifiably closed | Fixes without confirmed regression protection |
| Production Signal | No correlated regression pattern | Testing activity disconnected from real outcomes |
None of these values are industry benchmarks, and presenting them as such — "here's what good looks like" — would repeat the exact mistake this article has spent its length warning against. The value of this dashboard shape isn't the specific numbers; it's that each dimension answers a distinct question the composite score would have quietly merged together, and a leadership team looking at seven honest, separate signals is in a meaningfully better position to ask the right follow-up question than a team looking at one confident-sounding average.
Part XXII: Different Layers Provide Different Evidence
It's worth revisiting the familiar list of test layers — unit, component, API, contract, integration, end-to-end, exploratory, production monitoring — with a question this article hasn't yet asked directly about them: not "how many tests should live at each layer" (the well-worn test-pyramid conversation), but what type of failure is each layer particularly good at exposing, and what does it structurally tend to miss?
Unit tests are fast and precise instruments for logic sensitivity — they're the natural home for the kind of value-level assertion described in Part IV, and the layer where mutation testing tends to be most practical and most informative, because the code under test is small and isolated enough to mutate exhaustively. What they structurally can't see: how that logic behaves once it's wired into the rest of the system, or whether the assumptions it was built against still match reality.
Component tests verify a larger unit's behavior in relative isolation — closer to how a piece of UI or a service actually gets used, while still avoiding the cost and flakiness of full integration. They catch composition errors that pure unit tests, by design, can't see, while still missing genuine cross-system issues.
API and contract tests are specifically well suited to catching interface drift — the exact class of problem described in Part VIII, where a mock's assumptions silently diverge from a real dependency's actual behavior. What they typically don't catch: whether the business logic behind a correctly shaped interface is actually correct.
Integration tests, run against real or realistic dependencies, are the layer built to catch the specific gap that heavy mocking creates — genuine behavioral mismatches between components that each look fine in isolation. Their cost is speed and determinism, which is exactly why they're not the right default layer for everything, contrary to the instinct described at the end of Part XVII.
End-to-end tests are the layer most capable of catching genuinely cross-system, user-journey-level failures — the kind that only appear when several components interact in sequence, the way a real customer would actually experience them. Their cost is speed, fragility, and diagnostic clarity — an E2E failure often requires real investigation to determine which of several components in the chain actually caused it.
Exploratory testing, discussed at more length in Part XXIII, is uniquely capable of catching the kind of ambiguity, unexpected interaction, and weak assumption that no scripted test — because it's scripted — was ever going to think to check.
Production monitoring is the layer that catches conditions pre-production testing structurally cannot reproduce: real load patterns, real third-party behavior under real conditions, real data at real scale, and the genuine edge of "we didn't know this was possible until a customer did it."
The point of laying these out side by side isn't to relitigate the test pyramid's shape. It's to make the case that these layers provide complementary, not redundant, evidence — and that a suite heavily concentrated at one layer, however large, is systematically blind to the categories of failure that only a different layer is well suited to catch. A thousand additional unit tests will not catch a genuine cross-system contract drift. A thousand additional end-to-end tests will not efficiently pinpoint which specific line of pricing logic is wrong. Matching the layer to the failure mode it's meant to expose is a more useful design question than asking how many tests, in total, a healthy suite should contain.
Part XXIII: Manual Exploration Is Not a Failure of Automation
It's worth being direct about something that a heavily automation-focused engineering culture can lose sight of: the existence of exploratory, human-led testing is not evidence that automation is incomplete. It's a distinct source of evidence that scripted automation, by its nature, cannot fully replace — because scripted tests can only check for the specific things someone thought to write an assertion for, while exploratory testing is specifically suited to surfacing the things nobody thought to check in the first place.
The categories where this shows up most reliably: genuine ambiguity in how a feature is supposed to behave, which often only becomes visible when a human actually tries to use it rather than reads a specification of it; unexpected interaction between features that were each individually well tested but never tested together, in combination, by anyone; realistic user behavior that diverges from the paths a test author imagined when writing scripted scenarios; visual and usability inconsistency that a functional assertion, checking values rather than appearance, simply isn't built to notice; and weak assumptions baked into the product or the tests themselves, the kind that are invisible until someone approaches the system without the same mental model as the person who built it.
Kept narrowly focused on this article's actual subject — test-suite trust, not human judgment in general — the useful framing is this: exploratory discoveries are a direct source of evidence about where the automated suite's blind spots actually are. A defect found through exploratory testing that the automated suite missed is functionally the same kind of signal as an escaped production defect, and deserves the same treatment: run through Escape Analysis (Part XVI), and where appropriate, converted into new automated protection through Defect Replay (Part XVII) — not because manual testing "failed" to prevent the discovery, but because manual testing succeeded at finding something the automation genuinely couldn't have found on its own, and that finding is now available to strengthen the automated layer for next time. A mature organization treats each exploratory discovery as an input to three separate systems: the automated suite, which can now be strengthened at the specific layer best suited to catch it; the requirements process, if the discovery reveals a genuine ambiguity in what "correct" means; and production monitoring, if the discovery reveals a condition worth watching for even after the immediate defect is fixed.
Part XXIV: AI-Generated Tests Make This Question More Important
AI-assisted test generation deserves a section of its own in this article — not as an organizing theme, the way it has been in other long-form pieces, but as one more force acting on the underlying question this entire article has been building toward: not how many tests exist, but whether they're any good.
What AI genuinely does well, based on current tooling and early research, is lower the marginal cost of producing test artifacts — scenarios, test code, data variations, assertion scaffolding, mocks and fixtures. This is a real capability, and it means test quantity can now increase dramatically faster than it used to, for a given amount of engineering time invested. That capability is worth taking seriously rather than dismissing, and it's also worth being precise about exactly what it does and doesn't solve.
A useful recent data point comes from academic research specifically evaluating agent-generated tests against human-written ones on real open-source projects, rather than relying on vendor claims. That research reported a genuinely counterintuitive finding: AI agents outperformed human authors specifically on edge-case coverage, producing close to twice the variety of boundary condition checks as human-written tests in the same codebases, along with a notably higher frequency of null-safety testing. This is worth taking seriously as evidence against a common assumption — that AI-generated tests are reflexively shallow or happy-path-biased compared to human ones. On this specific dimension, in this specific study, the opposite was true.
At the same time, separate research specifically examining the stability of LLM-generated tests — rather than their scenario coverage — has identified flakiness as a genuine, distinct concern in AI-generated suites, worth naming with its actual methodology rather than as a blanket claim. Research analyzing LLM-generated tests against database management systems found specific patterns of non-determinism tied to how generated tests handle asynchronous behavior and external dependencies, distinct from the flakiness patterns typically seen in human-written suites. The broader flaky-test literature this article draws on for Parts IX and X — including large-scale empirical studies analyzing hundreds of flaky tests across dozens of real projects — has found that flakiness often clusters by shared root cause rather than distributing evenly, a pattern that plausibly compounds when large volumes of AI-generated tests are produced quickly, using similar generation patterns, without the same layer of individual human review that a hand-written suite would typically receive.
It would be a mistake to collapse either of these findings into a sweeping claim — "AI tests are more thorough" or "AI tests are flaky" — without naming the specific study, its methodology, and its scope, which is why both are presented here with their actual framing rather than as settled industry consensus. What the current evidence supports is narrower and, for the purposes of this article, more useful: AI-assisted generation appears capable of genuinely improving certain dimensions of test quality — edge-case variety, in at least the cited study — while introducing or inheriting other risks around stability and assertion depth that existing suite-quality practices, developed for human-written tests, are not automatically equipped to catch just because the source of the test changed.
None of the diagnostic tools this article has built — the Assertion Strength Spectrum, mutation testing, Escape Analysis, Defect Replay, First-Pass Integrity — care where a test came from. A weak, presence-level assertion generated by an AI tool in three seconds has exactly the same evidential limitation as a weak, presence-level assertion a human spent twenty minutes writing. The important shift AI-assisted generation introduces isn't a new category of risk requiring an entirely new framework — it's a change in proportion: as the cost of producing test volume falls sharply, the cost of evaluating whether that volume represents genuine evidence, rather than an inflated Level 1 on the Confidence Signal Ladder from Part XX, becomes proportionally more important, not less. A team that can now generate ten times as many tests per sprint, without a corresponding investment in checking whether those tests actually assert anything meaningful, is simply producing the Coverage Mirage from Part III at a faster rate than before.
[Visual concept: A simple two-axis chart — x-axis "test generation speed," y-axis "evaluation rigor" — showing a widening gap between a steeply rising generation-speed line and a flat evaluation-rigor line, labeled as the growing risk zone.]
Part XXV: How to Audit a Green Suite
Everything so far has been diagnostic vocabulary. This section and the next two turn it into something a team can actually run — deliberately structured differently from the kind of 90-day, sprint-based improvement programs that show up elsewhere in testing literature, because the goal here isn't a rollout plan. It's a focused audit that a team can complete in days, not quarters.
The 100-Test Sample
Reviewing an entire suite of ten thousand-plus tests, line by line, is not a realistic use of anyone's time, and attempting it usually produces a superficial pass that misses more than it finds. A more tractable approach — call it the 100-Test Sample, an article methodology rather than an industry standard, with the specific number being illustrative rather than prescriptive — is to deliberately select a representative cross-section of roughly a hundred tests, chosen specifically for diversity rather than convenience:
Tests covering identified critical workflows (Part XV); tests in modules with high recent change frequency, where new defects are statistically more likely to be introduced; tests in areas with a documented history of past defects (an input the Signal-to-Incident Review from Part XVIII can help identify); a mix of API-level and UI-level tests; a mix of integration and unit-level tests; deliberately old tests, some of which may have accumulated Coverage Drift (Part XI); deliberately new tests, which haven't yet been through a full audit cycle; tests with a known history of flakiness (Part IX); and, specifically, tests that almost never fail — the candidates from Part XIX worth checking for weak Detection Sensitivity.
For each sampled test, a consistent set of questions turns individual inspection into a pattern-finding exercise rather than a hundred disconnected judgment calls:
What behavior is this test actually claiming to verify — reading the assertions directly, not the test's name or the ticket it references (Part I)? What would specifically make this test fail — walking through, concretely, what change in the underlying code would cause the assertion to break? What could be wrong in the system while this test still passes — the inverse question, and often the more revealing one? How realistic is the state and data this test constructs, relative to what a real account or user actually looks like (Part VII)? Does this test depend heavily on mocks, and if so, how recently was the mock's behavior checked against the real dependency it represents (Part VIII)? Has this test, as far as anyone can determine, ever actually caught a real defect — or has it existed, quietly passing, since it was written? Does this test meaningfully overlap with another test already in the sample, suggesting duplicated rather than additional evidence (Part XII)? Would anyone notice, in practice, if this specific test disappeared tomorrow? And what production risk, specifically, does this test protect against — can that risk be named in a sentence, or does the answer require guessing?
Run consistently across a hundred deliberately varied tests, this exercise tends to reveal patterns much faster than a targeted deep-dive into one module would — a cluster of tests that all share the same weak assertion style, a cluster that all depend on the same aging mock, a cluster concentrated in the same easy-to-automate happy-path territory described in Part VI. The value of the sample isn't statistical precision across the full ten-thousand-test suite; it's pattern recognition, cheap enough to actually complete, applied broadly enough to be representative.
Part XXVI: Run Controlled Challenges
Sampling and inspection surface likely weaknesses. Confirming them requires actually testing the alarm system, not just reading its wiring diagram — and there are several defensible ways to do this without taking any real risk with production systems.
Mutation testing, covered at length in Part V, is the most rigorous of these — a mechanical, repeatable way of asking whether the suite would notice a specific class of introduced defect, scoped to whatever modules the sample identified as highest-risk or highest-uncertainty.
Deliberately reverting a known bug fix, in an isolated branch, and running the relevant tests against the reintroduced defect is a direct, low-effort version of Defect Replay (Part XVII) applied preemptively rather than only after a new incident — essentially, re-asking "would we catch this again" for past defects, not just the most recent one.
Historical defect replay more broadly — systematically working back through a list of past production incidents and checking whether current tests would catch each one if it recurred today — builds an evidence base over time about which categories of past mistakes the suite is now protected against, and which remain open.
Intentionally changing an assertion's target — briefly modifying an expected value in a test to something subtly and deliberately wrong, then confirming the test correctly fails — is a fast, low-tech sanity check on whether a specific assertion is actually wired up correctly, catching the surprisingly common case of a test that would pass regardless of what the assertion claimed to check, due to a setup bug in the test itself.
Introducing controlled contract mismatches in a test or staging environment — deliberately altering a mocked or virtualized dependency's response shape in a way that mirrors a plausible real-world API change — tests specifically whether the suite's Mock Distance (Part VIII) would actually get caught before it caused a real incident.
All of these techniques share a firm boundary: every deliberate fault belongs in a controlled, isolated test environment, never in production, and never in any environment handling real customer data or real transactions. The objective throughout is narrow and specific — does the alarm system actually alarm — and answering that question honestly requires occasionally, deliberately, setting off a controlled false alarm to confirm the wiring works, rather than assuming it does because the light has never gone off.
Part XXVII: Delete a Test?
Most engineering cultures are comfortable adding tests and deeply uncomfortable removing them — deletion feels like it's giving something up, even when the "something" being given up is closer to noise than protection. This asymmetry is worth confronting directly, because it's a meaningful contributor to the Coverage Drift and Evidence Density problems from Parts XI and XII.
Obsolete and duplicate tests are not free to keep around. They add to feedback-loop length, they add to flakiness exposure simply by existing, they add maintenance burden every time an unrelated change happens to touch code they cover, and — perhaps most subtly — they add to the sheer cognitive cost of understanding what the suite as a whole actually protects, making every future audit, including the 100-Test Sample from Part XXV, slower and less reliable.
Reasonable criteria for considering deletion or consolidation, applied deliberately and with review rather than as a blanket cleanup sweep: the test provides evidence genuinely duplicated by another test already in the suite, adding no unique signal; the requirement or behavior it was written to verify no longer exists in the product; the workflow it exercises is no longer reachable by any real user; the same risk is now covered more efficiently and reliably at a lower, faster layer (a slow E2E test made redundant by a newer, targeted unit test covering the same underlying logic); the test has been permanently quarantined, contributing zero active protection, with no realistic plan to restore it; or the test carries high ongoing maintenance cost relative to a genuinely negligible unique contribution to Detection Sensitivity.
The emphasis on deliberate and reviewed is not incidental. Deleting tests should never be optimized as its own goal — a team that starts tracking "tests removed" as a success metric has simply invented a new, inverted version of the exact Goodhart's Law problem described in Part XIII, where the count itself becomes the target rather than the underlying quality of evidence it was supposed to represent. The objective of this section is stronger evidence, not a smaller number — and sometimes achieving stronger evidence means removing something that was quietly diluting it.
Part XXVIII: Why QA Metrics Are Easy to Game
It's worth stating directly what the last several sections have implied throughout: nearly every metric discussed in this article can be gamed, individually, if it's treated as an isolated target rather than one input among several.
A high automation percentage can hide a suite full of low-value, easily-automated scenarios that contribute little to actual risk coverage, while genuinely difficult, genuinely important scenarios remain manual or untested, simply because they were harder to automate and the percentage didn't require them specifically. A low escaped-defect count can reflect weak external reporting channels or under-resourced production monitoring just as easily as it can reflect a genuinely well-tested product — the count measures what got reported, not what actually happened. A high pass rate can reward quietly suppressing or quarantining flaky tests rather than fixing their underlying cause, since a test that no longer runs cannot fail. And, in one of the more perverse inversions worth naming plainly, a high bug count found during testing can look, superficially, like strong QA productivity, when it might just as easily indicate a codebase producing an unusually large number of defects in the first place — the metric conflates "we're catching a lot" with "there's a lot to catch," and the two have very different implications for engineering leadership.
The practical response to this pervasive gameability isn't abandoning metrics — it's combining categories of evidence that are harder to game simultaneously than any one is individually: leading indicators (like mutation sensitivity and Critical Flow Register completeness) alongside lagging indicators (like escaped defects and production incident correlation), plus qualitative review of the kind the 100-Test Sample provides, which resists gaming specifically because it requires actual human judgment applied to actual test content rather than an aggregatable number. It's also worth stating a specific, concrete recommendation directly: leadership should avoid designing compensation, promotion, or performance review criteria around any single isolated QA metric from this article's portfolio. The moment a number becomes someone's incentive, it stops reliably measuring what it was designed to measure — and that isn't a hypothetical risk, it's the specific, well-documented mechanism this section has just walked through, metric by metric.
Part XXIX: Quality Metrics Should Start With a Decision
A simple discipline cuts through most of the metric-selection paralysis a portfolio this large can otherwise produce: before adding any metric to a dashboard, ask what specific engineering decision would actually change if that number moved.
If the flaky-test rate increases, the associated decision is straightforward: invest engineering time in stabilization, likely starting with the repeat-offender cluster from Part IX. If escaped defects cluster specifically around billing, the decision is to prioritize strengthening billing-specific verification, likely starting with a targeted mutation-testing pass and a Data Realism Gap review of billing test fixtures. If Critical Flow Register review reveals a gap in automated protection for a genuinely critical flow, the decision is to prioritize closing that specific gap, whether through automation or, where automation genuinely can't reach, through strengthened observability. If mutation sensitivity comes back low specifically in the pricing module, the decision is to review that module's assertions and scenario coverage directly, informed by the surviving mutants themselves, which point precisely at what's missing.
If a metric doesn't have an associated decision — if a number moving up or down wouldn't actually change what anyone does next — it may simply be dashboard decoration: something that looks like rigor without functioning as one.
Decision-Bearing Metrics
This article's term for the alternative is Decision-Bearing Metrics: a metric qualifies as decision-bearing when a meaningful change in its value would trigger a specific, defined engineering response, identifiable in advance rather than invented after the fact to justify tracking the number. This is a useful filter to apply retroactively, too — an organization with an existing dashboard can go through it metric by metric and ask, honestly, which ones have ever actually changed a decision, and which have simply been trending in the background, unexamined, regardless of what value they show.
Part XXX: A Founder Does Not Need 40 QA Metrics
Everything in this article's portfolio has a legitimate use — but not all of it belongs in front of a founder, CTO, or VP Engineering on a routine basis. Most leadership audiences are better served by a small, carefully chosen set of signals, while QA and engineering teams retain the deeper operational detail underneath, available when a specific question requires it.
A reasonable, non-exhaustive set of executive-level signals, drawn from the groups established in Part XIV: critical-flow protection, from the Critical Flow Register; escaped high-impact defects, run through Escape Analysis; first-pass suite stability, as a proxy for whether the suite's results can currently be trusted; known major test blind spots, surfaced through the 100-Test Sample or a Signal-to-Incident Review; regression effectiveness and Defect Replay findings, showing not just that incidents happened but whether they were actually closed with verified protection; and production quality outcomes generally, read alongside — never substituted for — delivery-wide metrics like change failure rate.
This article deliberately does not prescribe an exact universal number of executive-level metrics — six, in the illustration above, is a reasonable working figure, not a rule. What matters more than the count is the underlying principle: leadership needs enough distinct signals to ask a good follow-up question, and no more than that, while the engineering and QA organization underneath continues to track far greater operational detail — the kind this article has spent thirty sections building out — without every layer of that detail needing to surface on an executive dashboard to be genuinely useful.
Part XXXI: A Worked Green-Suite Autopsy
It's time to return, in full detail, to the incident this article opened with — not to re-tell it, but to actually run the autopsy, applying the diagnostic vocabulary built across the preceding thirty sections to the specific mechanics of how a green dashboard and a real production defect coexisted.
The defect, again: a customer on annual billing, carrying an existing promotional account credit, who added seats during an active billing period, received an incorrect renewal amount. Nothing about any one of those three conditions was unusual in isolation. Annual billing was a common plan choice. Promotional credits were a standard part of the sales process. Mid-cycle seat additions happened constantly as customers grew. It was the specific combination of the three, applied to the proration and credit calculation together, that produced a wrong number — and the test suite, ten thousand-plus tests strong, said nothing about it.
Code coverage. The pricing calculation module showed excellent coverage — in the high nineties, by line count. Every relevant branch of the proration logic, every relevant branch of the credit-application logic, executed regularly across the existing test suite. By the narrowest reading of "is this code tested," the answer was unambiguously yes. This is precisely the Coverage Mirage from Part III in its purest form: a number that looked reassuring and was, on its own terms, entirely accurate — and entirely insufficient to have prevented anything.
Automation existed, generously. Multiple dedicated billing tests covered renewal behavior — new account renewals, plan upgrades, downgrades, cancellations, several promotional scenarios individually. The team had clearly invested real effort in billing test coverage. This wasn't a case of an under-tested area being ignored; it was a case of substantial testing effort concentrated in the Happy-Path Comfort Zone from Part VI — real scenarios, individually well covered, that simply never intersected with each other in the specific combination that mattered.
Why green, specifically — three compounding causes, not one.
First, test data. Every renewal test in the relevant suite used freshly created accounts, on default billing terms, with no promotional history — a textbook Data Realism Gap (Part VII). No fixture in active use represented an annual-billing account carrying an existing credit balance and an active seat change in the same billing period, because constructing that specific combination of state was more effort than constructing any of the three conditions individually, and nothing had forced the team to prioritize that effort.
Second, mocking. The service responsible for tracking and applying promotional credit balances was mocked in the relevant tests, and the mock had been configured — plausibly, reasonably, at the time it was first written — to always return a credit balance of zero. Every test that depended on this mock inherited that assumption invisibly. This is Mock Distance (Part VIII) in a specific and consequential form: not a mock that had drifted from a changed real service, but a mock whose original, narrow assumption had never been revisited as new scenarios were layered on top of it.
Third, and most directly, assertion strength. The renewal tests that did exist checked that an invoice object was successfully generated — a structural assertion, on the Assertion Strength Spectrum from Part IV — rather than checking that the invoice's amount matched the correct calculation for the scenario — a value assertion, one level up, that would have directly caught the defect. Coverage and mocking created the conditions for the gap to exist undetected; the assertion gap is what meant that even the one relevant end-to-end test that came close to the real combination still had nothing to say about whether the number itself was right.
A fourth, smaller factor compounded the picture without being the root cause: one relevant end-to-end test experienced an intermittent failure during this specific release and was automatically retried into a pass, as noted in Part IX. That retry did not cause the incident — the deeper causes above would have produced a green result with or without it — but it's a reminder that First-Pass Integrity, tracked honestly, is one more layer of evidence a team could have reviewed, and didn't, because nothing surfaced it as worth a second look.
Corrective actions taken, mapped to the specific mechanism each one addresses:
Pricing tests were strengthened at the unit level, closest to the actual calculation logic, with value-level assertions checking exact expected renewal amounts across the specific combination of conditions that had broken — directly addressing the Assertion Gap.
A representative fixture was added — an annual account, with an active promotional credit balance, undergoing a mid-cycle seat change — and made part of the standard fixture library going forward, directly addressing the Data Realism Gap, and available to any future test that needs to represent this class of account.
A contract test was added against the promotional-credit service, verifying that the mock's assumed response shape and behavior actually matched the real service's current contract, directly addressing Mock Distance — with a note added for periodic review, since a contract test verifies alignment at the moment it's written, not permanently.
The specific defect was run through full Defect Replay (Part XVII): reproduced, confirmed to pass against the old test suite despite being broken, confirmed to fail against the new strengthened tests when the old defective code was reintroduced in isolation, and confirmed to pass again once the actual fix was restored.
Mutation testing was applied specifically to the pricing module going forward, as part of ongoing Detection Strength tracking (Part V and Part XIV), rather than as a one-time exercise tied only to this incident.
Production monitoring was extended to flag renewal-amount anomalies — invoices whose amount deviates unexpectedly from a projected value based on account history — as a backstop specifically for the category of defect that pre-production testing, even after these fixes, might still miss in some future variant nobody has yet imagined.
The lesson, stated plainly: this was never a story about "we forgot to write a test." It was a story about several independently reasonable engineering decisions — a convenient mock default, a fast structural assertion, a fixture library that grew scenario by scenario rather than combination by combination — compounding into a blind spot that no single decision, examined in isolation, looks obviously wrong. That's what makes Green Suite Autopsies genuinely useful: they rarely reveal one villain. They reveal a system of quietly compatible weaknesses, each individually defensible, that only become visible once someone traces the specific path a real defect took through them.
[Visual concept: A layered "autopsy" diagram showing the renewal request passing through four horizontal bands — Coverage, Data, Mocking, Assertion — each band shown as technically "passing," with a small red thread running invisibly through all four before finally surfacing as a customer-visible incident at the bottom.]
Part XXXII: What Trusted Testing Looks Like
It would be dishonest to close this out with a definition like "no bugs escape" — no realistic test suite, at any organization, achieves that, and any framework that implies otherwise is selling something rather than describing something.
A genuinely trustworthy test system, by the standards this article has tried to build across its length, is one that makes clear claims — where a reader could look at any given test and state, specifically, what it does and does not certify (Part I). It fails when meaningful behavior changes, a property that can actually be verified rather than assumed, through mutation testing or equivalent controlled challenge (Parts V and XXVI). It represents the states and combinations that matter, not just the ones that were easiest to construct (Parts VI and VII). It stays stable enough that its results are actually believed by the people who see them, rather than reflexively reran or ignored (Parts IX and X). It evolves as the product does, rather than quietly protecting a version of the product that no longer exists (Part XI). It learns systematically from what gets past it, through Escape Analysis and Defect Replay, rather than treating each production incident as an isolated surprise (Parts XVI and XVII). And it combines automated evidence with production reality, checking periodically whether what the suite catches actually lines up with what the product does in the world, rather than trusting the suite's self-reported health in isolation (Part XVIII).
Trust, built this way, is earned incrementally, through an observable track record of detection performance — not granted upfront by a large test count, and not restored automatically by adding more tests after an incident, unless those new tests are actually verified, through the fail-on-bad, pass-on-good discipline of Defect Replay, to detect what they claim to detect.
Green Is a Status, Not a Guarantee
Return, one last time, to the number this article opened with.
10,284 passed
10,284 passed
That number is real, and it is useful. It tells you the suite executed. It tells you that, for every test that ran, the expectation encoded inside it was satisfied under the conditions that test constructed. That's a legitimate, meaningful fact about the state of the codebase at that moment — not nothing, and not something to dismiss.
But it does not tell you whether those encoded expectations were strong enough to matter — whether they sat near the top or the bottom of the Assertion Strength Spectrum. It does not tell you whether the states and combinations that carry real business risk were the ones actually represented in the suite's data, rather than the ones that happened to be convenient to construct. And it does not tell you, on its own, whether the suite would have noticed if something important had quietly gone wrong — which is, when it comes down to it, the entire reason a test suite exists in the first place.
None of the twenty thousand-plus words above are an argument against automation, against coverage, against pass/fail dashboards, or against the discipline of getting a build to green before it ships. They are an argument for treating "green" as the start of a confidence conversation rather than its conclusion — for asking, routinely and specifically, what a given green result actually claims, and whether that claim was ever seriously tested against the possibility of being wrong.
A trustworthy test suite is not one that stays green. It is one that turns red for the right reasons before customers discover them.
When an automated suite is large but confidence in it remains genuinely uncertain — when a team has all the passing tests and none of the certainty that should come with them — the problem is rarely solved by writing more tests indiscriminately. It's usually solved by the kind of targeted work this article has walked through: auditing regression coverage against actual business risk rather than code structure, strengthening assertions where they're currently doing less work than their names suggest, reducing flakiness at its root rather than around its edges, closing the gaps a Critical Flow Register makes visible, and connecting what the suite catches back to what actually happens in production. QAtronic works with SaaS and engineering teams on exactly that kind of audit and remediation work — regression strategy, test automation, security testing, and the harder question of whether an existing suite's confidence is actually earned.
A note on evidence
Some figures in this article — the release scenario, the specific incident, the illustrative dashboard values in Part XXI — are deliberately hypothetical and labeled as such; they're used to make abstract diagnostic concepts concrete, not to represent real client data or claimed benchmarks. Where research is cited, it's attributed to its specific source, study, or documentation, and readers should keep several limitations in mind when applying any of it. Benchmark values and study findings depend heavily on the dataset, language ecosystem, and population they were drawn from, and rarely generalize cleanly to every codebase or team. Delivery-wide metrics like change failure rate and mean time to detection do not directly measure test-suite quality; they measure broader system outcomes that testing contributes to alongside deployment practice, observability, and incident response. There is no universal coverage percentage or test-count threshold that applies correctly across contexts, and any source claiming otherwise should be read skeptically. Finally, the following terms are analytical frameworks introduced specifically for this article, not established industry standards, even where they build on real, well-documented underlying concepts: the Green Suite Autopsy, Scope of the Claim, Coverage Mirage, Assertion Strength Spectrum, Detection Sensitivity, Data Realism Gap, Mock Distance, First-Pass Integrity, Signal Trust, Coverage Drift, Evidence Density, Critical Flow Register, Escape Analysis, Defect Replay, Signal-to-Incident Review, Confidence Signal Ladder, Decision-Bearing Metrics, and the 100-Test Sample.
Sources and Further Reading
- DORA — State of DevOps Research and the Four Keys — foundational research on deployment frequency, lead time, change failure rate, and recovery time, including the framework's evolution away from fixed "elite/high/medium/low" tiers in more recent research cycles.
- Google Cloud Blog — Use Four Keys Metrics Like Change Failure Rate to Measure DevOps Performance — Google's own framing of the Four Keys and their distinction between throughput and stability metrics.
- Stryker Mutator — Mutant States and Metrics — authoritative documentation on mutation score calculation, killed/survived/no-coverage states, and test-level mutation metrics.
- Stryker Mutator — Equivalent Mutants — documentation on why 100% mutation score is not always achievable and how equivalent mutants distort the score.
- PIT (PITest) — Java Mutation Testing Documentation — documentation for the widely used JVM mutation testing tool, including Maven/Gradle integration and mutation thresholds.
- Google Testing Blog — Code Coverage Best Practices — Google engineering's own account of coverage's diagnostic value and structural limitations, including the role of mutation testing in exposing false coverage.
- Parry, O., Kapfhammer, G. M., Hilton, M., and McMinn, P. — Systemic Flakiness: An Empirical Analysis of Co-Occurring Flaky Test Failures (arXiv, April 2025) — large-scale empirical study on flaky test clustering across Java projects.
- Beyond Test Presence: Assessing the Quality and Robustness of Agent-Generated Tests in Open-Source Projects (arXiv, 2026) — comparative empirical study of AI-agent-generated versus human-written tests, including edge-case coverage and null-safety testing variety.
- On the Flakiness of LLM-Generated Tests for Industrial and Open-Source Database Management Systems (arXiv, 2025) — empirical analysis of stability issues specific to LLM-generated test suites.
- Tesena — Defect Detection Effectiveness — historical background and definition of DDE, tracing its origin through Bill Hetzel's and Fewster & Graham's independent formulations.
- Fowler, M. — The Practical Test Pyramid — canonical reference on test layering and the tradeoffs between test types.



